Extratropical transition of Leslie
![GOES-16 Low-level (7.3 µm, left), Mid-level (6.9 µm, center) and Upper-level (6.2 µm, right) Water Vapor images [click to play animation | MP4]](https://cimss.ssec.wisc.edu/satellite-blog/wp-content/uploads/sites/5/2018/09/180925_180926_goes16_water_vapor_Leslie_anim.gif)
GOES-16 Low-level (7.3 µm, left), Mid-level (6.9 µm, center) and Upper-level (6.2 µm, right) Water Vapor images [click to play animation | MP4]
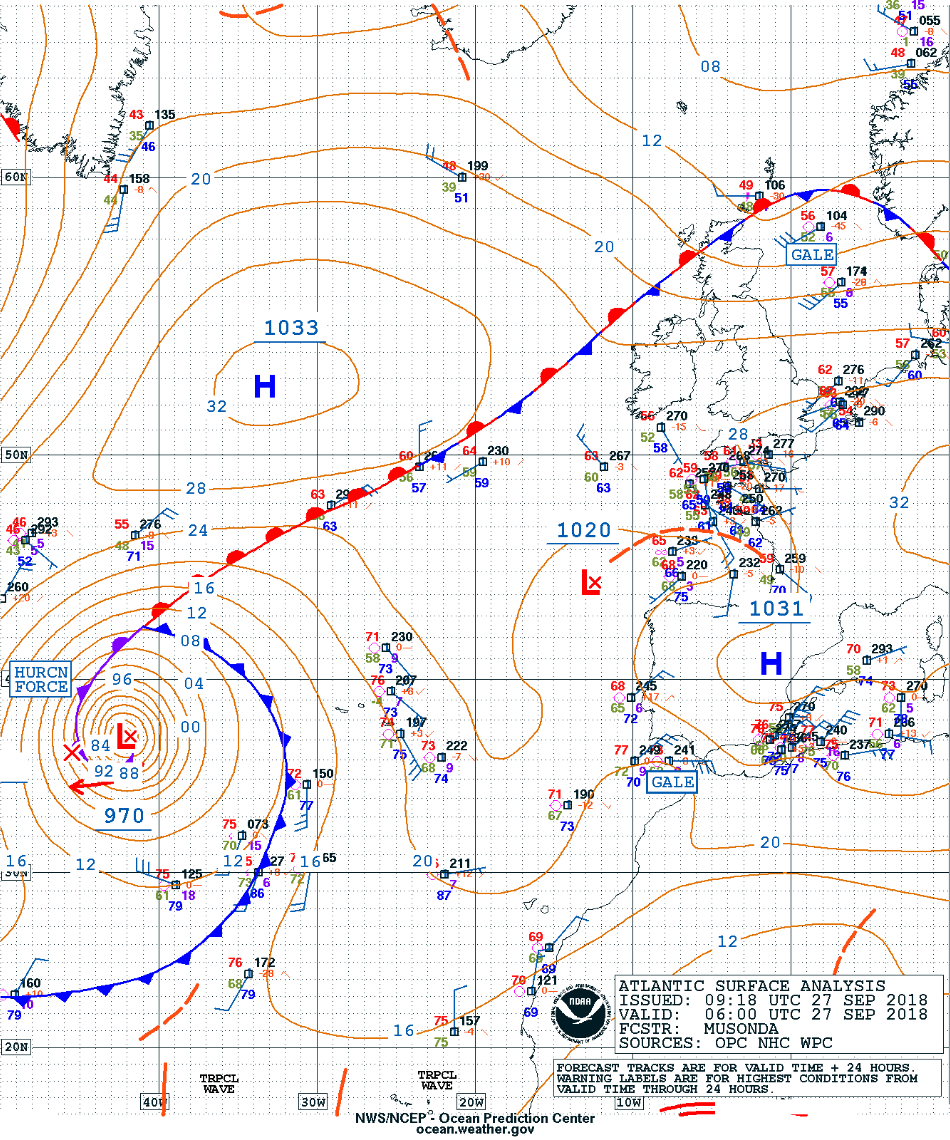
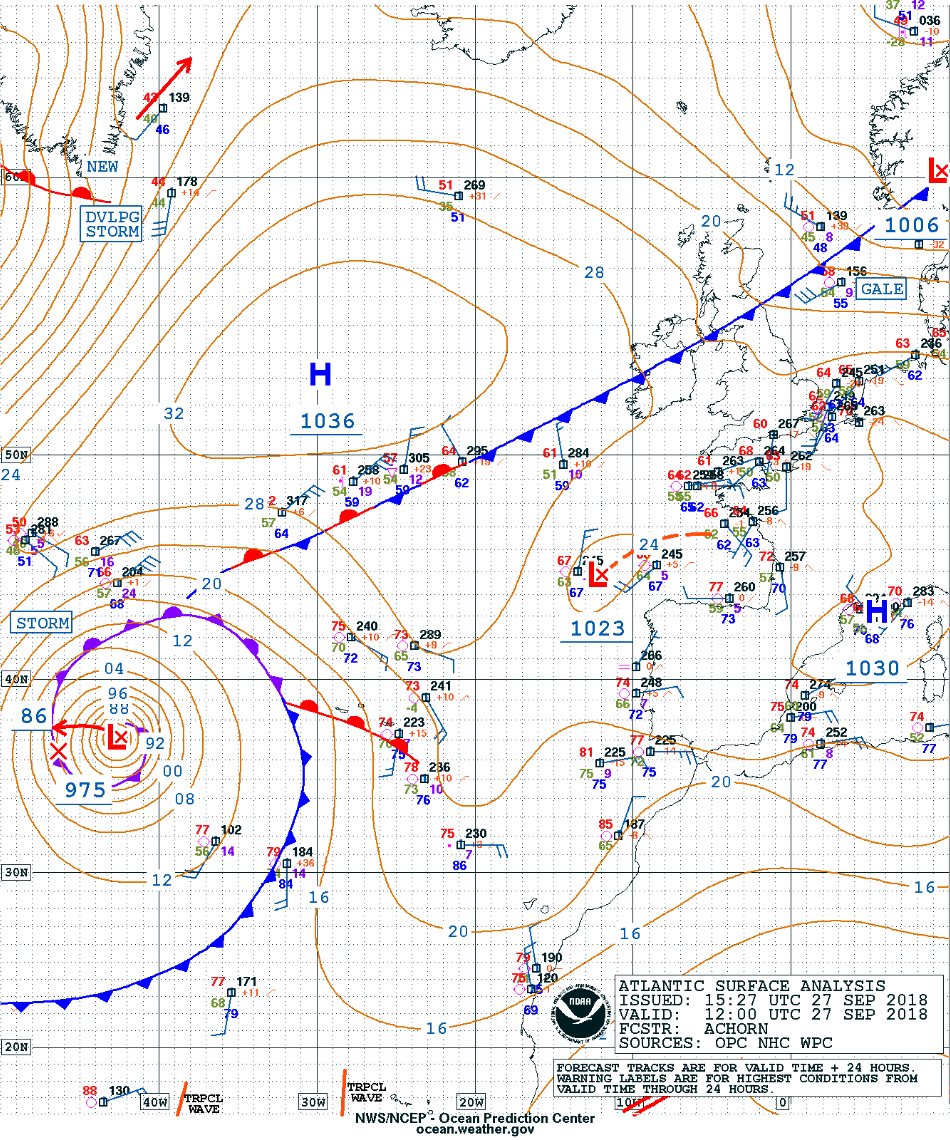
Surface analyses during this 48-hour period are shown below; Leslie is located in the lower left corner. A longer animation (from 21-27 September) revealed the slowly-meandering circulation centers of pre- and post-Leslie (animated GIF | MP4).
![Surface analyses at 6-hour intervals [click to play animation | MP4]](https://cimss.ssec.wisc.edu/satellite-blog/wp-content/uploads/sites/5/2018/09/180925_180926_surface_analyses_Lesie_anim.gif)
Surface analyses at 6-hour intervals [click to play animation | MP4]
![GOES-16 Upper-level (6.2 µm) Water Vapor images, with contours of the PV1.5 pressure surface plotted in red [click to play animation | MP4]](https://cimss.ssec.wisc.edu/satellite-blog/wp-content/uploads/sites/5/2018/09/180926_goes16_water_vapor_pv1.5_band8_Leslie_anim.gif)
GOES-16 Upper-level (6.2 µm) Water Vapor images, with contours of the PV1.5 pressure surface plotted in red [click to play animation | MP4]
![GOES-16 Mid-level (6.9 µm) Water Vapor images, with contours of the PV1.5 pressure surface plotted in red [click to play animation | MP4]](https://cimss.ssec.wisc.edu/satellite-blog/wp-content/uploads/sites/5/2018/09/180926_goes16_water_vapor_pv1.5_band9_Leslie_anim.gif)
GOES-16 Mid-level (6.9 µm) Water Vapor images, with contours of the PV1.5 pressure surface plotted in red [click to play animation | MP4]
![GOES-16 Low-level (7.3 µm) Water Vapor images, with contours of the PV1.5 pressure surface plotted in red [click to play animation | MP4]](https://cimss.ssec.wisc.edu/satellite-blog/wp-content/uploads/sites/5/2018/09/180926_goes16_water_vapor_pv1.5_band10_Leslie_anim.gif)
GOES-16 Low-level (7.3 µm) Water Vapor images, with contours of the PV1.5 pressure surface plotted in red [click to play animation | MP4]
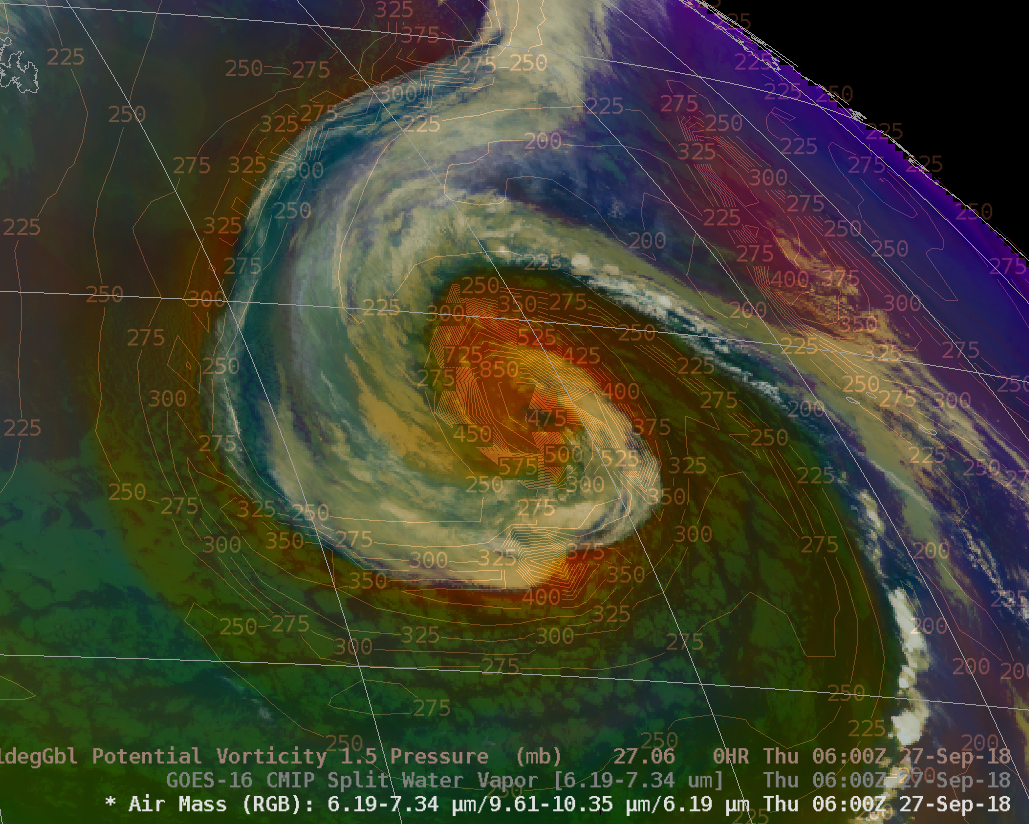
![GOES-16 Air Mass RGB images, with contours of PV1.5 pressure [click to play animation | MP4]](https://cimss.ssec.wisc.edu/satellite-blog/wp-content/uploads/sites/5/2018/09/AirMassRGB_with_PatPV1.5_1000_to_2215_26Sep2018.gif)
GOES-16 Air Mass RGB images, with contours of the PV1.5 pressure surface plotted in green [click to play animation | MP4]
#GOESEast Air Mass loop highlighting the rapid intensification of #Leslie into a #hurricane-force, post-tropical cyclone pic.twitter.com/EfXBAOucBo
— NWS OPC (@NWSOPC) September 27, 2018
An animation of the GOES-16 Air Mass RGB at 6-hour intervals from 00 UTC on 25 September to 12 UTC on 27 September is shown below, with and without contours of PV1.5 pressure. The dynamic tropopause descended to 850 hPa at 06 UTC on 27 September (when the storm was producing hurricane force winds) and eventually to 925 hPa at 12 UTC on 27 September (when it was producing storm force winds). The Air Mass RGB images highlighted the signature of the PV anomaly (shades of red) as it approached from the northwest then wrapped around the western and southern portion of the storm circulation.
![GOES-16 Air Mass RGB images, with and without contours of GFS PV1.5 pressure [click to play animation | MP4]](https://cimss.ssec.wisc.edu/satellite-blog/wp-content/uploads/sites/5/2018/09/180925_180927_goes16_airmassRGB_pv1.5_Leslie_anim.gif)
GOES-16 Air Mass RGB images, with and without contours of GFS PV1.5 pressure [click to play animation | MP4]
The corresponding 6-hourly GOES-16 Split Water Vapor Difference (6.2 µm – 7.3 µm) images (below) show that a signature of the dry air aloft — associated with the aforementioned PV anomaly — was evident as a tongue of negative values in the -10 to -15ºC range (green to gray enhancement) that initially approached the storm from the northwest.
![GOES-16 Split Water Vapor Difference (6.2 µm - 7.3 µm) images, with and without contours of PV1.5 pressure [click to play animation | MP4]](https://cimss.ssec.wisc.edu/satellite-blog/wp-content/uploads/sites/5/2018/09/180925_180927_goes16_waterVaporDifference_pv1.5_Leslie_anim.gif)
GOES-16 Split Water Vapor Difference (6.2 µm – 7.3 µm) images, with and without contours of PV1.5 pressure [click to play animation | MP4]
In cases such as this, the Air Mass RGB and Split Water Vapor Difference can be used in tandem to identify and track PV anomalies (18 UTC / 25 September | 12 UTC / 26 September). Note that east of the storm there also another small PV anomaly moving northward, associated with an upper-level low pressure feature — but this second PV anomaly played no role in the development/intensification of the post-tropical remnants of Leslie.
===== 27 September Update =====
![Sequence of GOES-16 Low-level (7.3 µm), Mid-level (6.9 µm) and Upper-level (6.2 µm) Water Vapor images from 09 UTC on 27 September to 00 UTC on 28 September [click to play animation | MP4]](https://cimss.ssec.wisc.edu/satellite-blog/wp-content/uploads/sites/5/2018/09/180927_goes16_water_vapor_Post_Tropical_Cyclone_Leslie_anim.gif)
Sequence of GOES-16 Low-level (7.3 µm), Mid-level (6.9 µm) and Upper-level (6.2 µm) Water Vapor images from 09 UTC on 27 September to 00 UTC on 28 September [click to play animation | MP4]