1-minute Mesoscale Domain Sector GOES-16 “Red” Visible (0.64 µm) images (above) showed the development of thunderstorms that produced large hail, tornadoes and damaging winds (SPC Storm Reports) across eastern Wyoming, northern Nebraska and southern South Dakota on 10 September 2019. Note that many of the storms exhibited Above-Anvil Cirrus Plumes. Pulsing overshooting tops reached -80ºC and colder (violet pixels)... Read More
GOES-16 “Red” Visible (0.64 µm) images, with SPC Storm Reports plotted in red [click to play animation | MP4]
1-minute
Mesoscale Domain Sector GOES-16 “Red” Visible (
0.64 µm) images
(above) showed the development of thunderstorms that produced large hail, tornadoes and damaging winds (
SPC Storm Reports) across eastern Wyoming, northern Nebraska and southern South Dakota on
10 September 2019. Note that many of the storms exhibited
Above-Anvil Cirrus Plumes. Pulsing overshooting tops reached -80ºC and colder
(violet pixels) just east of Valentine, Nebraska (KVTN) from 0001-0004 UTC (
0002 UTC image) — and a few minutes following their collapse, a
wind gust of 60 mph was reported in that general vicinity.
The corresponding GOES-16 “Clean” Infrared Window (10.35 µm) images are shown below.
![GOES-16 "Clean" Infrared Window (10.35 µm) images, with SPC Storm Reports plotted in cyan [click to play animation | MP4]](https://cimss.ssec.wisc.edu/satellite-blog/wp-content/uploads/sites/5/2019/09/G16_IR_WY_NE_SD_SVR_10SEP2019_2019253_201550_GOES-16_0001PANEL_FRAME00046.GIF)
GOES-16 “Clean” Infrared Window (10.35 µm) images, with SPC Storm Reports plotted in cyan [click to play animation | MP4]
The animation shown below is from an experimental product at CIMSS/SSEC, whereby the contours were produced using a ‘deep learning’ artificial intelligence model that was trained on
ABI imagery and
GLM gridded products to generate the ‘probability of supercell-like features inferred from satellites’, or more concisely, the ‘probability of supercell’. Note that the model does a decent job of identifying active portions of the storms (e.g., persistent Overshooting Tops), which correspond well with severe weather reports.
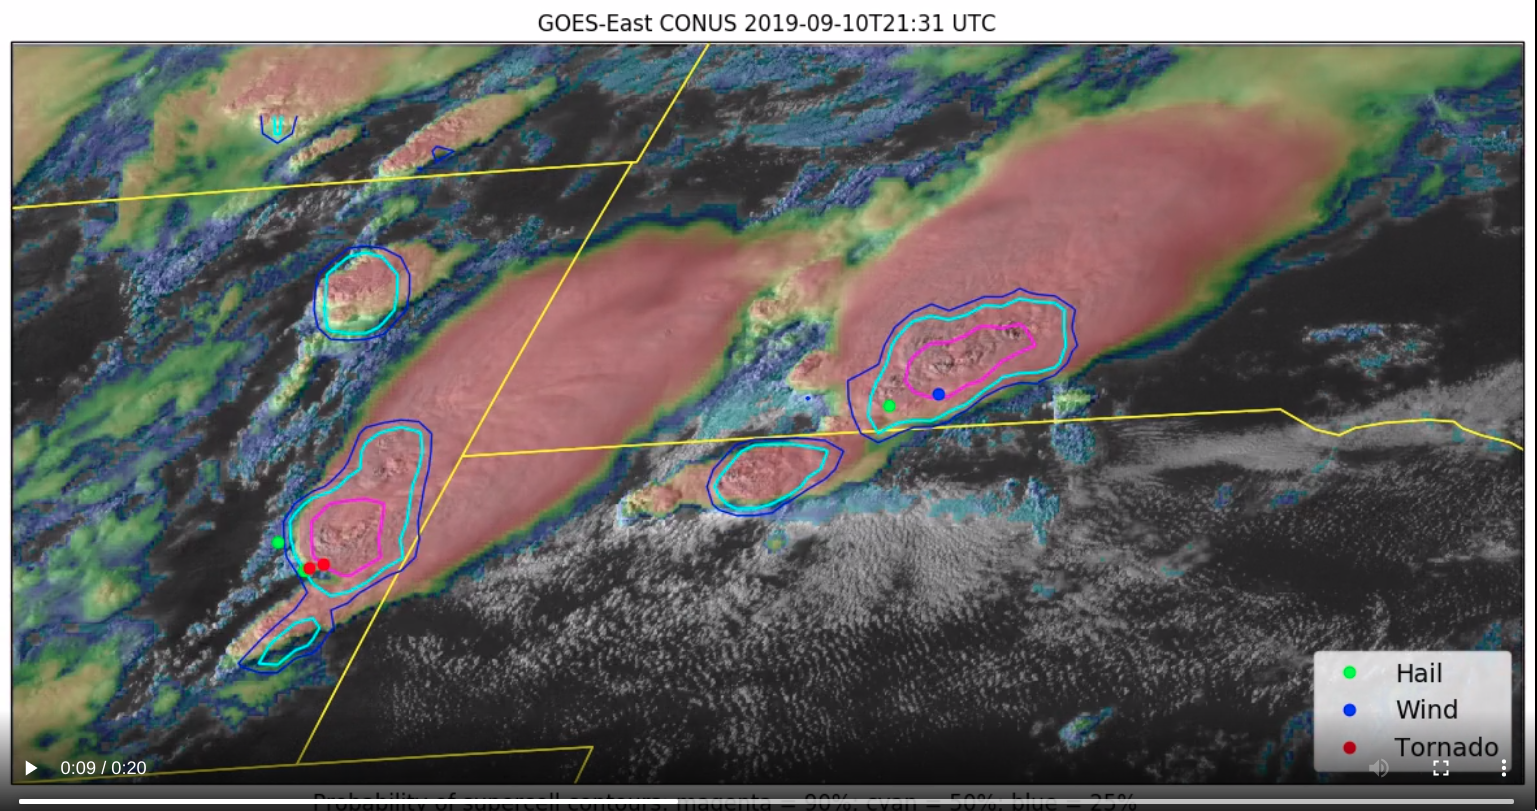
GOES-16 Visible/Infrared Sandwich RGB and “Clean” Infrared Window (10.35 µm) images, with “probability of supercell” contours and SPC Storm Reports (courtesy of John Cintineo, CIMSS) [click to play MP4 animation]
During the subsequent nighttime hours, GOES-16 Infrared images
(below) showed a convective cluster which produced 3 EF-2 tornadoes and damaging winds in and around Sioux Falls, South Dakota (
NWS summary). Note that pulsing overshooting tops west of Sioux Falls (KFSD) exhibited infrared brightness temperatures of -80ºC and colder
(violet pixels) from 0402-0406 UTC (
0404 UTC image), which was about 20 minutes prior to the
first tornado reports.
![GOES-16 "Clean" Infrared Window (10.35 µm) images, with SPC Storm Reports plotted in cyan [click to play animation | MP4]](https://cimss.ssec.wisc.edu/satellite-blog/wp-content/uploads/sites/5/2019/09/G16_IR_NE_SD_SVR_10SEP2019_2019254_042550_GOES-16_0001PANEL_FRAME00056.GIF)
GOES-16 “Clean” Infrared Window (10.35 µm) images, with SPC Storm Reports plotted in cyan [click to play animation | MP4]
View only this post
Read Less
![VIIRS Day/Night Band (0.7 µm) and Visible (0.64 µm) imagery from Suomi NPP and NOAA-20 [click to enlarge]](https://cimss.ssec.wisc.edu/satellite-blog/wp-content/uploads/sites/5/2019/09/190913-190915_suomiNPP_noaa20_viirs_Saudi_Arabia_anim.gif)
![EUMETSAT Meteosat-8 Visible (0.8 µm) images, with hourly plots of surface reports [click to play animation | MP4]](https://cimss.ssec.wisc.edu/satellite-blog/wp-content/uploads/sites/5/2019/09/190914_meteosat8_visible_Saudi_Arabia_anim.gif)
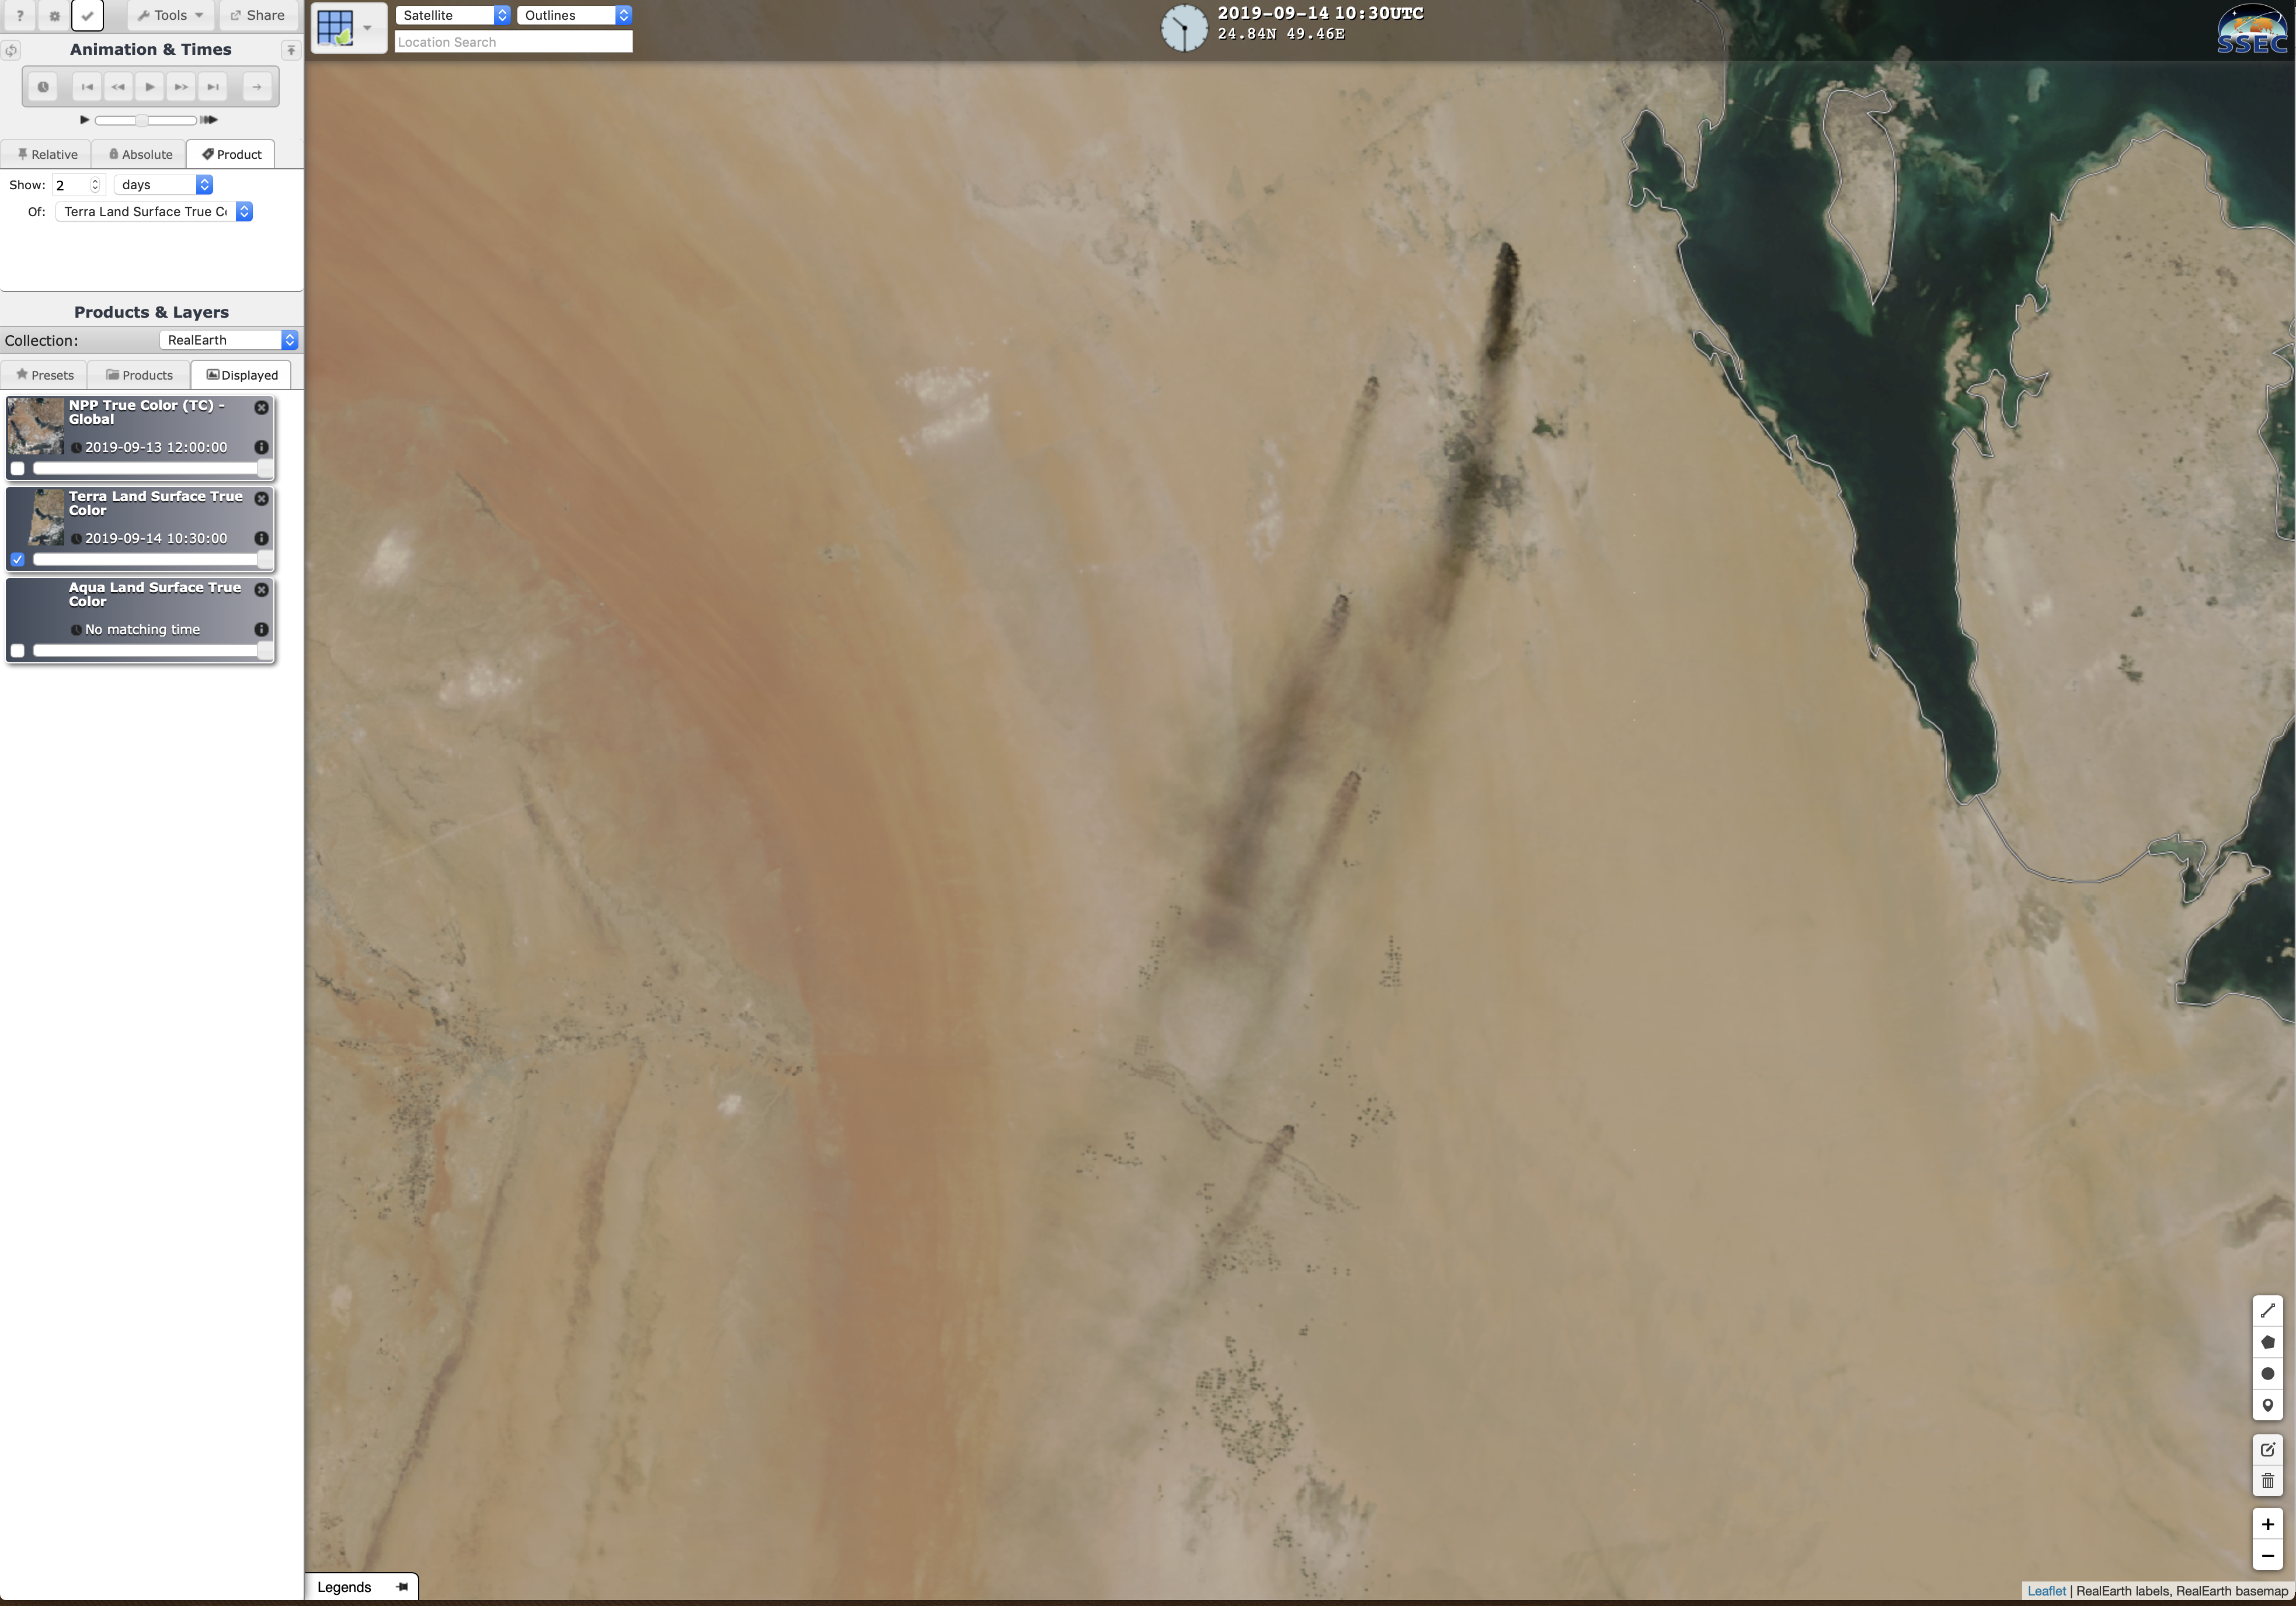
![True Color RGB images from Terra MODIS and Suomi NPP VIIRS, from 13-15 September [click to enlarge]](https://cimss.ssec.wisc.edu/satellite-blog/wp-content/uploads/sites/5/2019/09/190913_190915_modis_viirs_trueColor_Saudi_Arabia_refinery_fires_anim.gif)
![VIIRS Day/Night Band (0.7 µm) from Suomi NPP and NOAA-20 [click to enlarge]](https://cimss.ssec.wisc.edu/satellite-blog/wp-content/uploads/sites/5/2019/09/190915_suomiNPP_noaa20_viirs_dayNightBand_Saudi_Arabia_refinery_fires_anim.gif)
![EUMETSAT Meteosat-8 Visible (0.8 µm) images, with hourly plots of surface reports [click to play animation | MP4]](https://cimss.ssec.wisc.edu/satellite-blog/wp-content/uploads/sites/5/2019/09/190914_190916_meteosat8_visible_Saudi_Arabia_anim.gif)
![Landsat-8 False Color image [click to enlarge]](https://cimss.ssec.wisc.edu/satellite-blog/wp-content/uploads/sites/5/2019/09/190917_0712utc_landsat8_falsecolor_Saudi_Arabia_anim.gif)

![GOES-16 "Clean" Infrared Window (10.35 µm) images, with SPC Storm Reports plotted in cyan [click to play animation | MP4]](https://cimss.ssec.wisc.edu/satellite-blog/wp-content/uploads/sites/5/2019/09/190910_goes16_infrared_WY_NE_SD_anim.gif)
![GOES-16 "Clean" Infrared Window (10.35 µm) images, with SPC Storm Reports plotted in cyan [click to play animation | MP4]](https://cimss.ssec.wisc.edu/satellite-blog/wp-content/uploads/sites/5/2019/09/190910_goes16_infrared_spcStormReports_SD_NE_anim.gif)
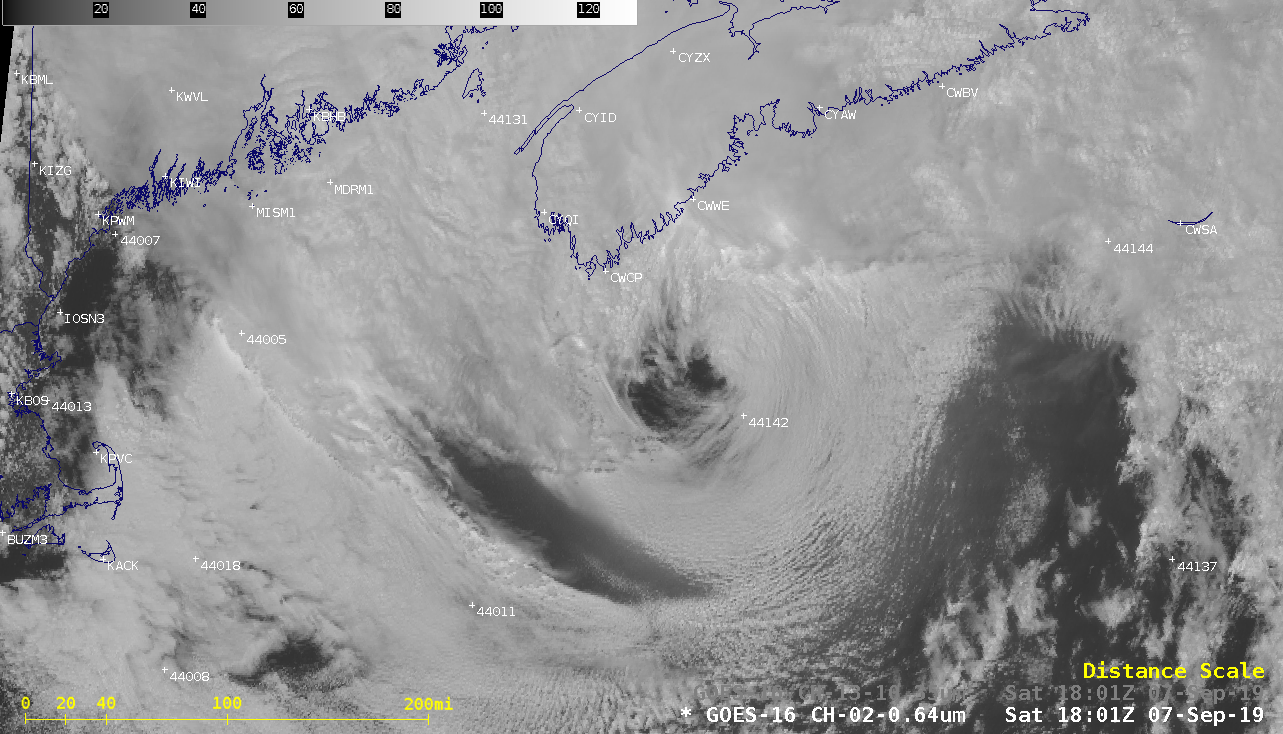
![GOES-16 “Red” Visible (0.64 µm) and “Clean” Infrared Window (10.35 µm) images [click to play animation | MP4]](https://cimss.ssec.wisc.edu/satellite-blog/wp-content/uploads/sites/5/2019/09/190907_goes16_visible_infrared_Dorian_anim.gif)
![VIIRS True Color RGB and Infrared Window (11.45 µm) images from Suomi NPP and NOAA-20 [click to enlarge]](https://cimss.ssec.wisc.edu/satellite-blog/wp-content/uploads/sites/5/2019/09/190907_suomiNPP_noaa20_viirs_trueColor_infraredWindow_Dorian_anim.gif)
![Metop-B ASCAT winds [click to enlarge]](https://cimss.ssec.wisc.edu/satellite-blog/wp-content/uploads/sites/5/2019/09/190907_15utc_metopB_ascat_Dorian.png)
![Suomi NPP VIIRS True Color RGB and Infrared Window (11.45 µm) images [click to enlarge]](https://cimss.ssec.wisc.edu/satellite-blog/wp-content/uploads/sites/5/2019/09/190908_1630utc_suomiNPP_viirs_trueColor_infraredWindow_PTC_Dorian_anim.gif)
