1-minute Mesoscale Domain Sector GOES-16 (GOES-East) “Red” Visible (0.64 µm) and Shortwave Infrared (3.9 µm) images along with 5-minute Fire Power and Fire Temperature products (which are components of the GOES Fire Detection and Characterization Algorithm (SHyMet | ATBD) showed the rapid northeastward run (as fast as 103 feet per minute) of the 13,000 acre “Beaver Fire” (also known as the... Read More

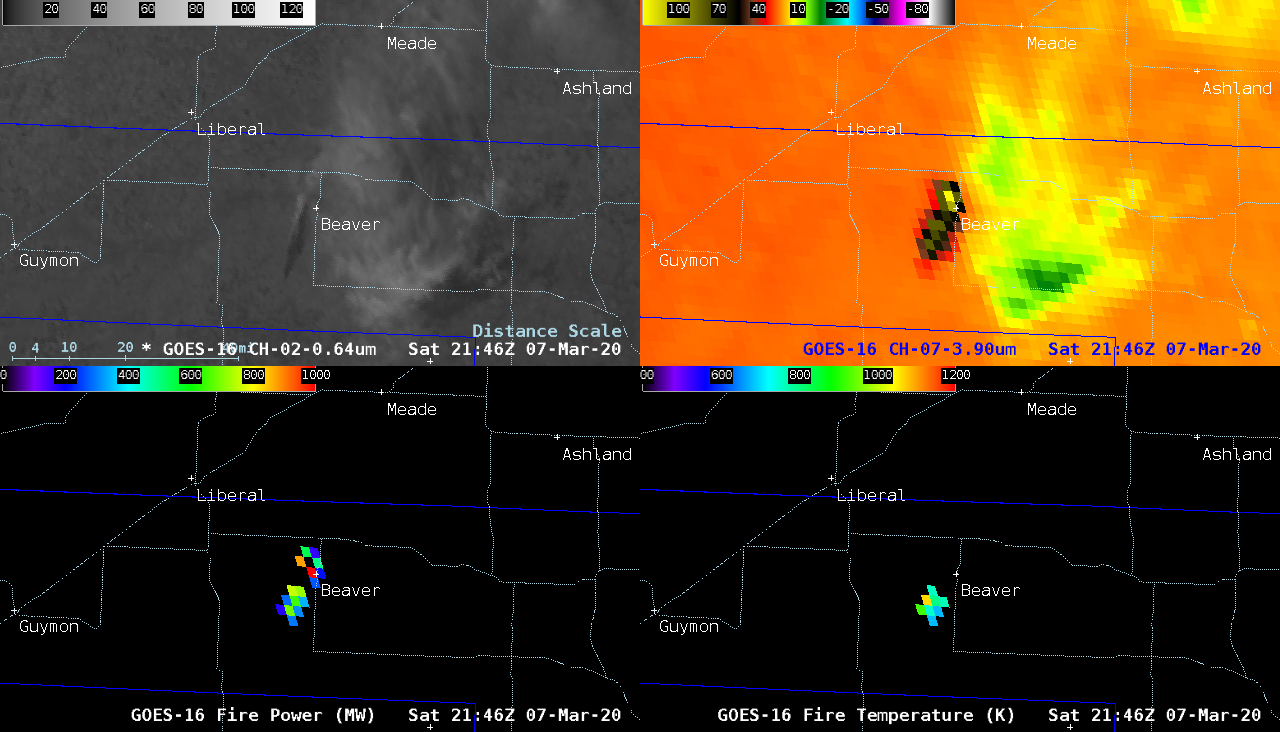
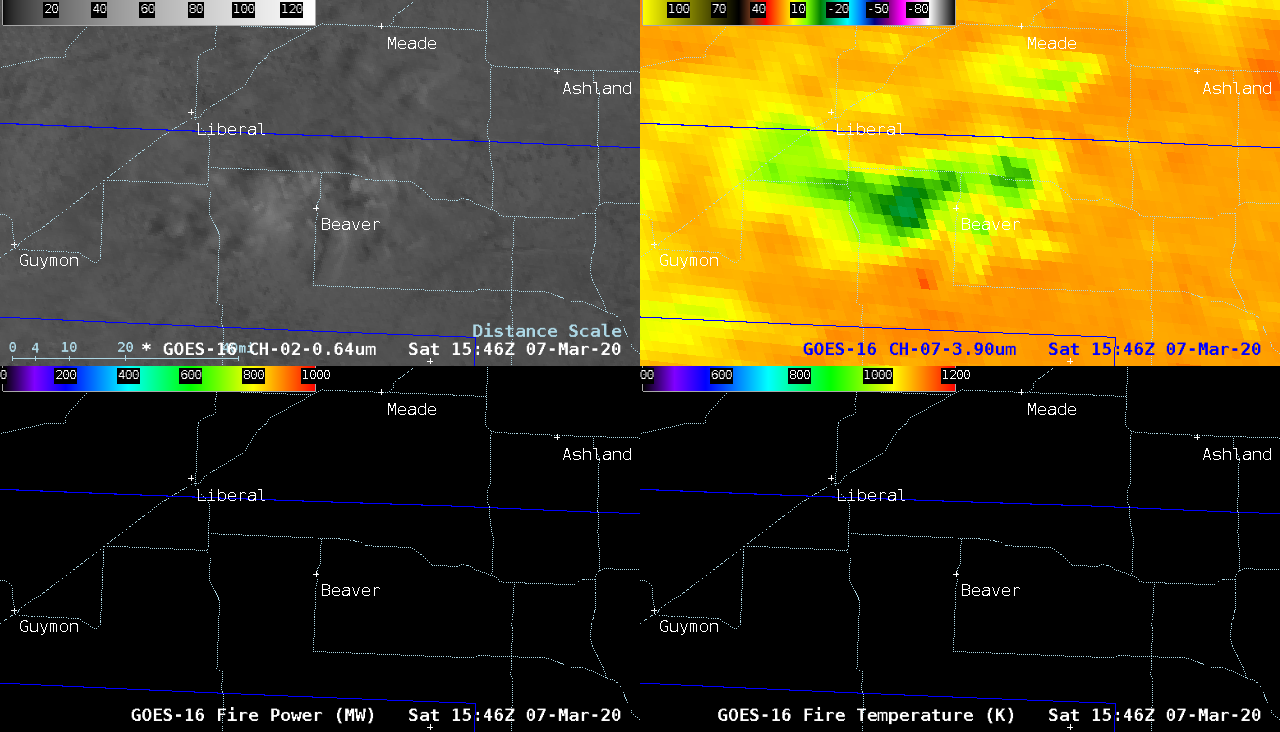
GOES-16 “Red” Visible (0.64 µm, top left), Shortwave Infrared (3.9 µm, top right), Fire Power (bottom left) and Fire Temperature (bottom right) [click to play animation | MP4]
1-minute
Mesoscale Domain Sector GOES-16
(GOES-East) “Red” Visible (
0.64 µm) and Shortwave Infrared (
3.9 µm) images along with 5-minute Fire Power and Fire Temperature products (which are components of the GOES Fire Detection and Characterization Algorithm (
SHyMet |
ATBD)
showed the rapid northeastward run (
as fast as 103 feet per minute) of the 13,000 acre “Beaver Fire” (also known as the “412 Fire”) in the Oklahoma Panhandle on
07 March 2020. An elevated thermal signature on Shortwave Infrared imagery first began to appear southwest of Beaver, OK around
1546 UTC — and 3.9 µm infrared brightness temperatures eventually peaked around 139ºC. Maximum Fire Power and Fire Temperature values exceeded 3100 MW and 2900 K, respectively.
Fire Warnings were issued, with residents of Beaver and Forgan being advised to evacuate as the fire rapidly approached. In Visible imagery, the dark signature of a long, narrow vegetation burn scar was evident — and pyrocumulus clouds were seen developing over the fire.
Extreme fire behavior was aided by
anomalously-strong winds across the southern Plains. The peak wind gust at Beaver, Oklahoma was
46 mph; south of the fire, surface winds were gusting to 43 mph at Perryton (in far the northern Texas Panhandle), and west of the fire winds gusted to 42 mph at Guymon (in the Oklahoma Panhandle). A large-scale animation of 1-minute GOES-16 Visible images from the
AOS site
(below) indicated that the smoke plume was transported northeastward across Kansas and eventually moved over south-central Nebraska. Smoke reduced the surface visibility to
6 miles at Dodge City as it moved across
southwestern Kansas.
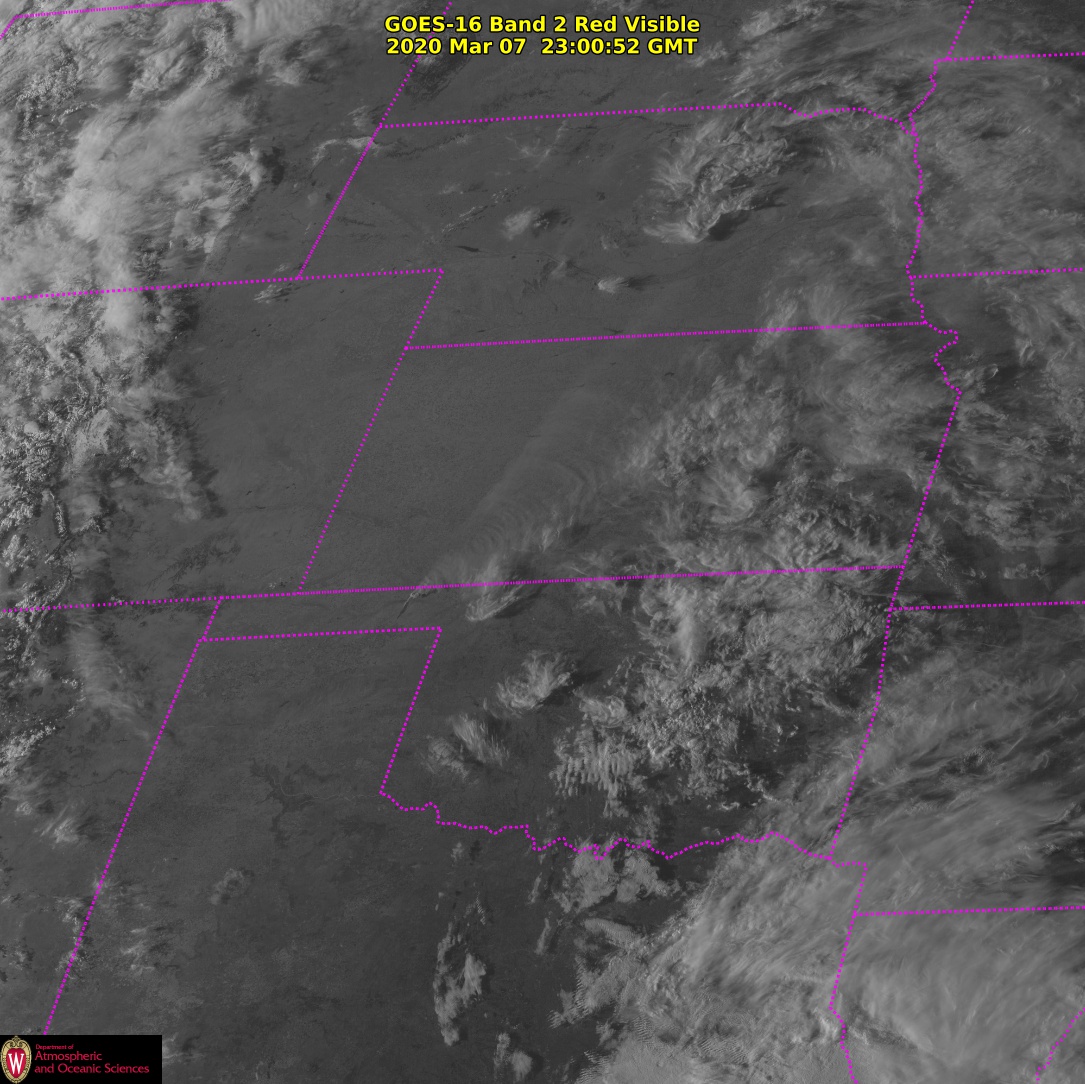
GOES-16 “Red” Visible (0.64 µm) images [click to play animation | MP4]
Shortwave Infrared images from MODIS (3.7 µm) and VIIRS (3.74 µm)
(below) displayed three snapshots of the 10-15 mile long thermal anomaly
(elongated cluster of black pixels) associated with the wildfire.
![Shortwave Infrared images from MODIS (3.7 µm) and VIIRS (3.74 µm) [click to enlarge]](https://cimss.ssec.wisc.edu/satellite-blog/images/2020/03/200307_viirs_modis_shortwaveInfrared_Beaver_Fire_OK_anim.gif)
Shortwave Infrared images from MODIS (3.7 µm) and VIIRS (3.74 µm) [click to enlarge]
===== 08 March Update =====
![NOAA-20 VIIRS Day/Night Band (0.7 µm) and Shortwave Infrared (3.74 µm) images at 0857 UTC [click to enlarge]](https://cimss.ssec.wisc.edu/satellite-blog/images/2020/03/200308_0857utc_viirs_dayNightBand_shortwaveInfrared_OK_fire_anim.gif)
NOAA-20 VIIRS Day/Night Band (0.7 µm) and Shortwave Infrared (3.74 µm) images at 0857 UTC [click to enlarge]
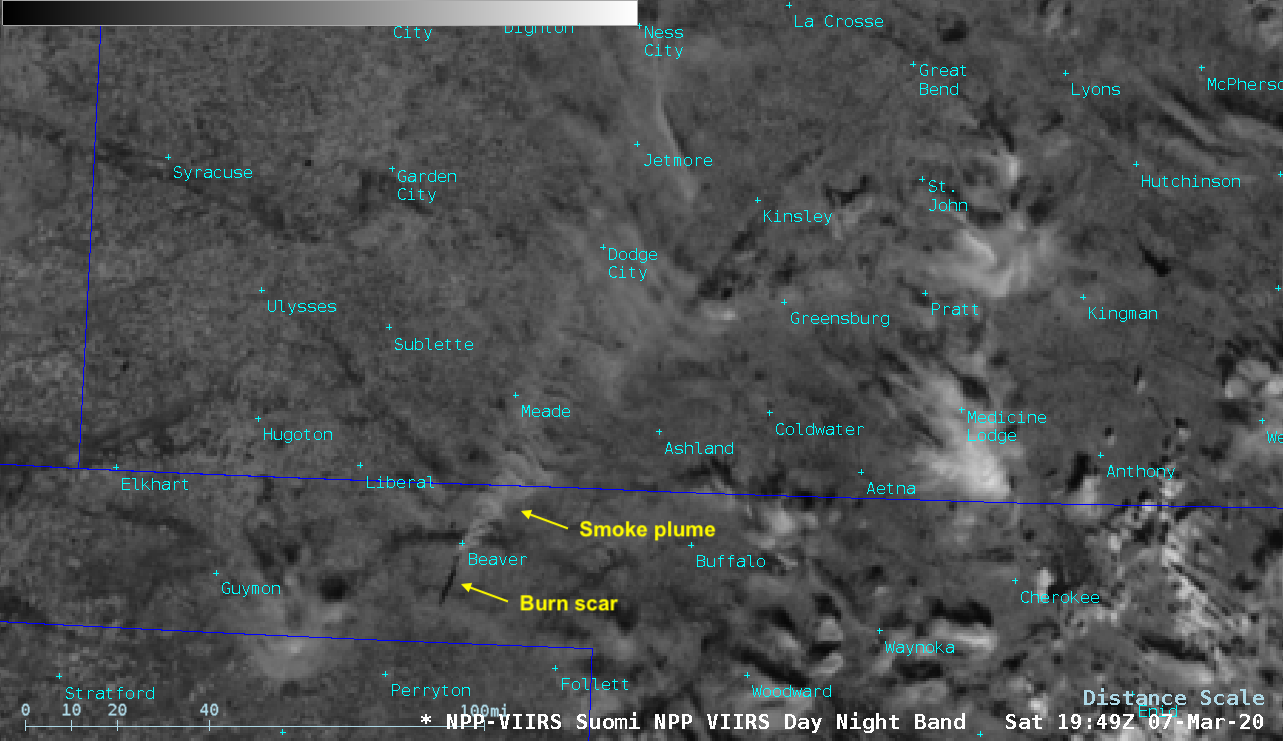
During the subsequent overnight hours, a comparison of NOAA-20 VIIRS Day/Night Band (0.7 µm) and Shortwave Infrared (3.74 µm) images at 0857 UTC or 3:57 am local time
(above) revealed the dark southwest-to-northeast oriented burn scar, with isolated small fires still burning along the northwestern periphery of the burn scar. Note: the NOAA-20 images are incorrectly labelled as Suomi NPP.
===== 09 March Update =====
GOES-16 Land Surface Temperature product and “Red” Visible (0.64 µm) image [click to enlarge]
A toggle between a GOES-16 Land Surface Temperature product and the corresponding Visible image
(above) showed the fire burn scar at 2101 UTC on 09 March. Land Surface Temperature values were 10ºF warmer within the burn scar
(middle 80s F, shades of yellow to orange) compared to areas immediately adjacent to the burn feature.
View only this post
Read Less
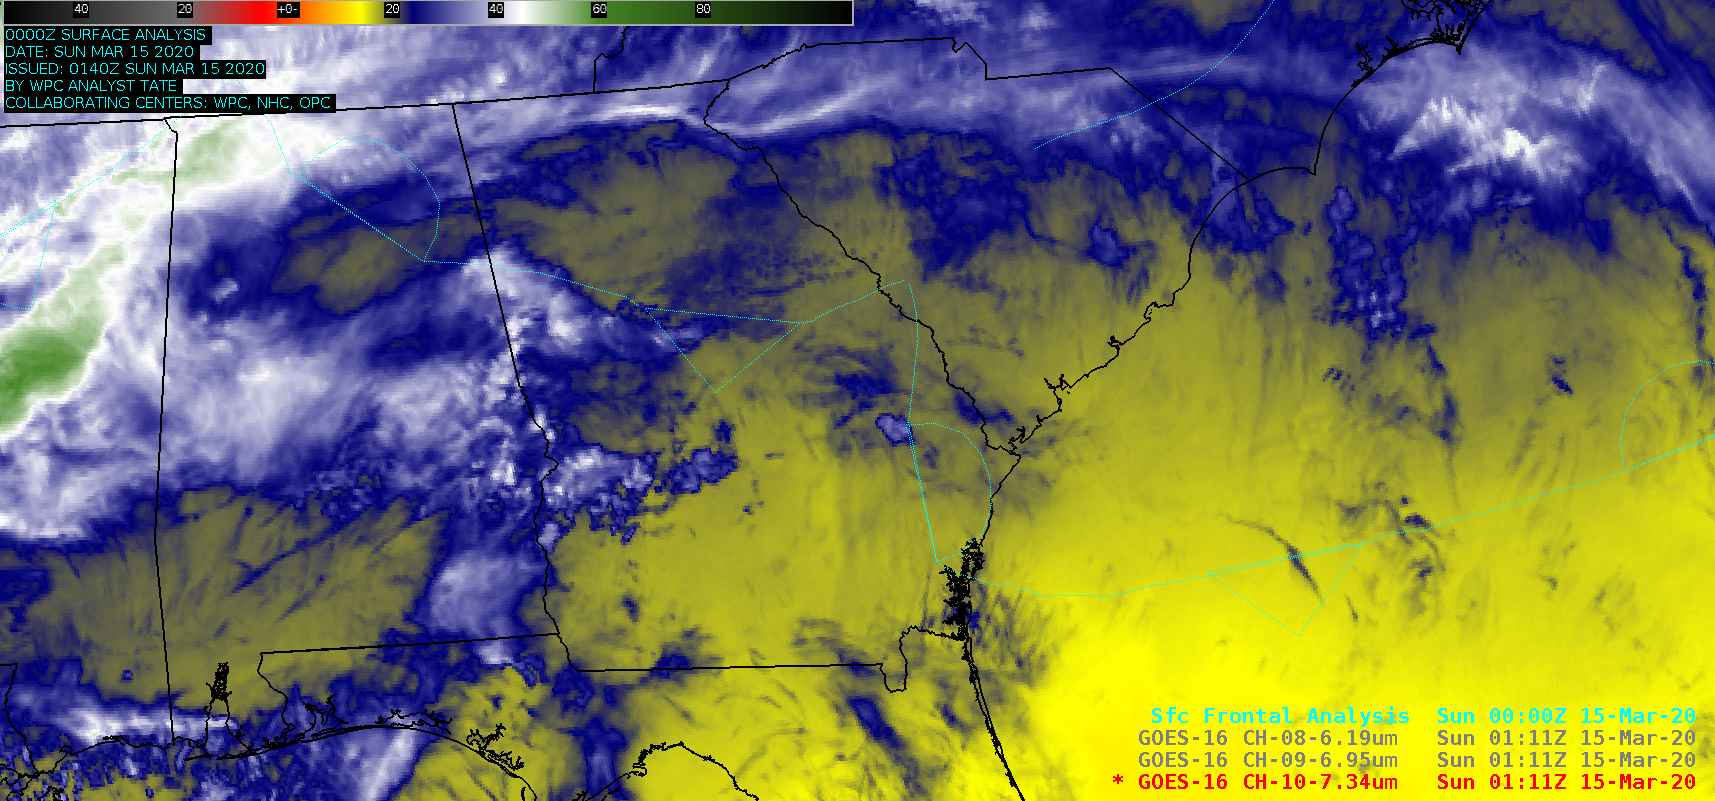
![GOES-16 Low-level (7.3 µm), Mid-level (6.9 µm) and Upper-level (6.2 µm) Water Vapor images [click to play animation | MP4]](https://cimss.ssec.wisc.edu/satellite-blog/images/2020/03/200314_goes16_waterVapor_GA_anim.gif)
![GOES-16 Water Vapor weighting functions at Charleston, South Carolina [click to enlarge]](https://cimss.ssec.wisc.edu/satellite-blog/images/2020/03/200315_00z_kchs_wv_wf.png)
![GOES-16 Water Vapor weighting functions at Jacksonville, Florida [click to enlarge]](https://cimss.ssec.wisc.edu/satellite-blog/images/2020/03/200315_00z_kjax_wv_wf.png)
![GOES-16 Water Vapor weighting functions at Peachtree City, Georgia [click to enlarge]](https://cimss.ssec.wisc.edu/satellite-blog/images/2020/03/200315_00z_kffc_wv_wf.png)
![GOES-16 Shortwave Infrared (3.9 µm) images [click to play animation | MP4]](https://cimss.ssec.wisc.edu/satellite-blog/images/2020/03/200312_goes16_shortwaveInfrared_South_Sandwich_Islands_anim.gif)
![VIIRS True Color RGB images from NOAA-20 and Suomi NPP [click to enlarge]](https://cimss.ssec.wisc.edu/satellite-blog/images/2020/03/200314_noaa20_suomiNPP_viirs_trueColorRGB_South_Sandwich_Islands_vortices_anim.gif)
![GOES-16 "Red" Visible (0.64 µm) images [click to play animation | MP4]](https://cimss.ssec.wisc.edu/satellite-blog/images/2020/03/200314_goes16_visible_South_Sandwich_Islands_anim.gif)

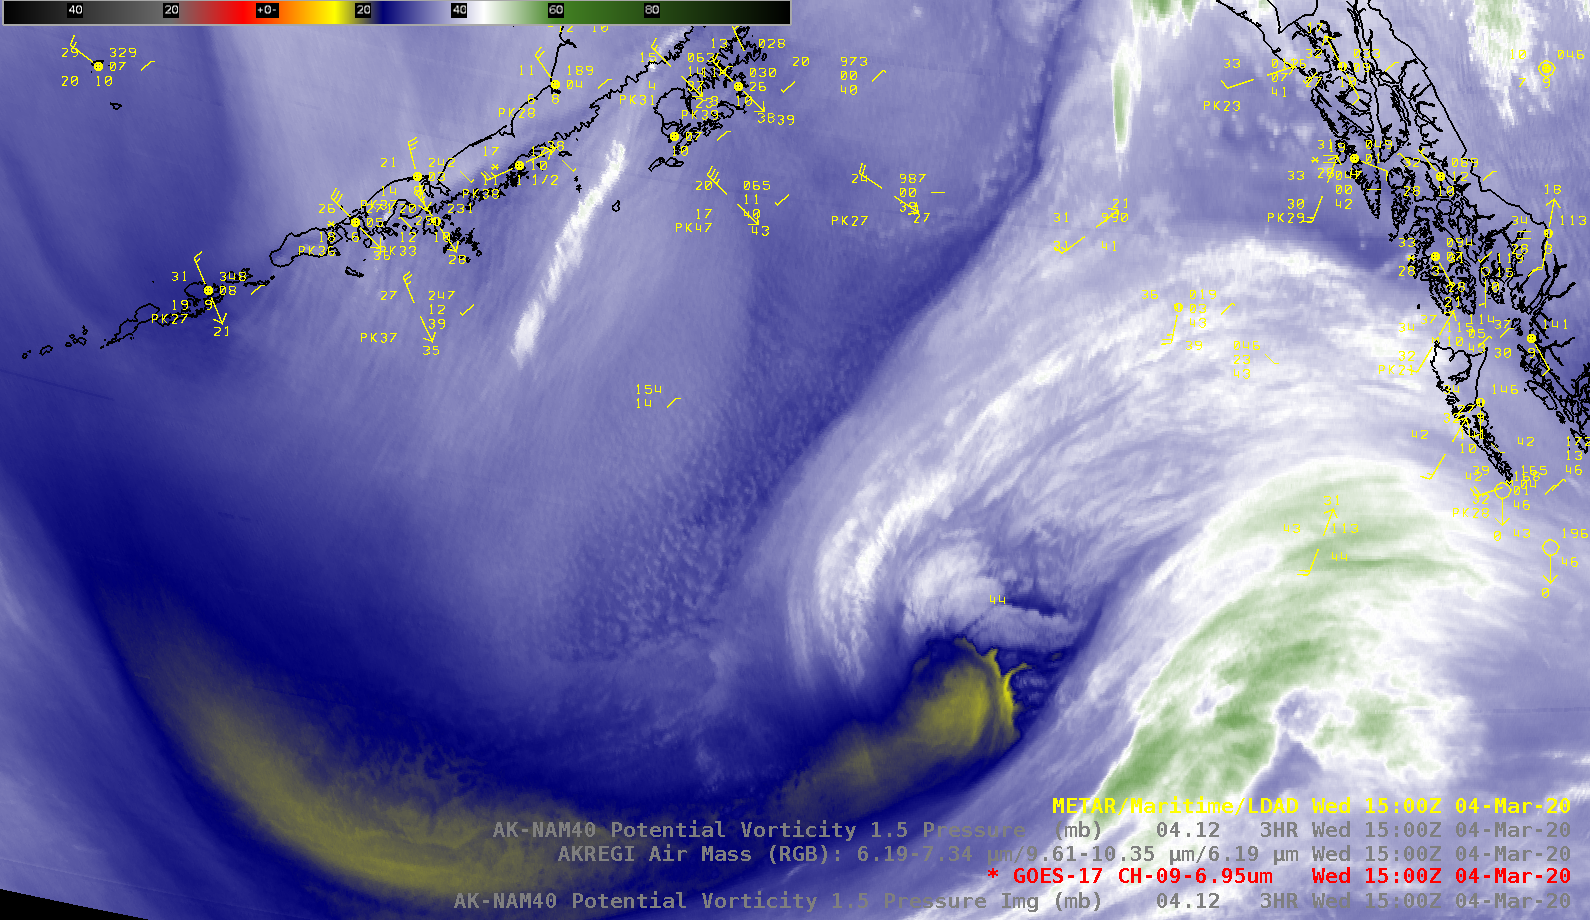
![GOES-17 Mid-level (6.9 µm) and Air Mass RGB images [click to play animation | MP4]](https://cimss.ssec.wisc.edu/satellite-blog/images/2020/03/200304_goes17_waterVapor_airMassRGB_Gulf_of_Alaska_anim.gif)
![GOES-17 Mid-level (6.9 µm) and Air Mass RGB images, with NAM40 PV1.5 pressure [click to enlarge]](https://cimss.ssec.wisc.edu/satellite-blog/images/2020/03/200304_1200utc_goes17_waterVapor_airMassRGB_modelPV1.5_Gulf_of_Alaska_anim.gif)
![GOES-17 "Red" Visible (0.64 µm) images [click to play animation | MP4]](https://cimss.ssec.wisc.edu/satellite-blog/images/2020/03/200304_goes17_visible_Gulf_of_Alaska_anim.gif)
![GOES-17 True Color RGB images [click to play animation | MP4]](https://cimss.ssec.wisc.edu/satellite-blog/images/2020/03/200305_goes17_trueColorRGB_AK_glacial_silt_anim.gif)
