As a winter storm began to organize over Colorado on 19 March 2020, GOES-16 (GOES-East) Mid-level Water Vapor (6.9 um) images (above) showed the developing middle tropospheric cyclonic circulation across the Colorado/Kansas/Nebraska border area. Peak wind gusts included 60 mph in Colorado and Nebraska, and 62 mph in Kansas (WPC Storm Summary).As a result of... Read More
![GOES-16 Mid-level Water Vapor (6.9 um) images, with hourly plots of surface wind barbs and gusts (knots) [click to play animation | MP4]](https://cimss.ssec.wisc.edu/satellite-blog/images/2020/03/G16_WV_WINDS_PLAINS_19MAR2020_B9_2020079_180114_GOES-16_0001PANEL_FRAME00073.GIF)
GOES-16 Mid-level Water Vapor (6.9 um) images, with hourly plots of surface wind barbs and gusts (knots) [click to play animation | MP4]
As a winter storm began to organize over Colorado on
19 March 2020, GOES-16
(GOES-East) Mid-level Water Vapor (
6.9 um) images
(above) showed the developing middle tropospheric cyclonic circulation across the Colorado/Kansas/Nebraska border area. Peak wind gusts included 60 mph in Colorado and Nebraska, and 62 mph in Kansas (
WPC Storm Summary).
As a result of the strong winds, several areas of blowing dust were seen in GOES-16 “Red” Visible (0.64 um), Split Window Difference (10.3-12.3 um) and Dust Red-Green-Blue (RGB) images (below): (1) a well-defined plume that originated in southeastern Colorado and moved northeastward across western Kansas, (2) a smaller plume originating north/northwest of Lamar, Colorado which moved eastward toward the Colorado/Kansas border, (3) a small plume that originated over the burn scar from the 07 March “Beaver Fire” in the Oklahoma Panhandle, and (4) multiple narrow plumes of dust in the wake of a cold front that moved southeastward across the region late in the day (which reduced the surface visiblity to 2 miles in southwestern Kansas).
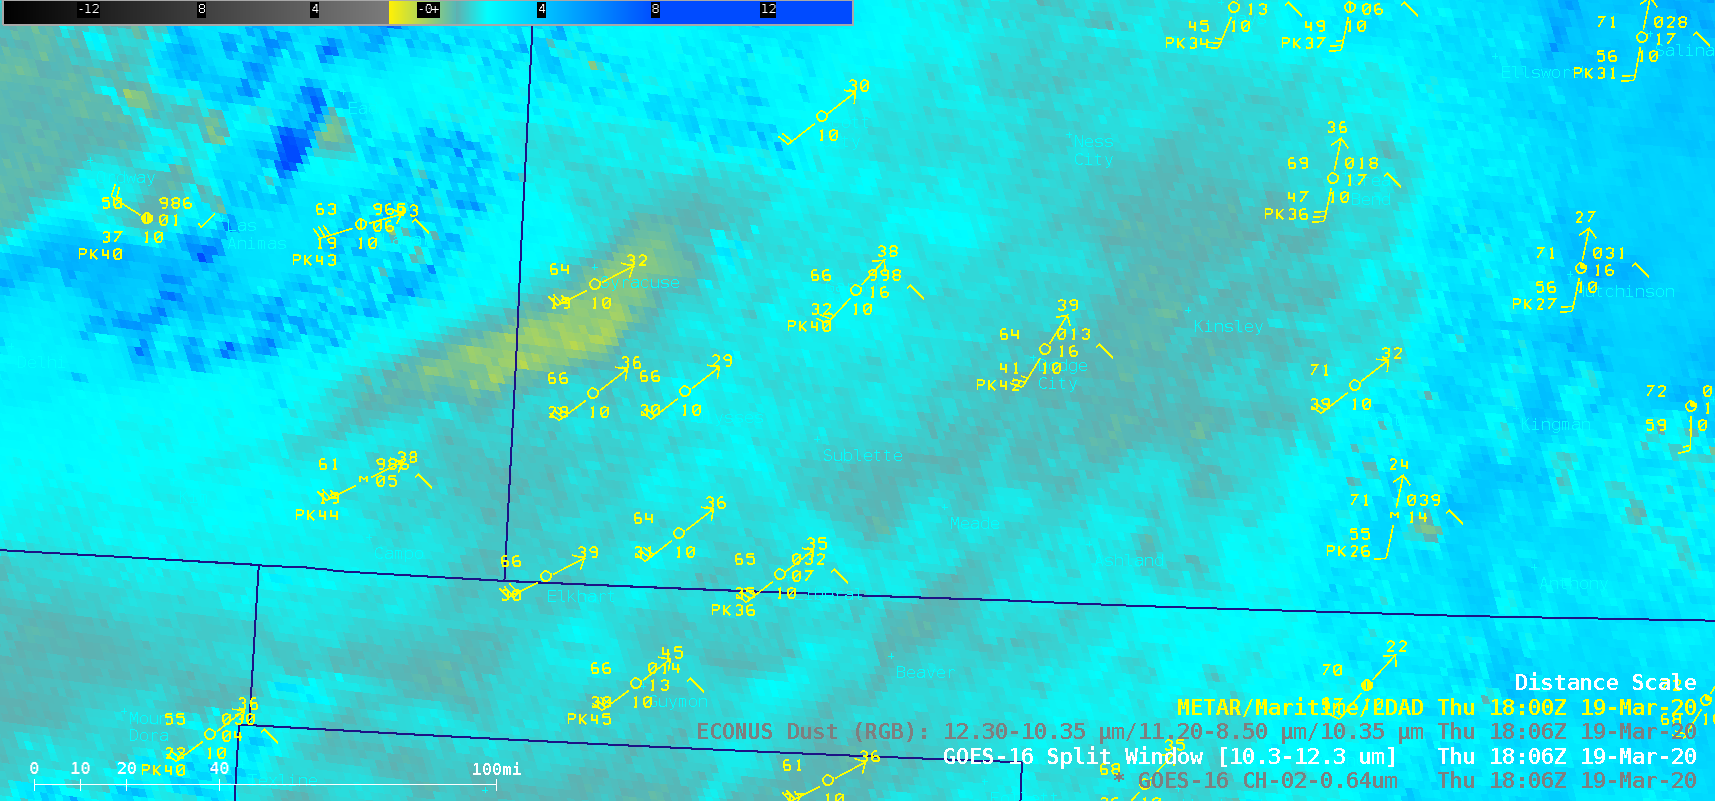
GOES-16 “Red” Visible (0.64 um), Split Window Difference (10.3-12.3 um) and Dust RGB images [click to play animation | MP4]
A NOAA-20 True Color RGB image as viewed using
RealEarth (below) provided a more detailed view of the dust plume north of Lamar, Colorado as well as the longer plume which stretched from southeastern Colorado into western Kansas.
![NOAA-20 True Color RGB image at 18:40 UTC [click to enlarge]](https://cimss.ssec.wisc.edu/satellite-blog/images/2020/03/200319_1840utc_noaa20_trueColorRGB_CO_KS_blowing_dust.png)
NOAA-20 True Color RGB image at 18:40 UTC [click to enlarge]
GOES-16 Visible images with plots of GLM Groups (below) revealed a few clusters of lightning associated with convective elements that were likely producing thundersnow across northeastern Colorado and near the Colorado/Nebraska border. Where warmer air was still present near the Colorado/Kansas border, a more longer-lived thunderstorm was producing rainfall at the surface.
GOES-16 “Red” Visible (0.64 um) images, with GLM Groups plotted in red and hourly surface weather type plotted in yellow [click to play animation | MP4]
===== 20 March Update =====
![GOES-16 Day Cloud Phase Distinction RGB images [click to play animation | MP4]](https://cimss.ssec.wisc.edu/satellite-blog/images/2020/03/dcpd-20200320_161114.png)
GOES-16 Day Cloud Phase Distinction RGB images [click to play animation | MP4]
On the following day, GOES-16 Day Cloud Phase Distinction RGB images
(above) showed the large swath of fresh snow cover
(shades of green) produced by this storm as it moved northeastward across the Upper Midwest. Clouds persisted over much of eastern Colorado, masking the extent of the snow cover there.
===== 21 March Update =====
![Landsat-8 False Color RGB image, with and without labels [click to enlarge]](https://cimss.ssec.wisc.edu/satellite-blog/images/2020/03/200321_1724utc_landsat8_falseColorRGB_CO_snow_cover_anim.gif)
Landsat-8 False Color RGB image at 1724 UTC, with and without labels [click to enlarge]
On 21 March, a decrease in cloudiness over eastern Colorado allowed much of the snow cover
(shades of cyan) to be seen in a swath of 30-meter resolution Landsat-8 False Color imagery as viewed using
RealEarth (above). The effects of terrain were evident, with a lack of snow cover seen in areas where downslope flow was prevalent during the winter storm.
View only this post
Read Less
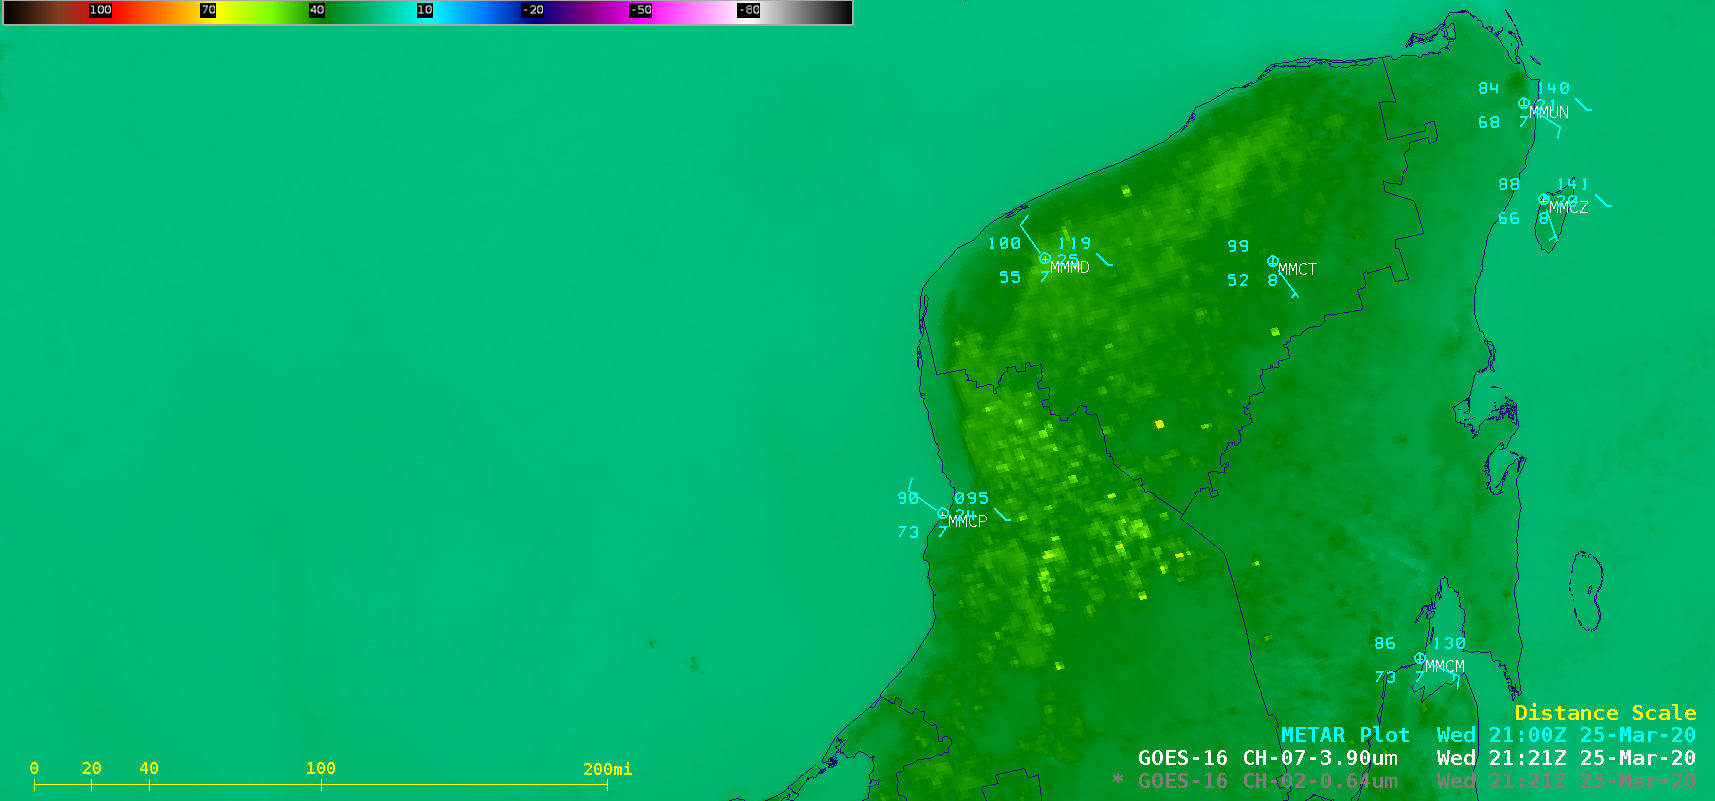
![GOES-16 Shortwave Infrared (3.9 um) images [click to play animation | MP4]](https://cimss.ssec.wisc.edu/satellite-blog/images/2020/03/200325_goes16_shortwaveInfrared_Yucatan_fires_anim.gif)
![GOES-16 True Color RGB images [click to play animation | MP4]](https://cimss.ssec.wisc.edu/satellite-blog/images/2020/03/200325_goes16_trueColorRGB_Gulf_of_Mexico_smoke_anim.gif)
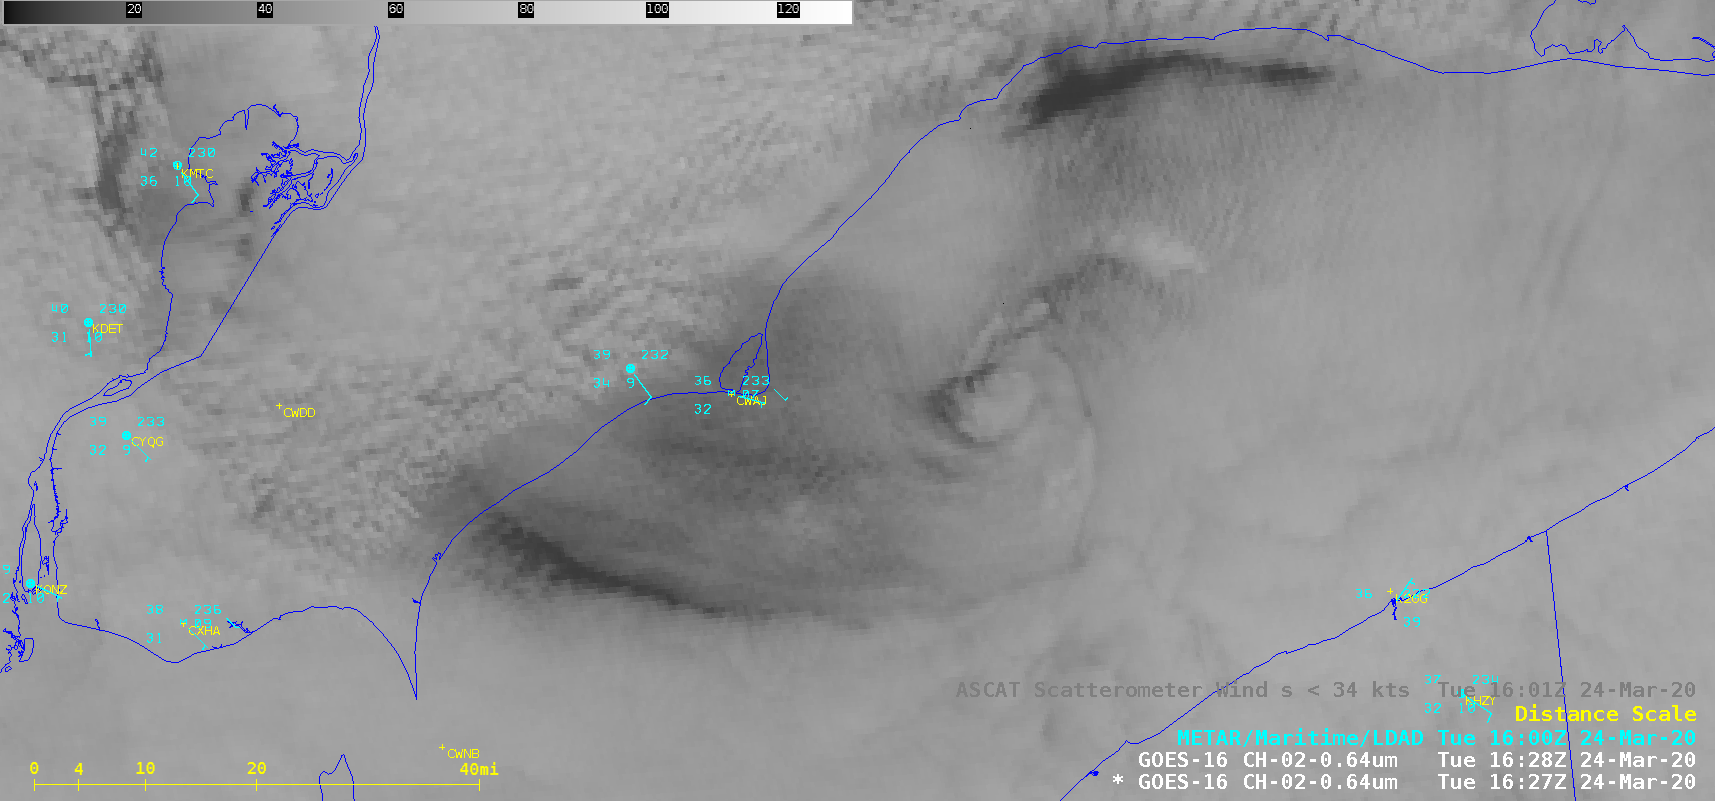

![Suomi NPP VIIRS Shortwave Infrared (3.74 µm) and "Fog product" Brightness Temperature Difference (BTD) images [click to enlarge]](https://cimss.ssec.wisc.edu/satellite-blog/images/2020/03/200324_viirs_shortwaveInfrared_fogBTD_Lake_Erie_mesovortex_anim.gif)
![GOES-16 Day Cloud Phase Distinction RGB images [click to play animation | MP4]](https://cimss.ssec.wisc.edu/satellite-blog/images/2020/03/200324_goes16_dayCloudPhaseDistinction_Dakotas_undular_bore_anim.gif)
![GOES-16 Mid-level Water Vapor (6.9 um) images, with hourly plots of surface wind barbs and gusts (knots) [click to play animation | MP4]](https://cimss.ssec.wisc.edu/satellite-blog/images/2020/03/200319_goes16_waterVapor_surfaceWindGusts_Plains_anim.gif)


![GOES-16 Day Cloud Phase Distinction RGB images [click to play animation | MP4]](https://cimss.ssec.wisc.edu/satellite-blog/images/2020/03/200320_goes16_dayCloudPhaseDistinction_snow_cover_anim.gif)
