A long-track tornado moved through Nashville (north Nashville to Lockeland Springs then towards Lebanon) early in the morning on 3 March 2020. (ProbSevere for this event is also discussed in this blog post; A GLM View of the storm is here) The Band13 mp4 animation, above (Click here for an animated gif), from... Read More
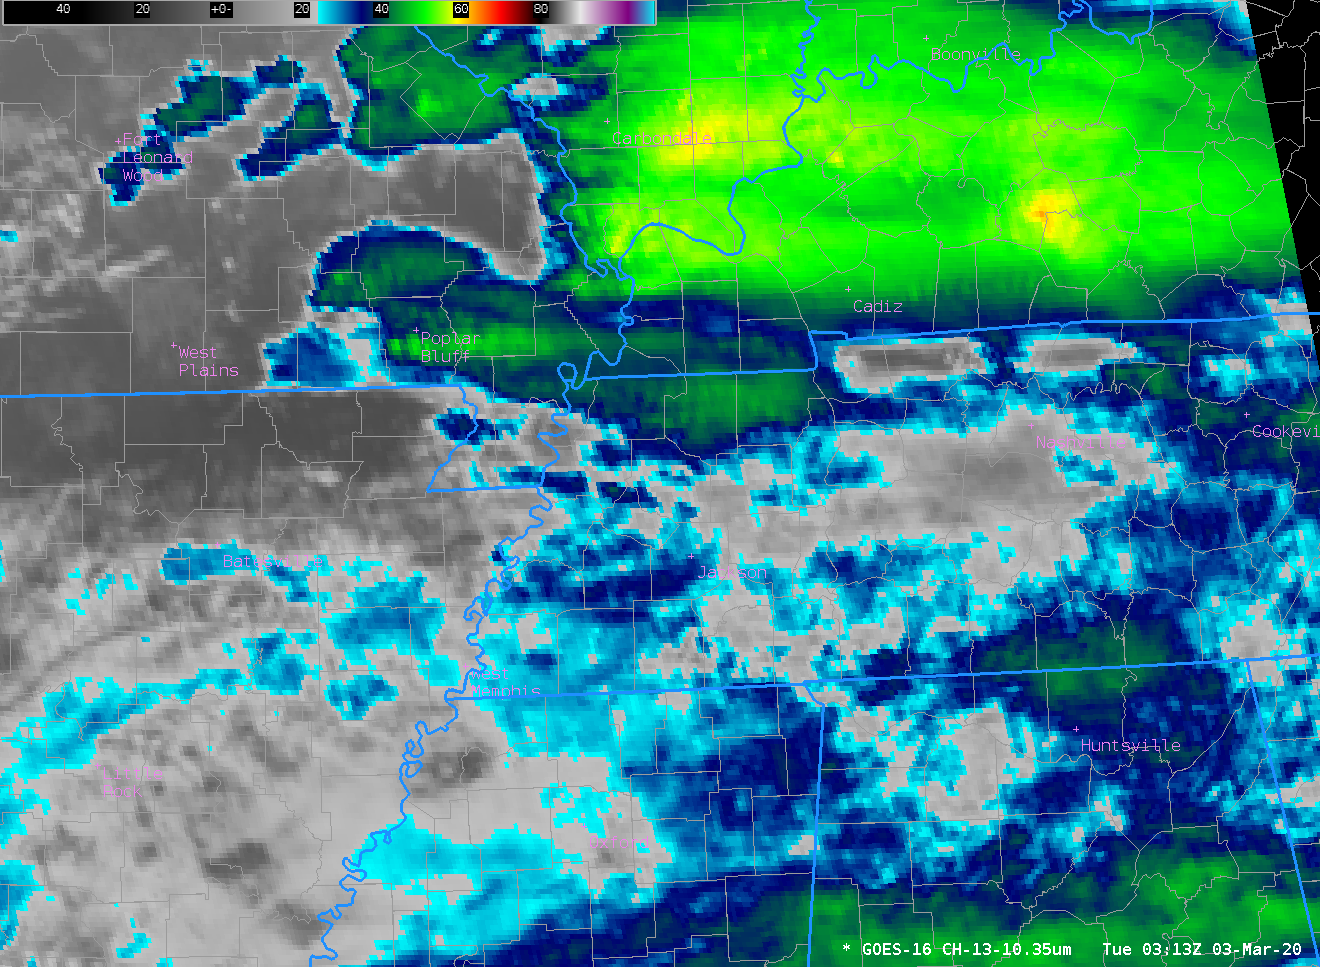
GOES-16 Clean Window (10.3 µm) Infrared Imagery at 1-minute intervals, 0313 – 0722 UTC on 3 March 2020 (Click to play mp4 animation)
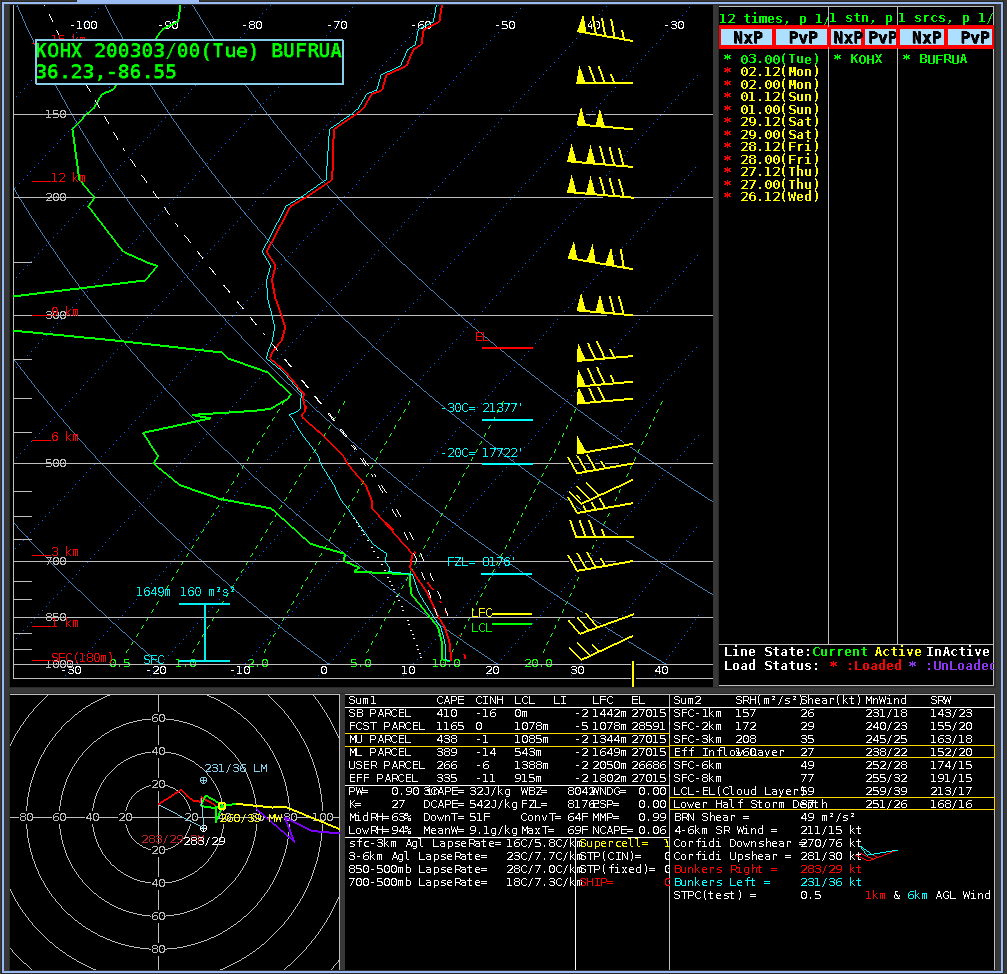
A long-track tornado moved through Nashville (north Nashville to Lockeland Springs then towards Lebanon) early in the morning on 3 March 2020. (ProbSevere for this event is also discussed in this blog post; A GLM View of the storm is here) The Band13 mp4 animation, above (Click here for an animated gif), from 0313 through 0722 UTC shows the long-lived storm forming over western Tennessee and rolling eastward into Nashville after midnight. As the storm approached Nashville, the storm top frequently showed isolated cold pixels (yellow in the enhancement) that are testament to the strong convection, and an above-anvil cirrus plume (AACP) might be there too. All of these structures are consistent with a tornadic storm. The 00 UTC Nashville Sounding shows a favorable environment as well.
1-minute GOES-16 Infrared images with plots of time-matched SPC Storm reports is shown below, covering the period 0300-0802 UTC. The color enhancement applied to those images is slightly different — and the pulsing overshooting tops are easier to see as highlighted with darker shades of orange.
GOES-16 “Clean” Infrared Window (10.35 µm) images, with SPC Storm reports plotted in red [click to play animation | MP4]
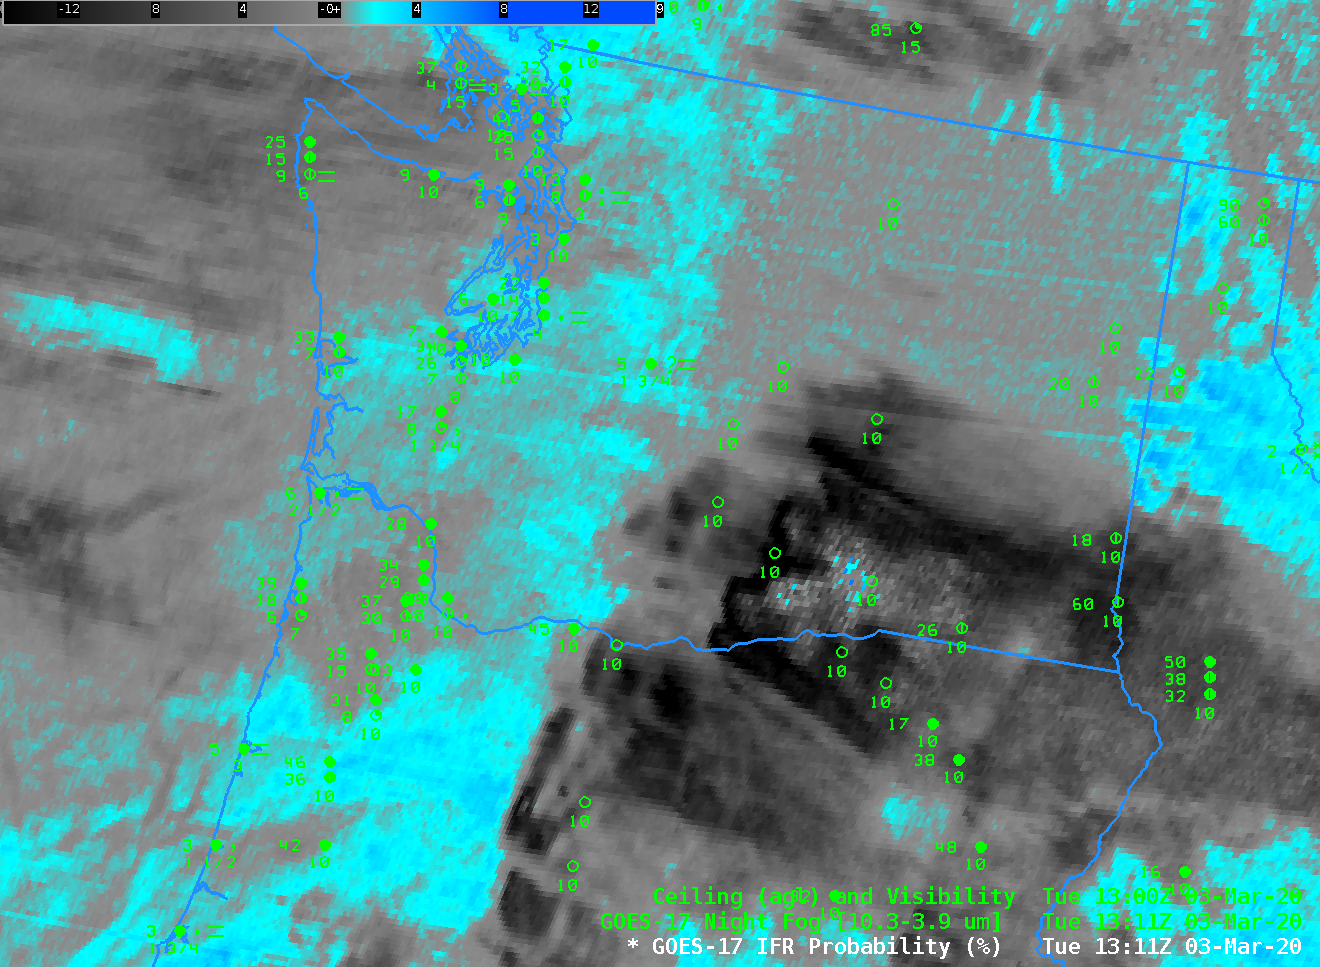
Shortly after the tornado passed through Nashville, NOAA-20 overflew Tennessee. The toggle below shows the GOES-16 ABI Band 13 (10.3 µm) infrared imagery, the
NUCAPS Sounding Location, and the
computed Total Totals Index from the NUCAPS thermodynamic information. Values exceeding 50 are south and west of the thunderstorm complex. NUCAPS soundings are showing a thermodynamically unstable environment.
GOES-16 ABI Band 13 (10.3 µm) Infrared Imagery along with NUCAPS Sounding Points and Gridded Values of Total Totals Index computed from NUCAPS Soundings (Click to enlarge)
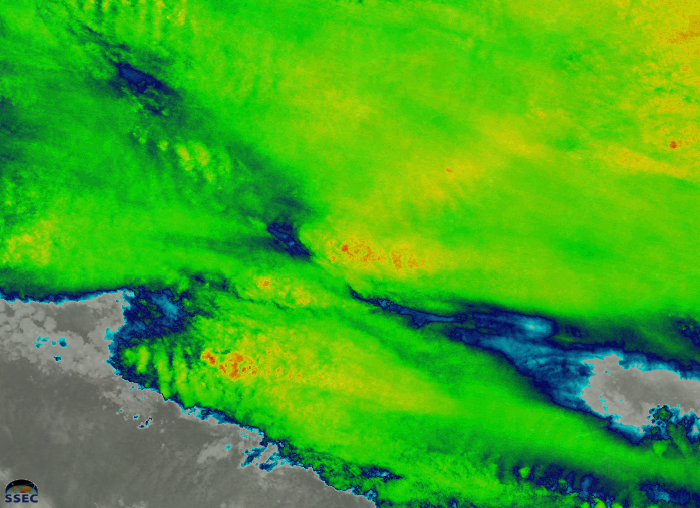
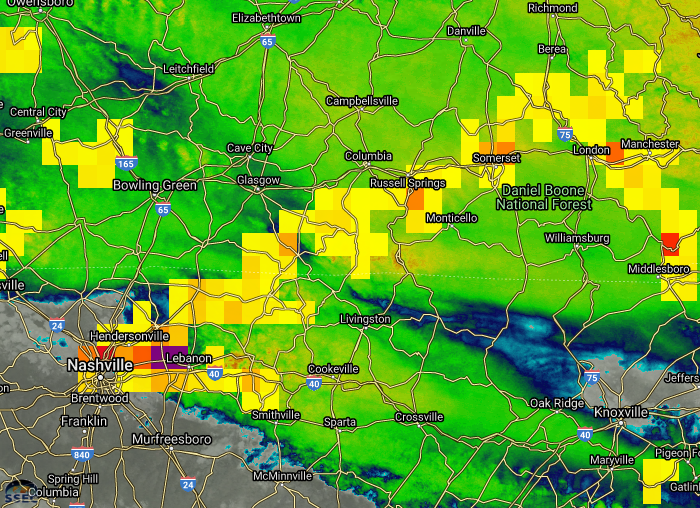
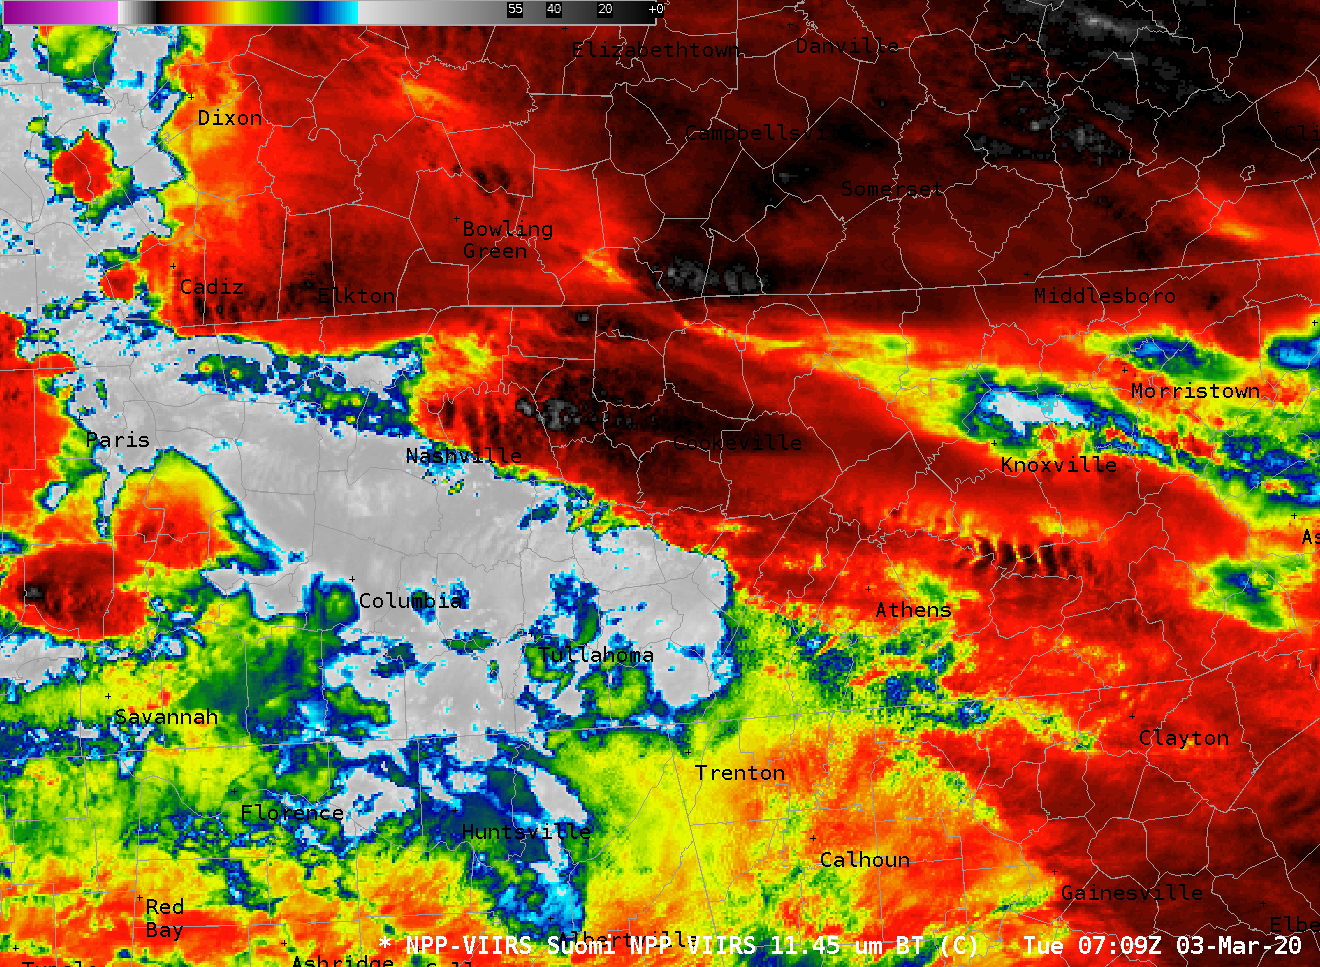
The high-resolution VIIRS instruments on NOAA-20 gives a high-resolution view of the storm, as shown below. The figure includes the 11.45 µm VIIRS I05 infrared imagery (from Real Earth) and also shows a 5-minute GLM Group Density accumulation with a profound maximum (values exceeding 250!) over Lebanon TN. The morning NOAA-20 orbit on 3 March was to the east of Tennessee (source), so a parallax shift between the GLM data from GOES-16 and the VIIRS I05 data will occur.

Real Earth captures of 11.45 µm VIIRS I05 infrared imagery and GOES-16 GLM 5-minute Group Density, 0700-0705 UTC
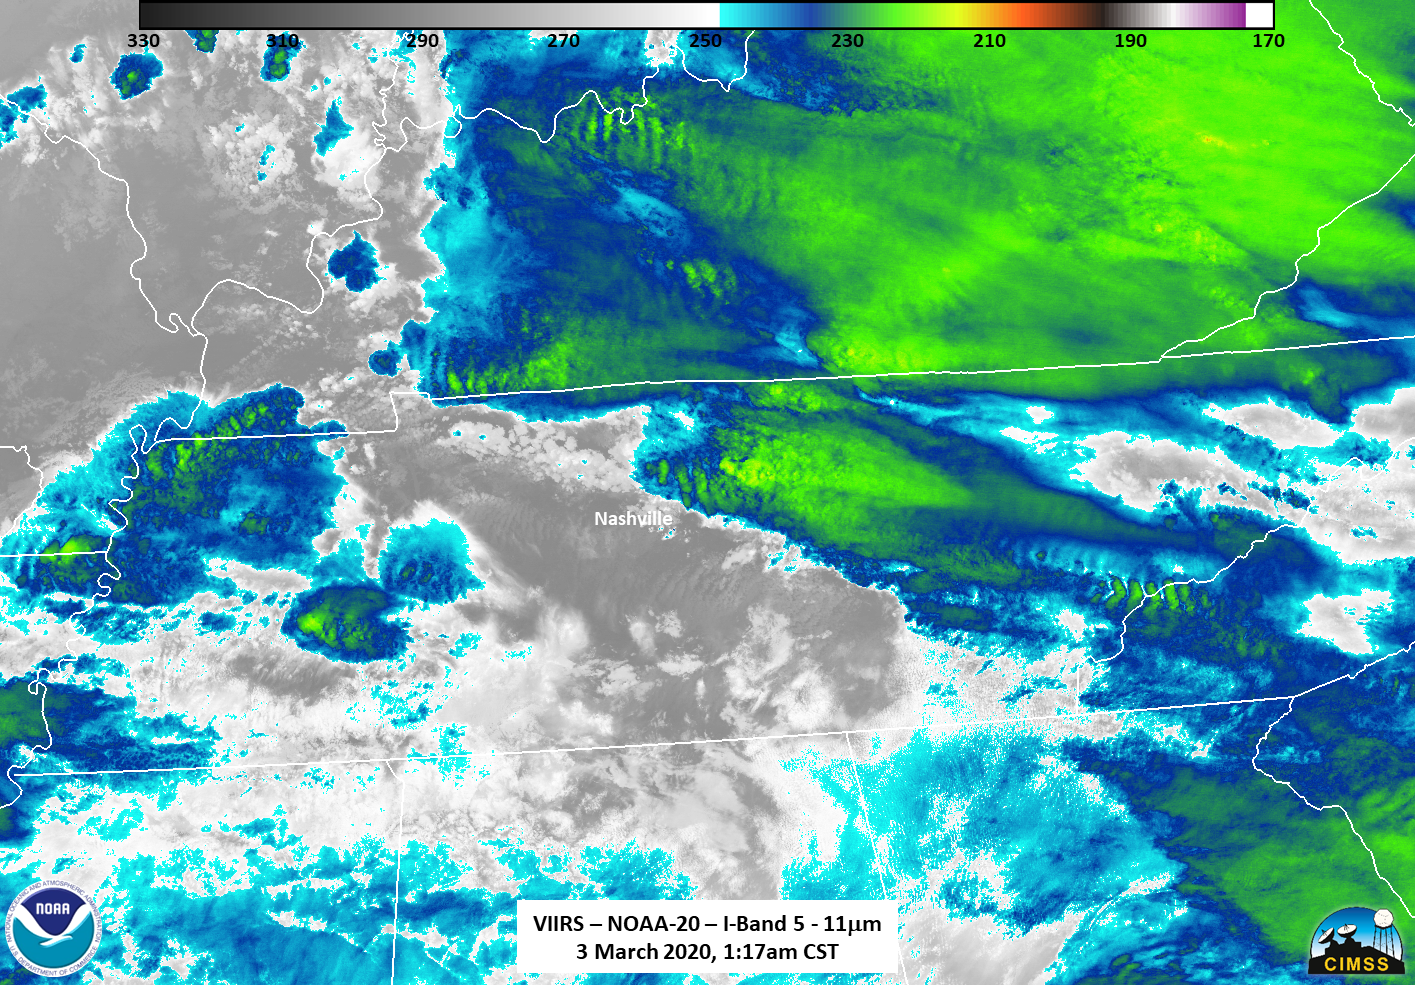
A zoomed-out toggle between VIIRS I05 and the Day Night Band (below, courtesy William Straka, CIMSS), (Click here to view the I05 with a different enhancement) shows the storm to the east of Nashville. The quarter New Moon (that was below the horizon) offered no clear view of the cloud tops, but lightning illumination is apparent.

NOAA-20 11.45 µm VIIRS I05 infrared imagery and Day Night Band 0.70 µm visible imagery at 0717 UTC on 3 March 2020 (Click to enlarge)
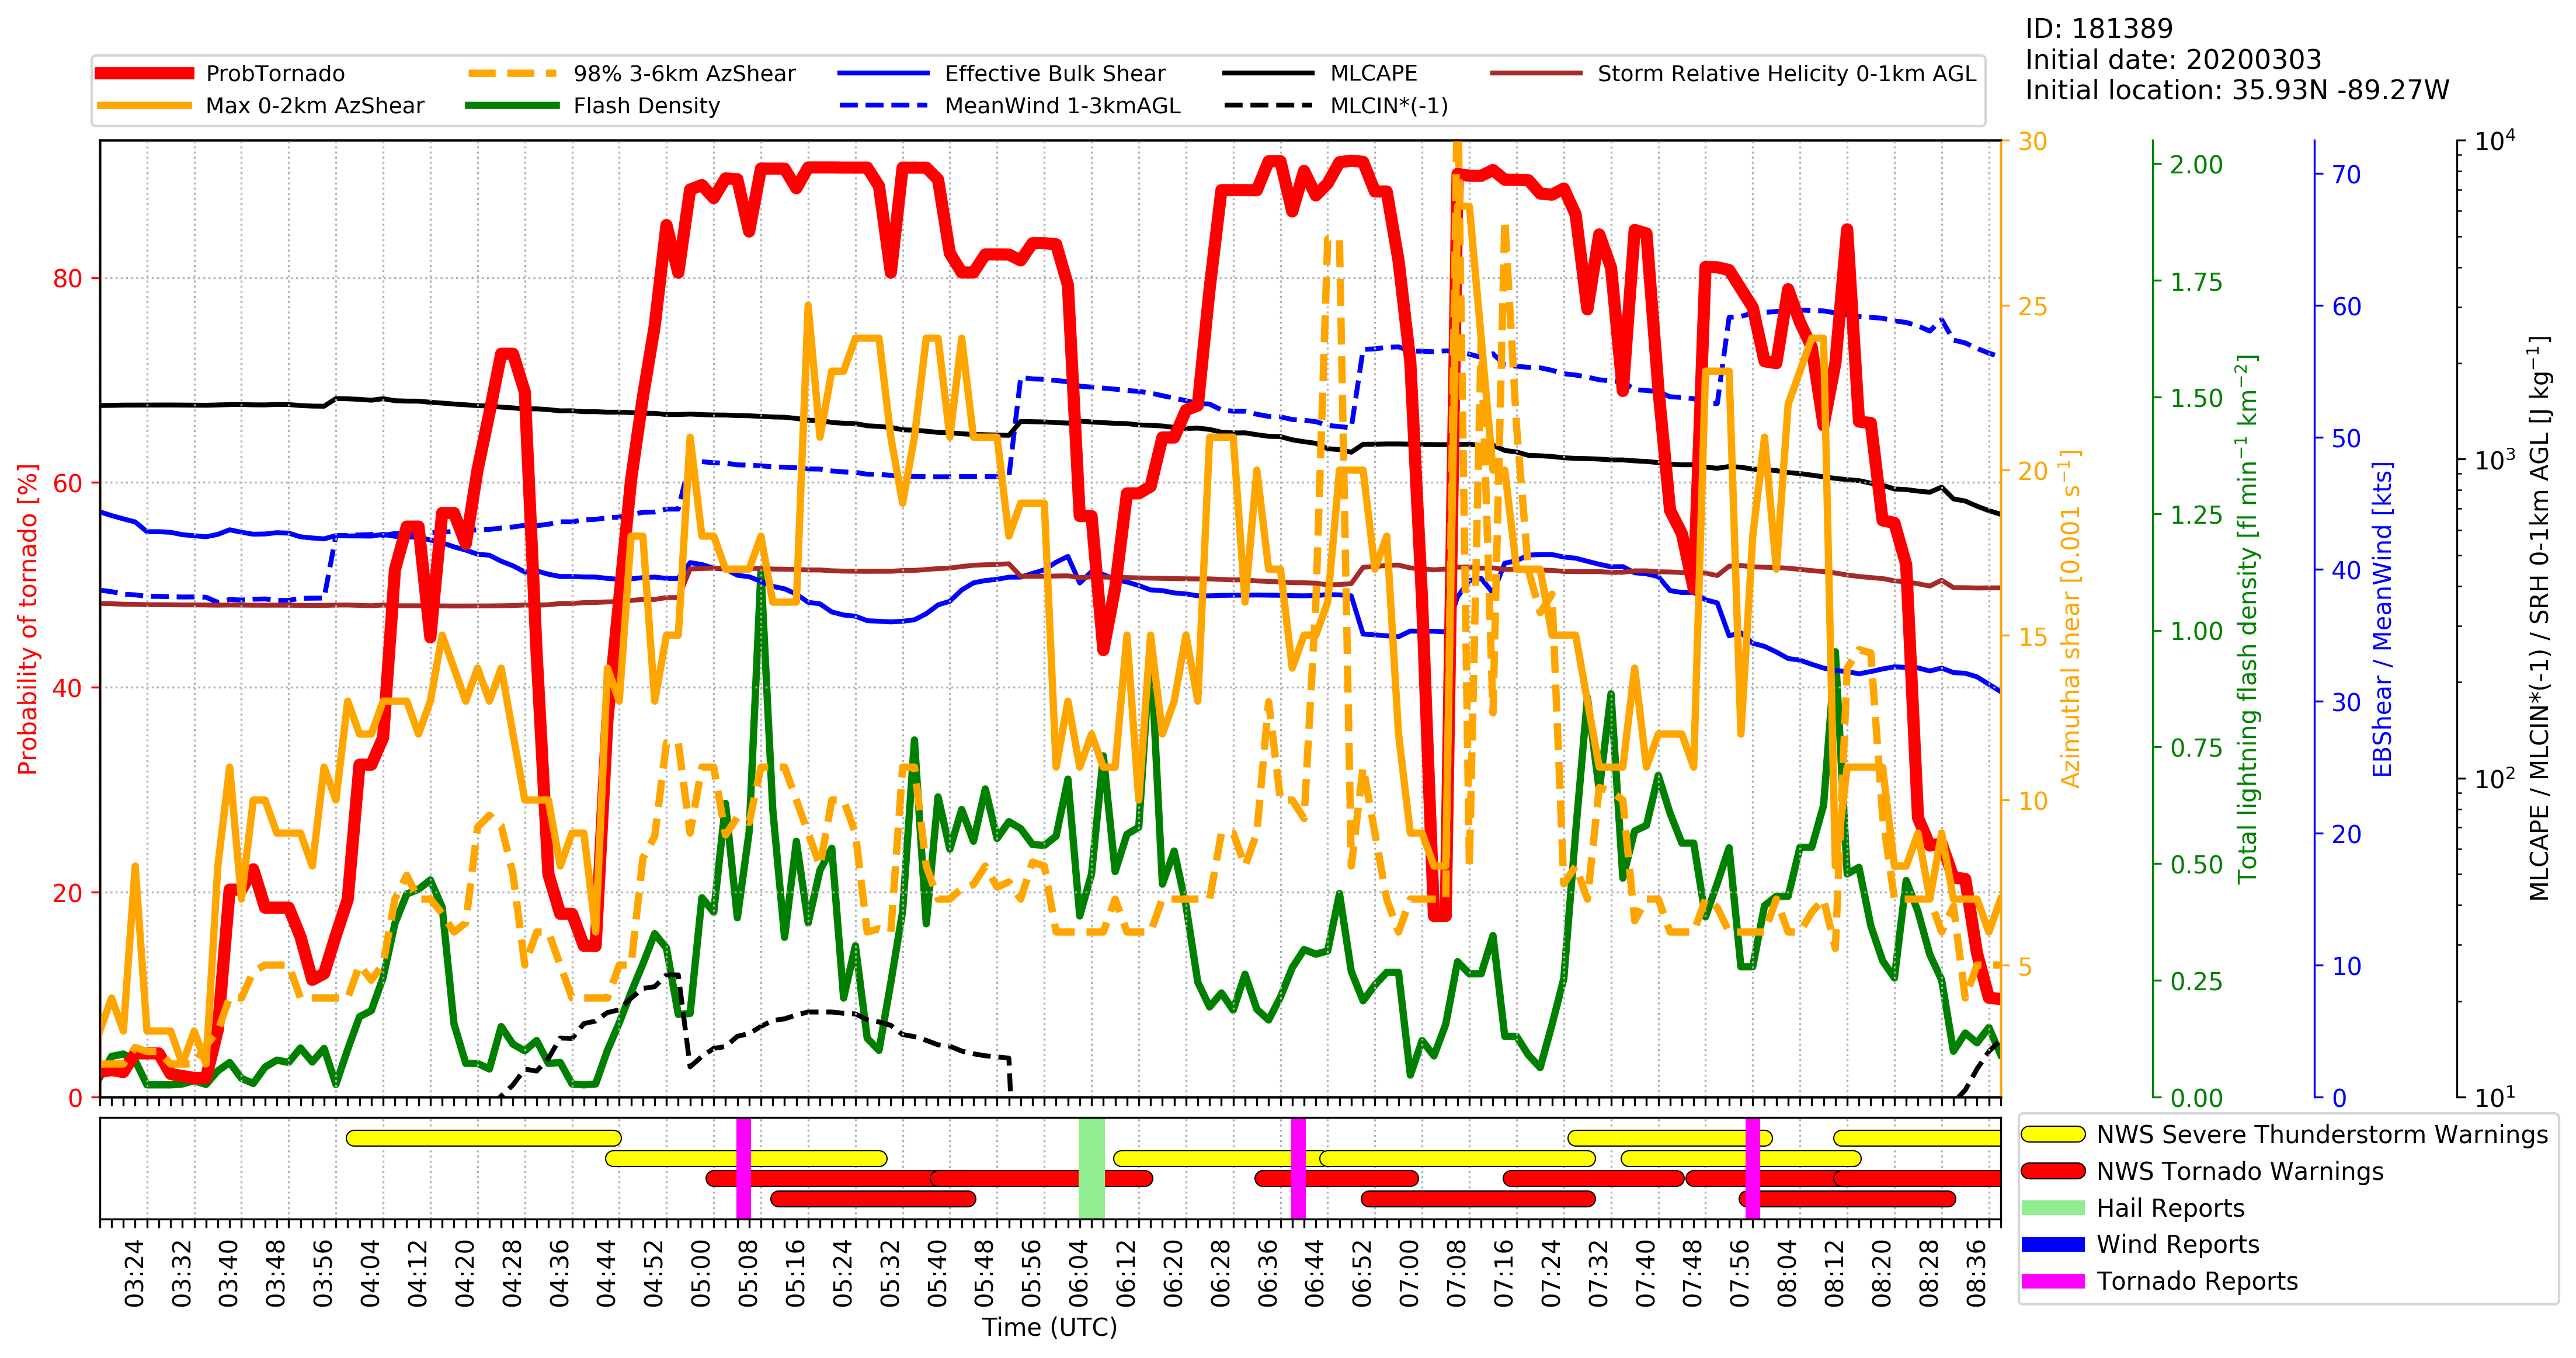
This long storm in a favorable environment was captured well by the NOAA/CIMSS ProbSevere product. The animation below tracks the storm across much of northwest and north-central Tennessee. Time-series plots of the radar object (#181389) associated with the Nashville tornado are here: ProbTor (including components), ProbSevere (including components), and ProbSevere, ProbHail and ProbTor values. The cyclic nature of the storm is apparent. ProbSevere/ProbTor/ProbHail values were very high when the Nashville tornado was on the ground (around 0640 UTC).
NOAA/CIMSS ProbSevere display over northwest to north-central Tennessee, 0330 to 0730 UTC. (Click to enlarge)
A project spearheaded by Bill Smith Sr and Qi Zhang at Hampton University (they are also affiliated with CIMSS) takes Polar Hyperspectral (PHS) data and blends it with GOES-16 ABI data. Those fields that exploit the high spectral resolution from sounders in polar orbit (such as IASI or CrIS) and the high spatial and temporal resolution from GOES are then input into numerical models. Output is here. The better representation of moisture fields in these fields can help a model better define where strong convection will or will not occur. The animation below shows initial fields of the Significant Tornado Parameter from 0300 – 0800 UTC on 3 March 2020. Compare the animation to initial fields of STP in a model that does not include the assimilated hyperspectral data here.
Significant Tornado Parameter at initial model run times from 0300 through 0800 UTC on 3 March 2020 (Click to enlarge). The number of assimilated retrievals is indicated in red; no retrievals were assimilated at 0700 UTC, and the STP field was affected!
What did the forecast for 0600 UTC look like from this model that includes polar hyperspectral data? That is shown below, with a series of model runs. There is run-to-run variability, but overall the forecast simulations show a peak in the STP parameter near Nashville. (This PDF compares model runs with and without Polar Hyperspectral Data; adding the satellite data helps the model focus convection where it occurs, mostly because the moisture fields are more accurately defined).
Forecasts valid at 0600 UTC on 3 March 2020, initialized at 0000, 0100, 0200, 0300, 0400 and 0500 UTC (Click to enlarge)
View only this post
Read Less


![Meteosat-11 Water Vapor (6.25 µm) images, with hourly plots of surface wind barbs and gusts (in knots) [click to play animation | MP4]](https://cimss.ssec.wisc.edu/satellite-blog/images/2020/02/200229_meteosat11_waterVapor_surfaceWindGusts_Storm_Jorge_anim.gif)
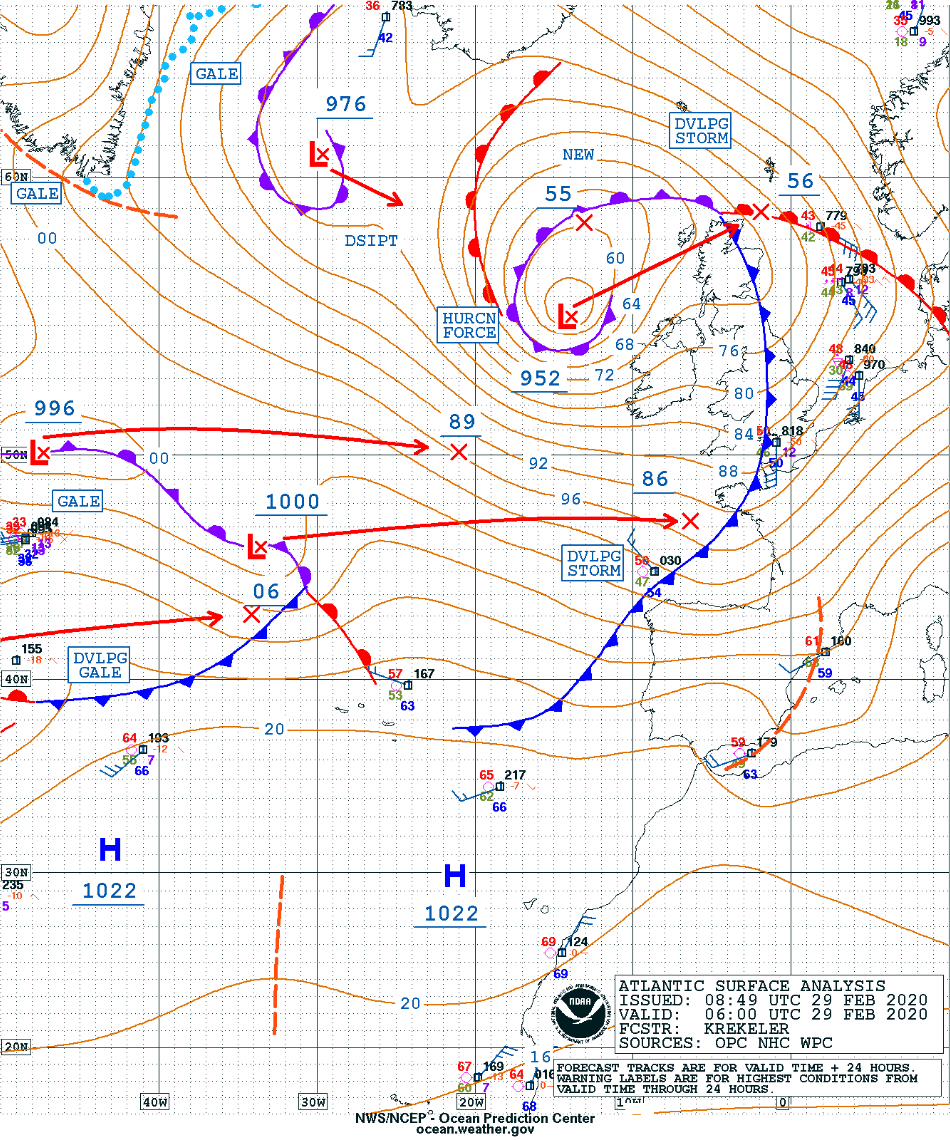
![Surface analyses, from 00 UTC on 29 February to 06 UTC on 01 March [click to enlarge]](https://cimss.ssec.wisc.edu/satellite-blog/images/2020/03/200229_200301_surface_analyses_Jorge_anim.gif)
