NOAA and CIMSS are developing a product that uses a deep-learning model to recognize complex patterns in weather satellite imagery to predict the probability of lightning in the short term. Deep learning is a branch of machine learning based on artificial neural networks, which have the ability to automatically learn targeted features in the data by approximating how humans learn.
A convolutional neural network (CNN) was trained on over 23,000 images of GOES-16 Advanced Baseline Imager (ABI) data to predict the probability of lightning, within any given ABI pixel, in the next 60 minutes. The CNN was trained using 118 days of data collected between May and August of 2018. Images of GOES Geostationary Lightning Mapper (GLM) flash-extent density (created with glmtools) were used as the source of lightning observations. Note that GLM is an optical sensor that observes both in-cloud and cloud-to-ground lightning.
The CNN currently uses four ABI channels: band 2 (0.64-µm), band 5 (1.6-µm), band 13 (10.3-µm), and band 15 (12.3-µm). Bands 2 and 5 are only utilized under sunlit conditions. Utilization of additional channels and time sequences of images is under investigation. The model uses a semantic image segmentation architecture to assign the probability of lighting in the next 60 minutes to each pixel in the image. The model is very computationally efficient, only needing 30 seconds to process the ABI CONUS domain and 3 seconds to process an ABI mesoscale domain using multithreading on a 40-CPU linux server.
Currently, the model only utilizes satellite radiances. Thus, it can be applied to nearly any spatial domain covered by the ABI or an ABI-like sensor (e.g. AHI). Based on near-real-time testing, the model routinely nowcasts lightning initiation with 10-30 minutes of lead-time. We expect the skill and lead-time will increase as new predictors (e.g. more ABI fields, NWP, radar where available) are added to the model.
Below are a sampling of recent examples. The base images are 0.64-µm reflectance, with GLM-derived flash-extent density overlaid as filled semi-transparent polygons. The flash-extent density is the accumulated number of flashes within the previous 5 minutes. The CNN-derived probabilities are displayed as contours at select levels (near-real-time output is available through RealEarth).
The overall objective is to improve lightning nowcasts in support of aviation, mariners, and outdoor events/activities. Beyond improving the CNN, our work will focus on packaging the output into actionable information for forecasters and other decision makers.
A cold front in Iowa
Thunderstorm development on sea-breeze boundaries in Florida and the Bahamas
Diurnally and orographically forced storms in the Southwest U.S. and Rocky Mountains
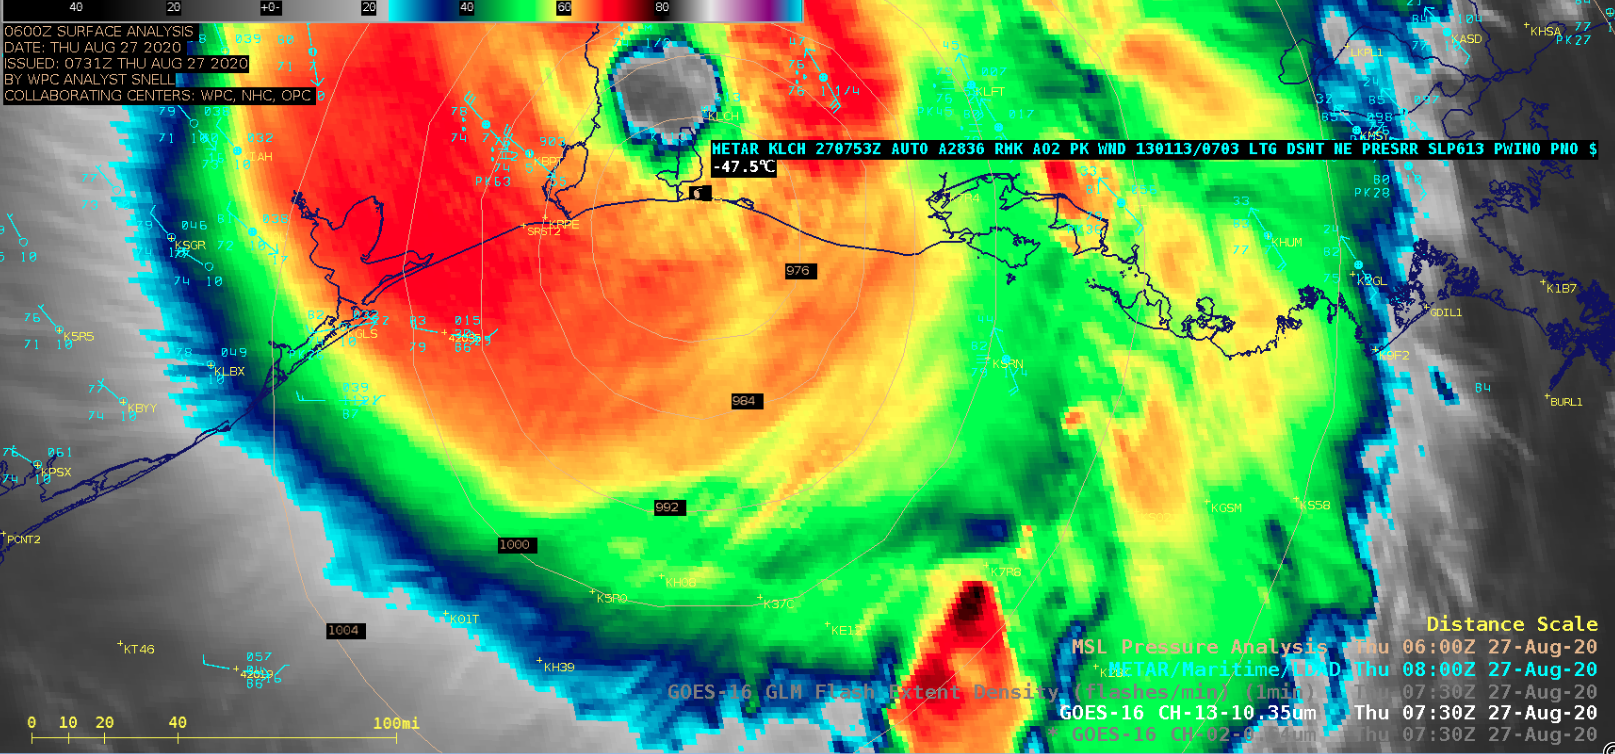
Storms in central Oklahoma, on the edge of Hurricane Laura’s cloud shield
A couple of examples over the Northeast U.S.
A boundary of convection on the southern bank of Lake Ontario
Storms in a warm sector in IL/IN/OH, perhaps along an outflow boundary
Southeast U.S. offshore region
The background image in this example transitions from 10.3-µm brightness temperature to 0.64-µm reflectance, while the flash-extent density enhancement also changes, in an attempt to enhance contrast.
View only this post Read Less
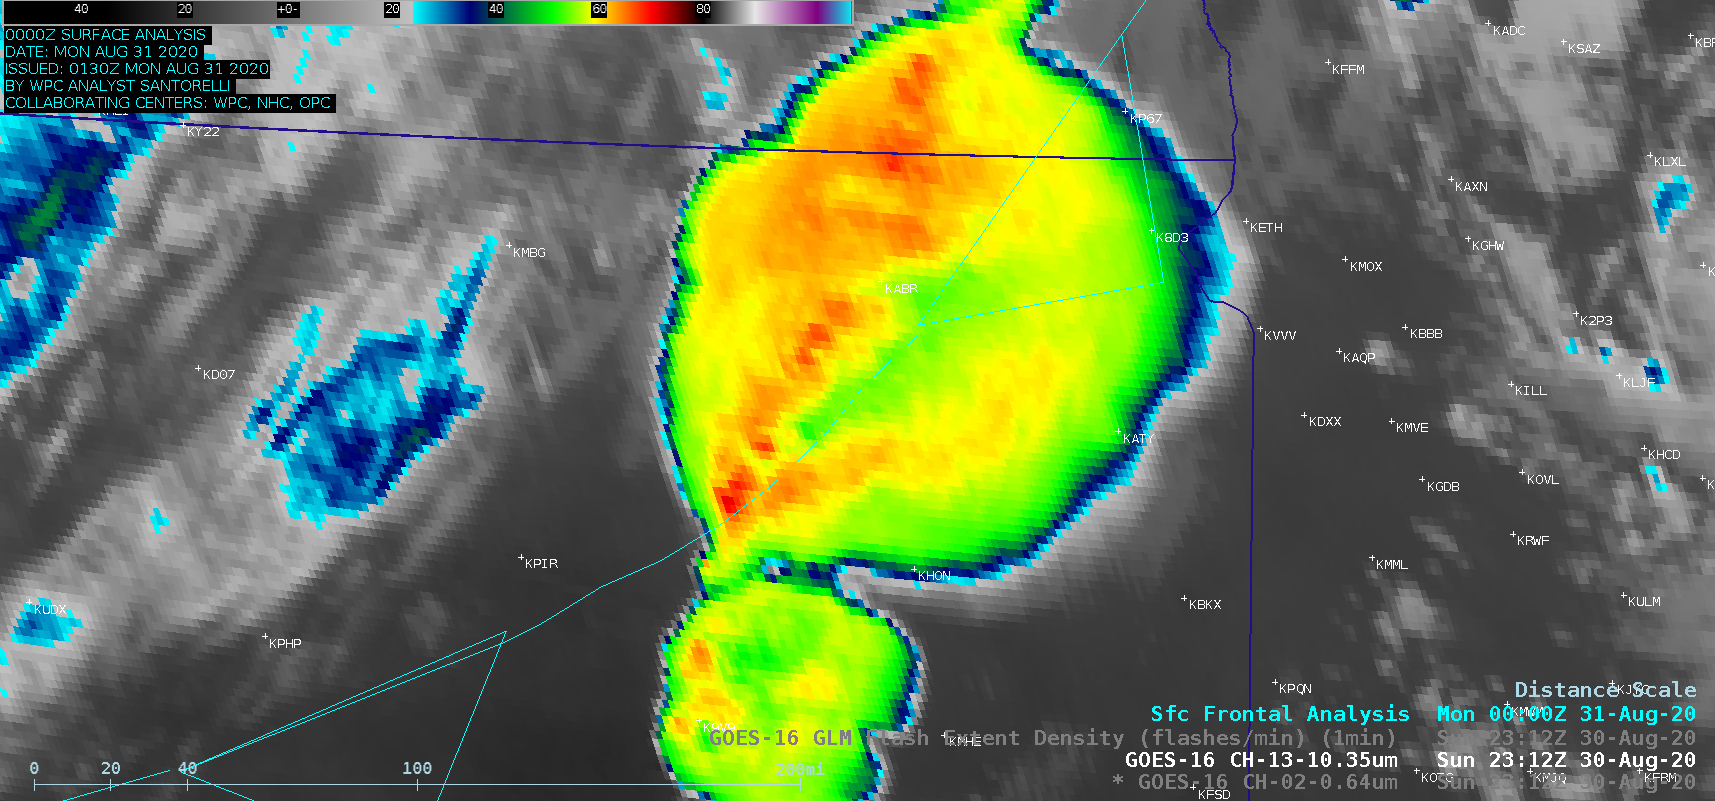
![GOES-16 “Red” Visible (0.64 µm) and “Clean” Infrared Window (10.35 µm) images (with and without an overlay of GLM Flash Extent Density) [click to play animation | MP4]](https://cimss.ssec.wisc.edu/satellite-blog/images/2020/08/200830_goes16_visible_infrared_glmFlashExtentDensity_SD_anim.gif)
![GOES-16 “Red” Visible (0.64 µm) images, with time-matched SPC Storm Reports plotted in red [click to play animation | MP4]](https://cimss.ssec.wisc.edu/satellite-blog/images/2020/08/200830_goes16_visible_spcStormReports_anim.gif)
![GOES-16 “Clean” Infrared Window (10.35 µm) images, with time-matched SPC Storm Reports plotted in cyan [click to play animation | MP4]](https://cimss.ssec.wisc.edu/satellite-blog/images/2020/08/200830_goes16_infrared_spcStormReports_SD_anim.gif)
![Plot of 00 UTC rawinsonde data from Aberdeen, South Dakota [click to enlarge]](https://cimss.ssec.wisc.edu/satellite-blog/images/2020/08/200831_00utc_kabr_raob.png)
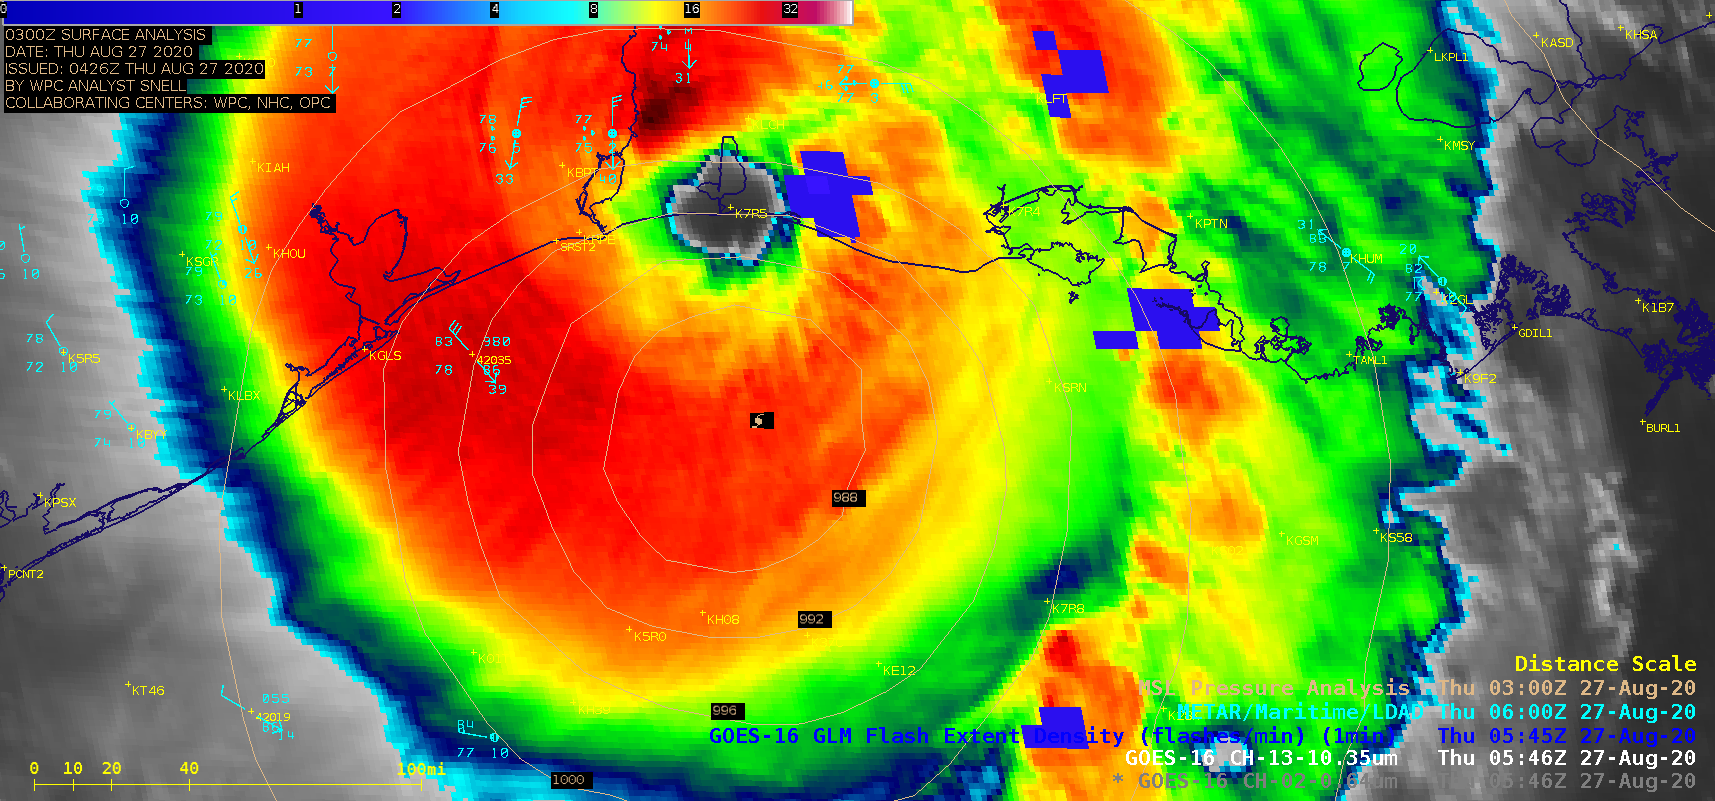
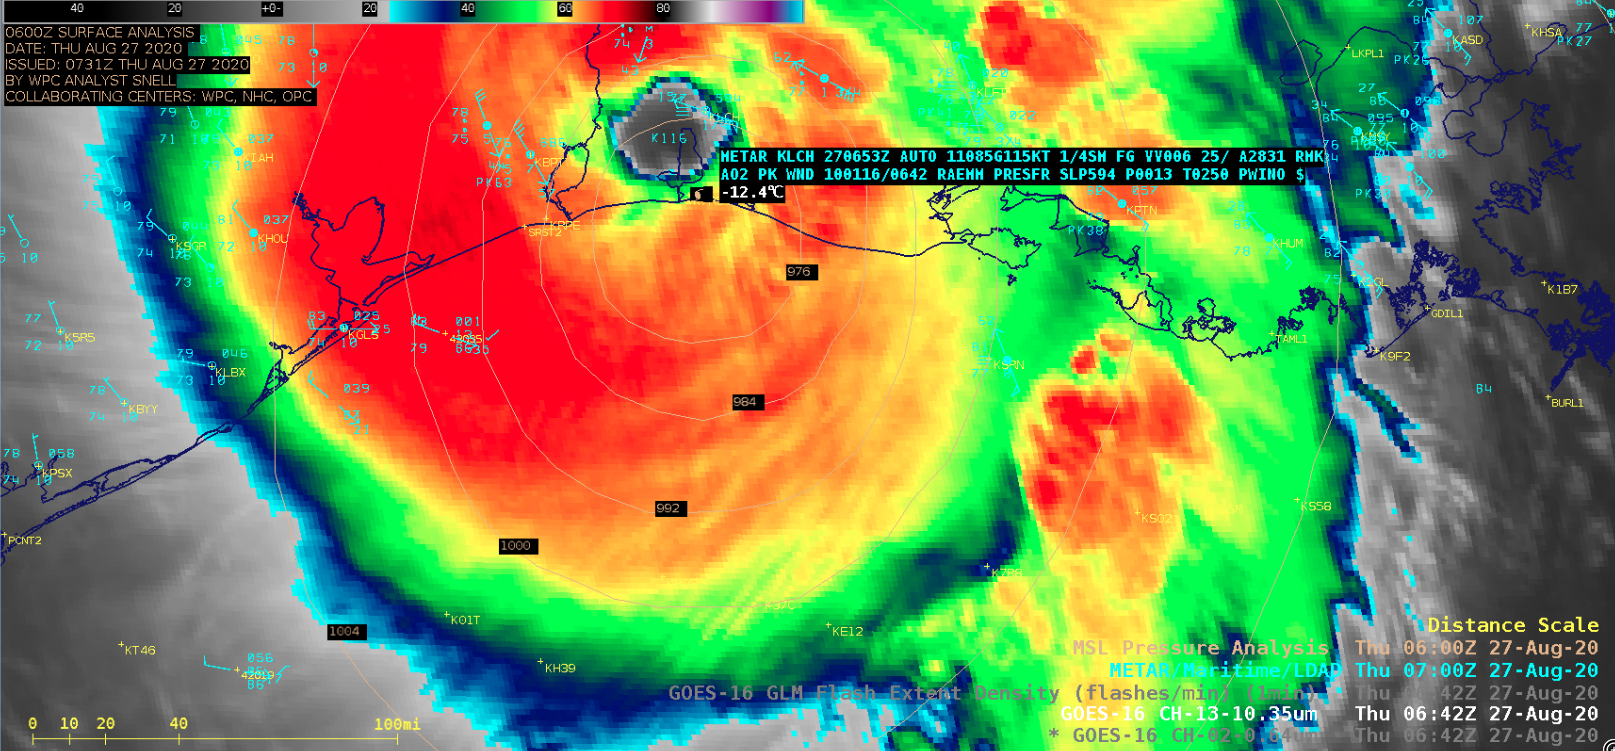
![GOES-16 “Red” Visible (0.64 µm) and “Clean” Infrared Window (10.35 µm) images (with and without an overlay of GLM Flash Extent Density) [click to play animation | MP4]](https://cimss.ssec.wisc.edu/satellite-blog/images/2020/08/200826_goes16_visible_infrared_glmFlashExtentDensity_Hurricane_Laura_anim.gif)
![Suomi NPP VIIRS Day/Night Band (0.7 µm) and Infrared Window (11.45 µm) images at 0751 UTC (credit William Straka, CIMSS) [click to enlarge]](https://cimss.ssec.wisc.edu/satellite-blog/images/2020/08/200827_0751utc_suomiNPP_infrared_dayNightBand_Hurricane_Laura_anim.gif)
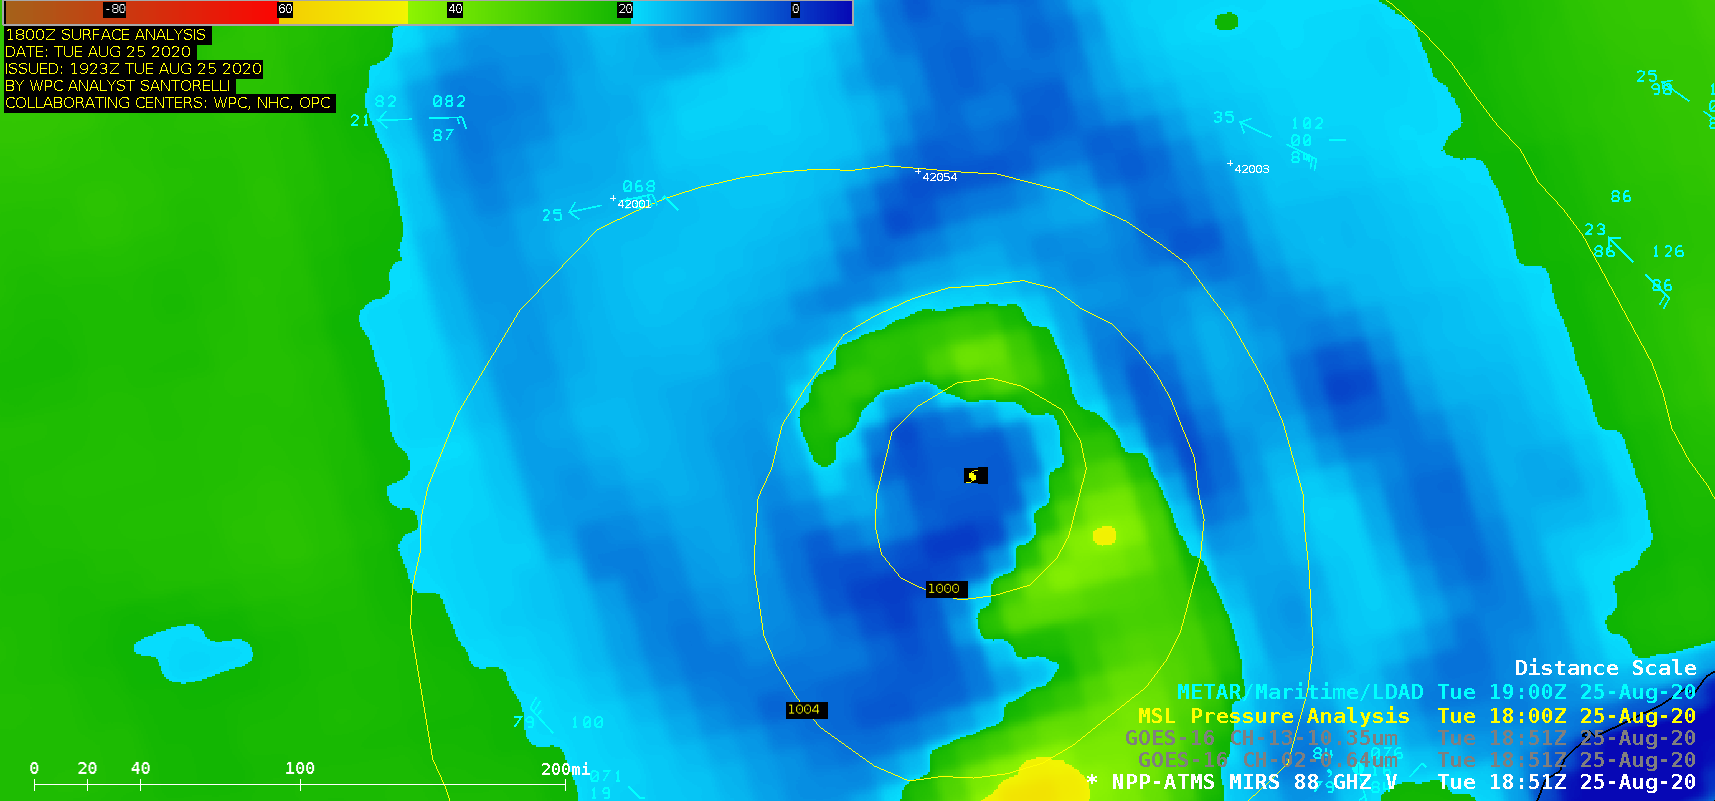
![Suomi NPP ATMS Microwave (88.2 GHz) and MiRS Rainfall Rate images at 0751 UTC (credit William Straka, CIMSS) [click to enlarge]](https://cimss.ssec.wisc.edu/satellite-blog/images/2020/08/200827_0751utc_suomiNPP_microwave_rainfallRate_Hurricane_Laura_anim.gif)
![DMSP-17 SSMI Microwave (85 GHz) image at 0054 UTC [click to enlarge]](https://cimss.ssec.wisc.edu/satellite-blog/images/2020/08/200827_0054utc_dmsp17_ssmis_microwave_Hurricane_Laura.png)
![GMI Microwave (85 GHz) image at 0255 UTC [click to enlarge]](https://cimss.ssec.wisc.edu/satellite-blog/images/2020/08/200827_0255utc_gmi_microwave_Hurricane_Laura.png)
![MIMIC-TC product during the 26-27 August period [click to enlarge]](https://cimss.ssec.wisc.edu/satellite-blog/images/2020/08/200826_200827_mimicTC_Laura_anim.gif)
![GOES-16 Infrared Window (11.2 µm) images, with an overlay of deep-layer wind shear [click to enlarge]](https://cimss.ssec.wisc.edu/satellite-blog/images/2020/08/200826_goes16_infrared_deepLayerWindShear_Laura_anim.gif.gif)
![GOES-16 “Red” Visible (0.64 µm) and “Clean” Infrared Window (10.35 µm) images [click to play animation | MP4]](https://cimss.ssec.wisc.edu/satellite-blog/images/2020/08/200825_goes16_visible_infrared_Hurricane_Laura_anim.gif)

![Infrared Window images from Suomi NPP (11.45 µm) and GOES-16 (10.35 µm) images at 1943 UTC [click to enlarge]](https://cimss.ssec.wisc.edu/satellite-blog/images/2020/08/200825_1943utc_suomiNPP_goes16_infrared_Hurricane_Laura_anim.gif)
