The Cooperative Institute for Meteorological Satellite Studies (CIMSS) acquires data directly from polar-orbiting satellites such as Suomi-NPP and NOAA-20 through Direct Broadcast antennae that are on the UW-Madison Campus. Community Satellite Processing Package (CSPP) software takes the Direct Broadcast signal and creates data files and, with Polar2Grid, imagery that are easily accessible at this ftp site where users can find directories for... Read More
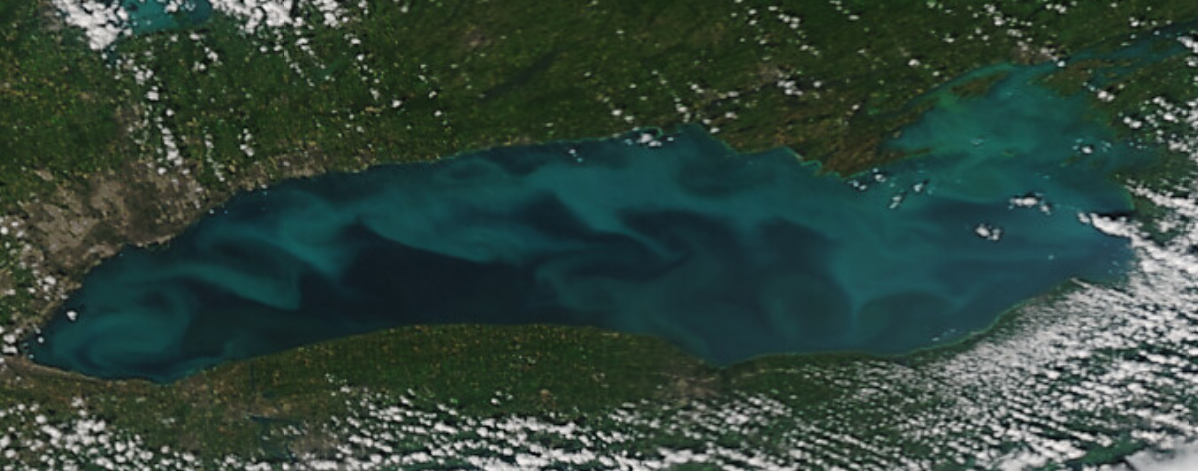
NOAA-20 VIIRS True-Color Image of Lake Ontario, 1709 UTC on 25 August 2020 (Click to enlarge)
The Cooperative Institute for Meteorological Satellite Studies (CIMSS) acquires data directly from polar-orbiting satellites such as Suomi-NPP and NOAA-20 through Direct Broadcast antennae that are on the UW-Madison Campus. Community Satellite Processing Package (CSPP) software takes the Direct Broadcast signal and creates data files and, with Polar2Grid, imagery that are easily accessible at this ftp site where users can find directories for Suomi-NPP (ftp://ftp.ssec.wisc.edu/pub/eosdb/npp/) and for NOAA-20 (ftp://ftp.ssec.wisc.edu/pub/eosdb/j01/). ATMS and CrIS data (used in numerical modeling) are processed first and usually are finished processing in about an hour.
Direct Broadcast data is the fastest way to acquire data from Polar Orbiting satellites.
VIIRS True Color imagery (that is then fed to the CIMSS VIIRS Today Website), with a 375-m resolution (at nadir) has spectacular detail. The image above, from NOAA-20, (here is a link to the entire image, a link that will become stale after about 10 days) shows color variability over Lake Ontario at 1709 UTC. The image below shows the Suomi-NPP scene of the same region 50 minutes later, at 1759 UTC (cut from this entire image.) One could compare the images and estimate lake surface currents.
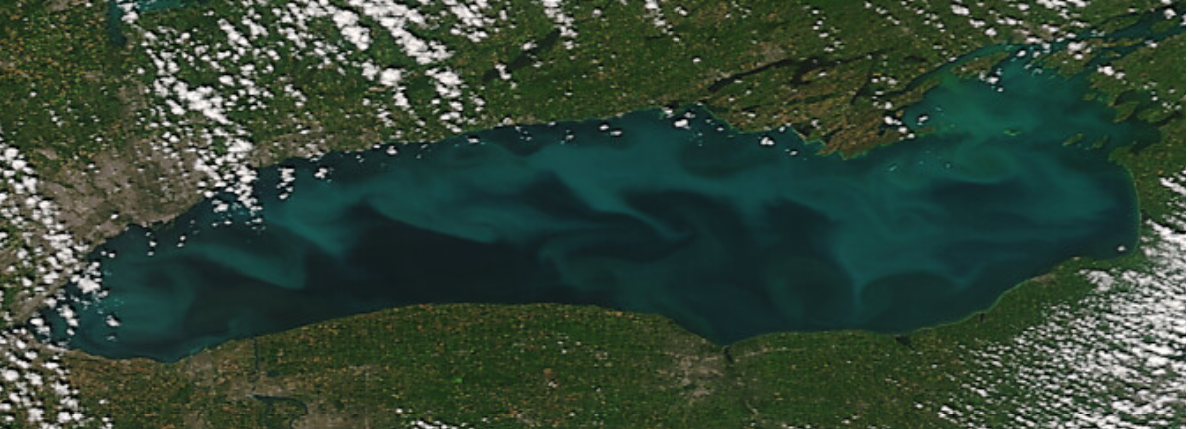
Suomi-NPP VIIRS True-Color Image of Lake Ontario, 1759 UTC on 25 August 2020 (Click to enlarge)
The blog post immediately below this one notes the extensive smoke from Western Fires over the Midwest United States. The 1709 UTC image, below, shows the smoke pall along the east coast — but mostly north of the mouth of Chesapeake Bay.

NOAA-20 VIIRS True-color imagery over the Mid-Atlantic States, 1709 UTC on 25 August 2020 (Click to enlarge)
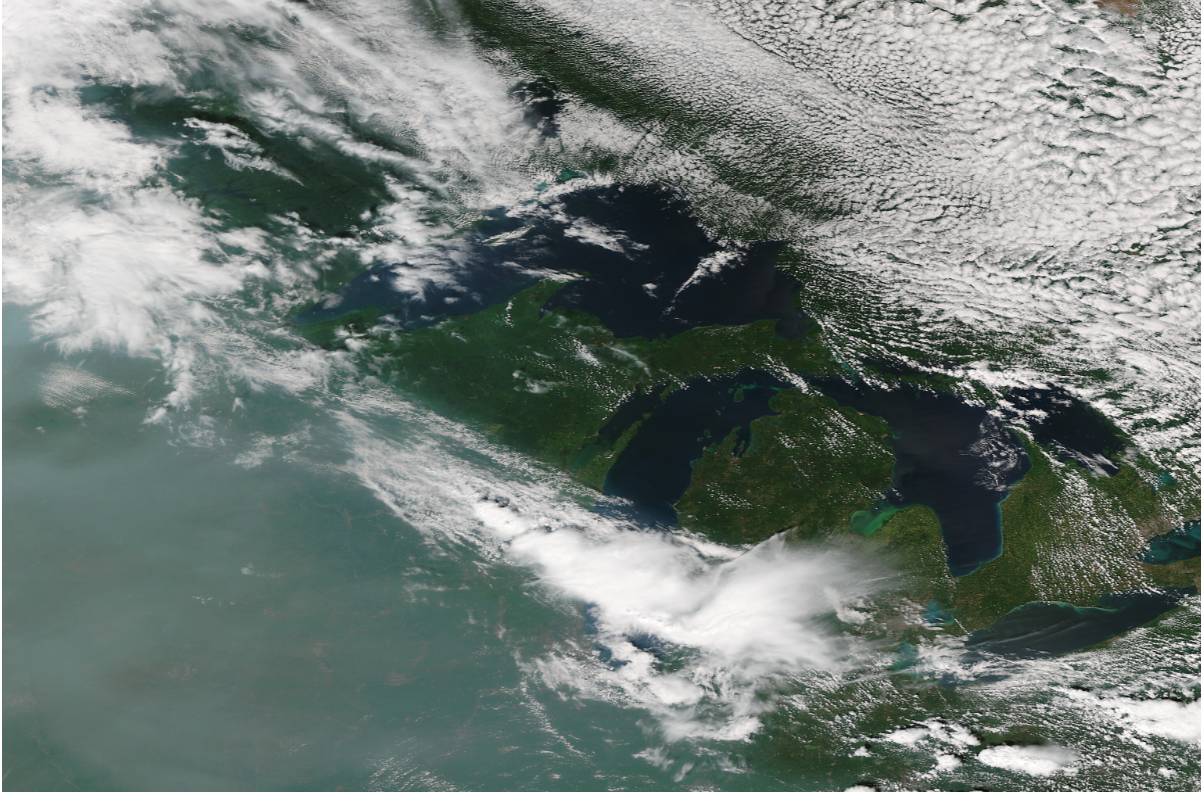
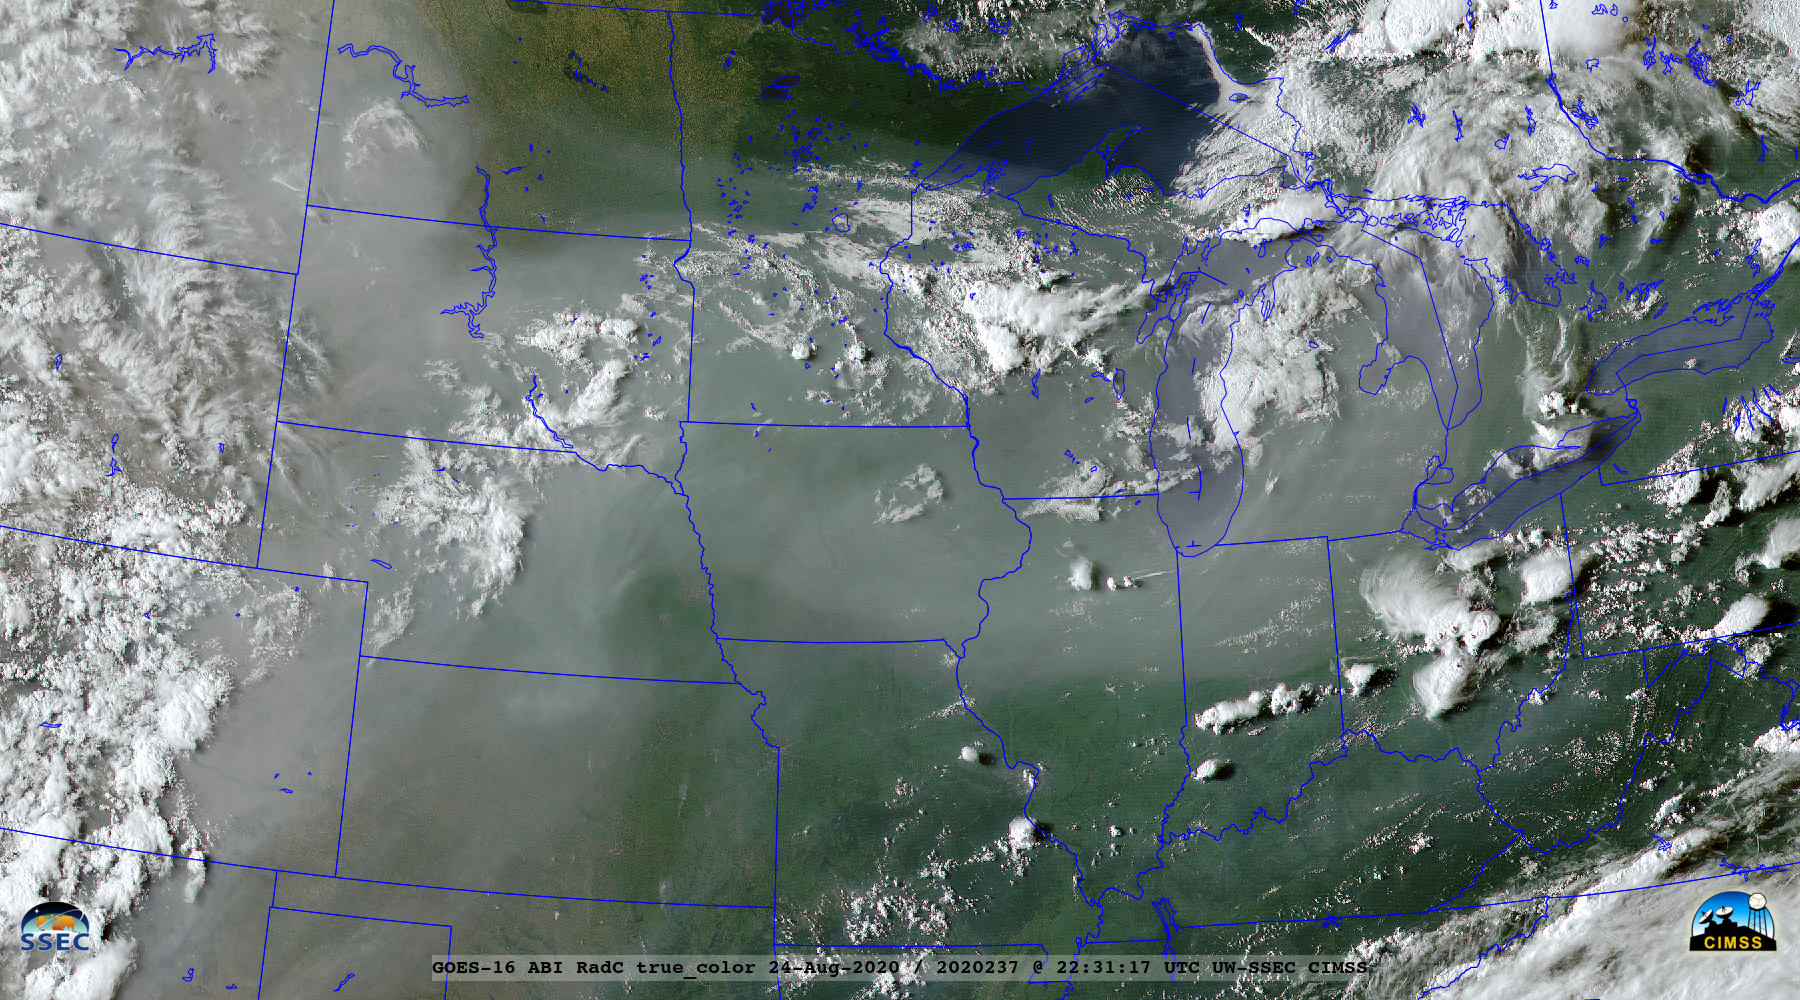
Similarly, True-Color imagery at 1759 UTC on 25 August 2020 from Suomi-NPP shows thick smoke over much of the Midwest south of a frontal boundary over the western Great Lakes.
Suomi NPP True Color Imagery over the western Great Lakes and midwest, 1759 UTC on 25 August 2020 (Click to enlarge)
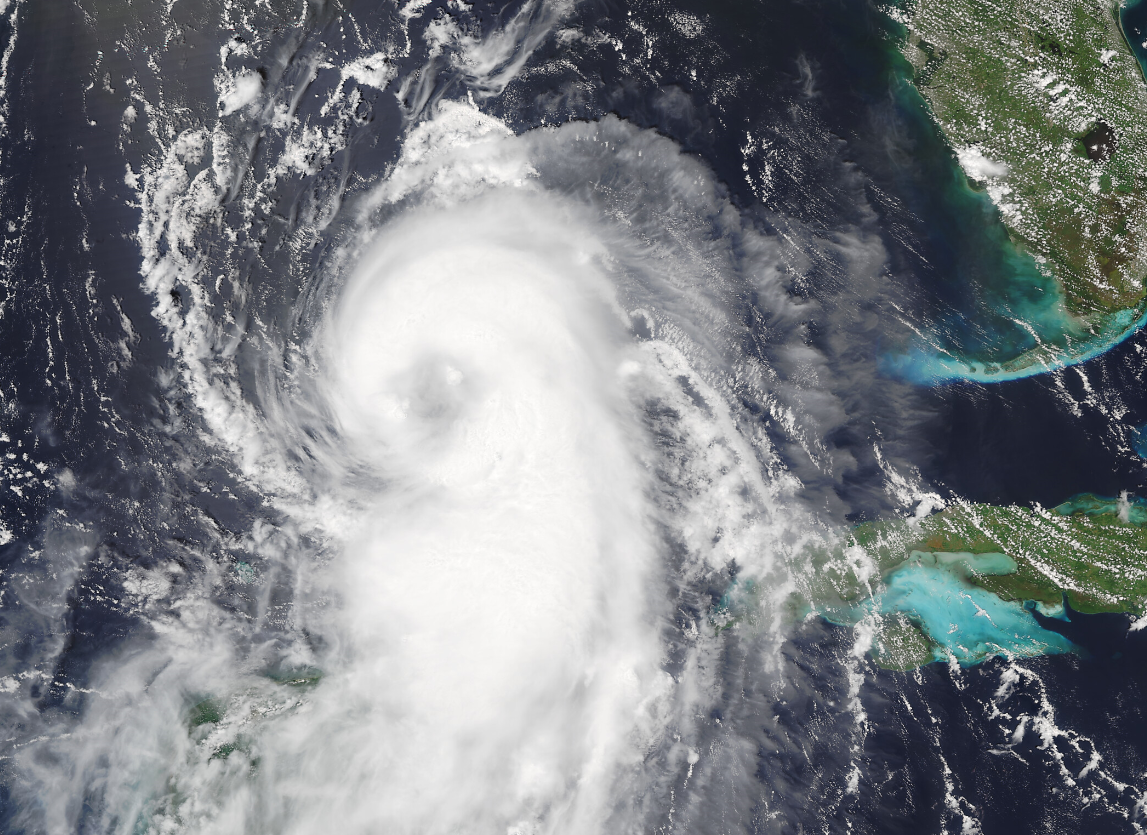
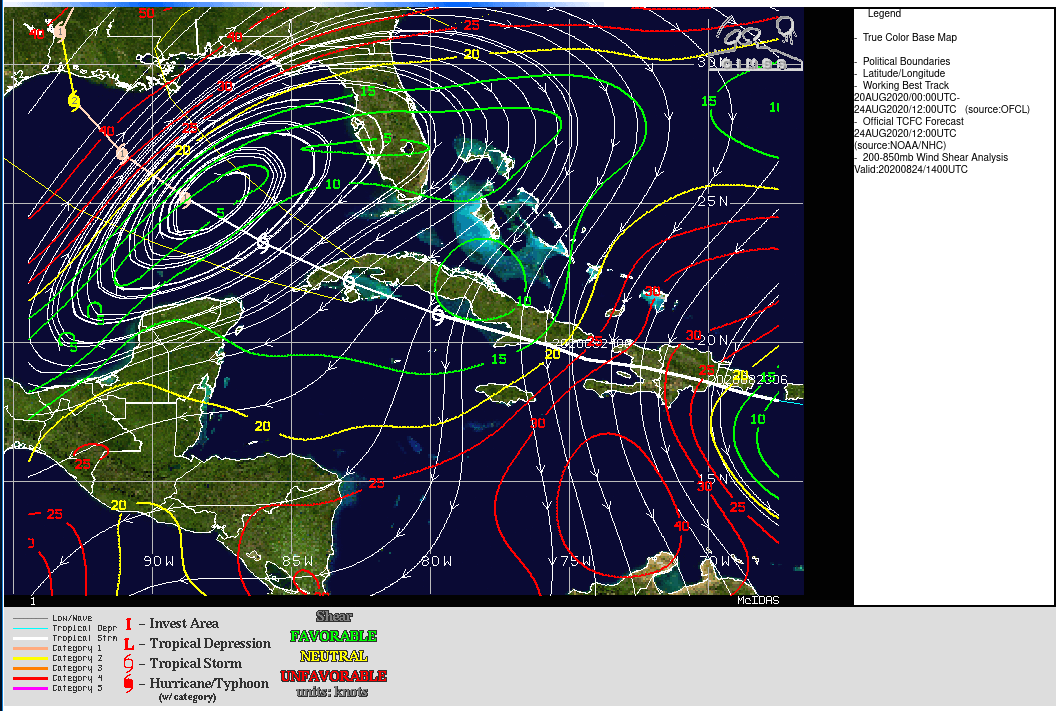
The Direct Broadcast Antenna in Madison can view acquire information from satellites that are over the northwest Caribbean, in northern Canada, and along the west coast of the United States, as shown by the dashed circle in this image (from this website). On 25 August, imagery of Hurricane Laura was available. The image below is the true-color image of Laura at 1759 UTC from Suomi NPP. Beneath that is the true-color image of Laura at 1849 UTC from NOAA-20. The two different satellites in similar orbits — 50 minutes apart — can be used to create high spatial resolution animations. This is easier to do when satellite data are re-projected onto a fixed grid, of course, as done for the VIIRS Today website. (NOAA-20 view or Laura today; Suomi-NPP view or Laura today, both from VIIRS Today.)

Suomi-NPP True-Color imagery over Hurricane Laura, 1759 UTC on 25 August 2020 (Click to enlarge)
NOAA-20 True-Color image of Hurricane Laura, 1849 UTC on 25 August 2020 (Click to enlarge)
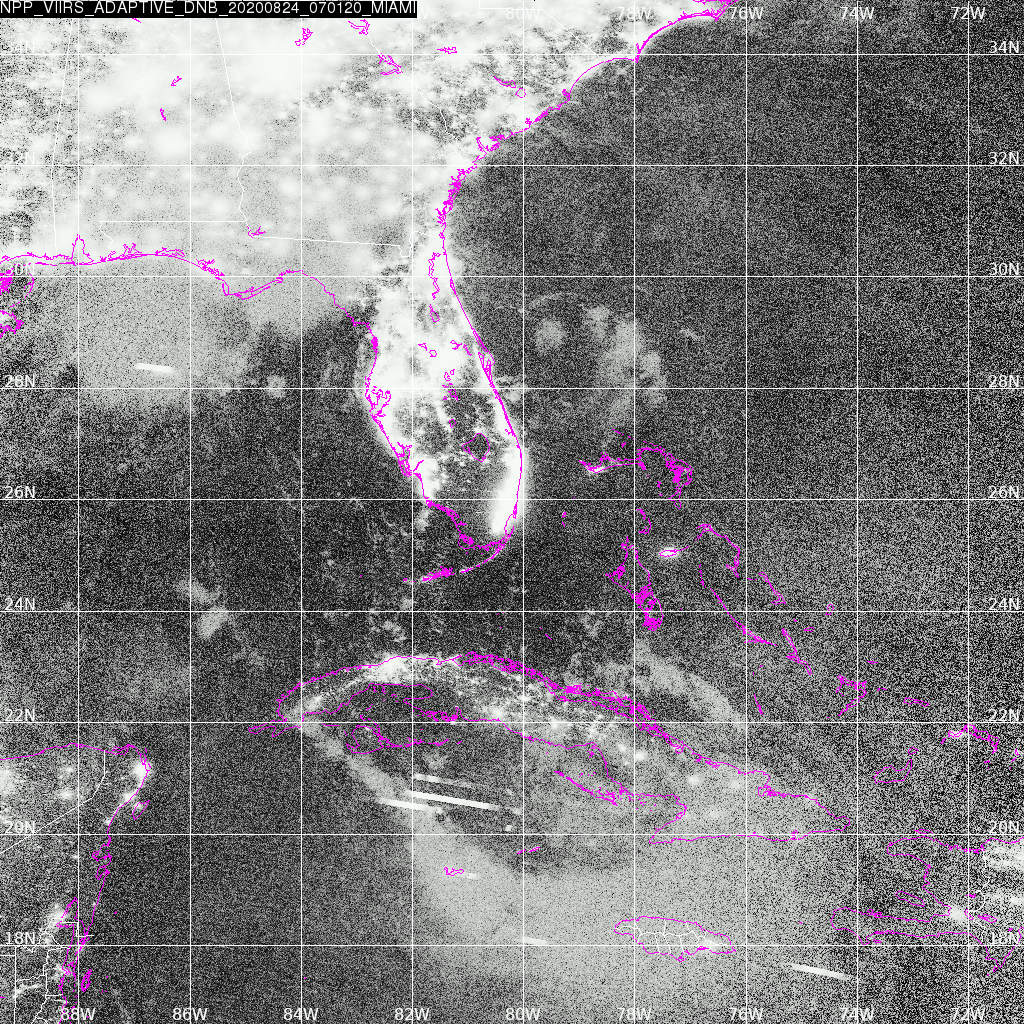
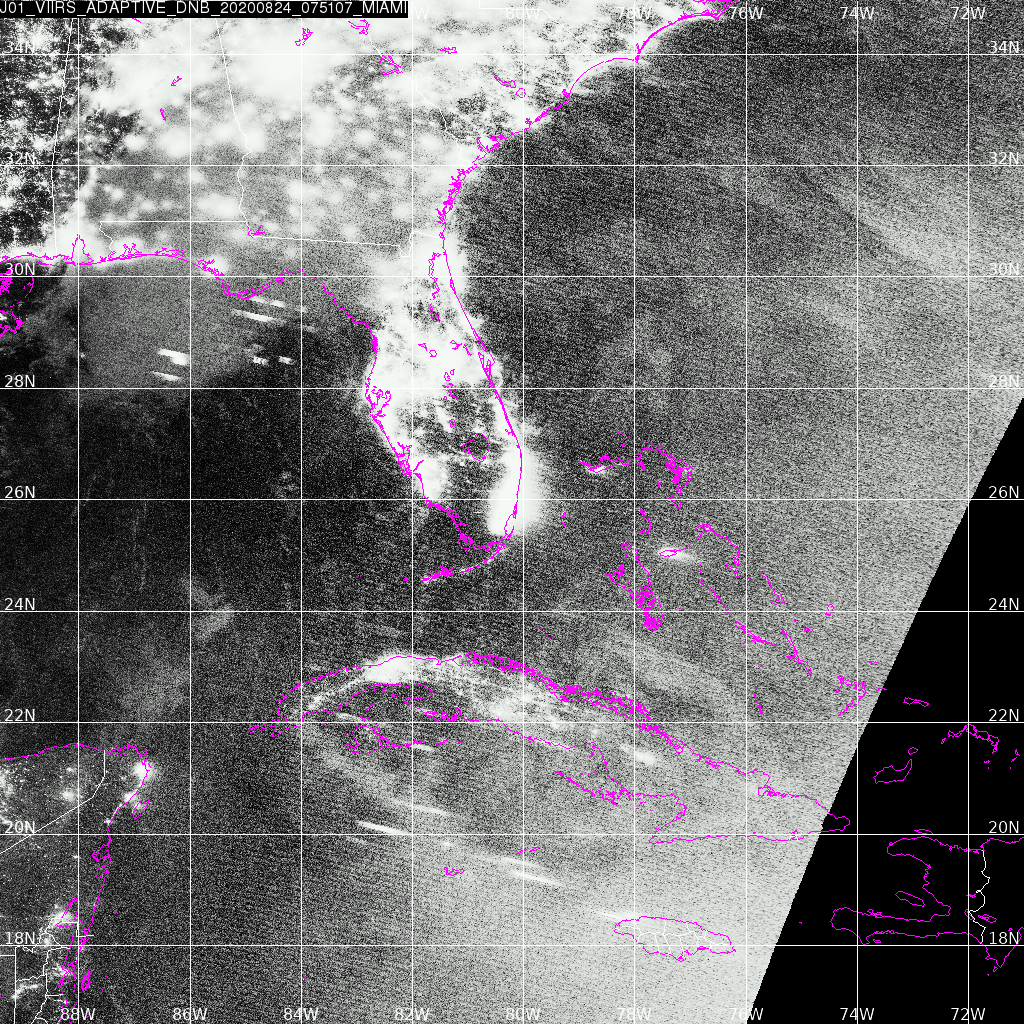
Both the VIIRS Today Website and the direct broadcast FTP directories include True Color, False Color, and Day Night Band imagery. Direct Broadcast imagery extends farther south and especially farther north than imagery at VIIRS Today. The Direct Broadcast ftp directory also contains images of individual ATMS channels, individual VIIRS channels (including the Day Night Band), MIRS products such as Rain Rate, and CLAVR-X cloud products (Rain Rate, Cloud Mask, Cloud Phase, etc.).
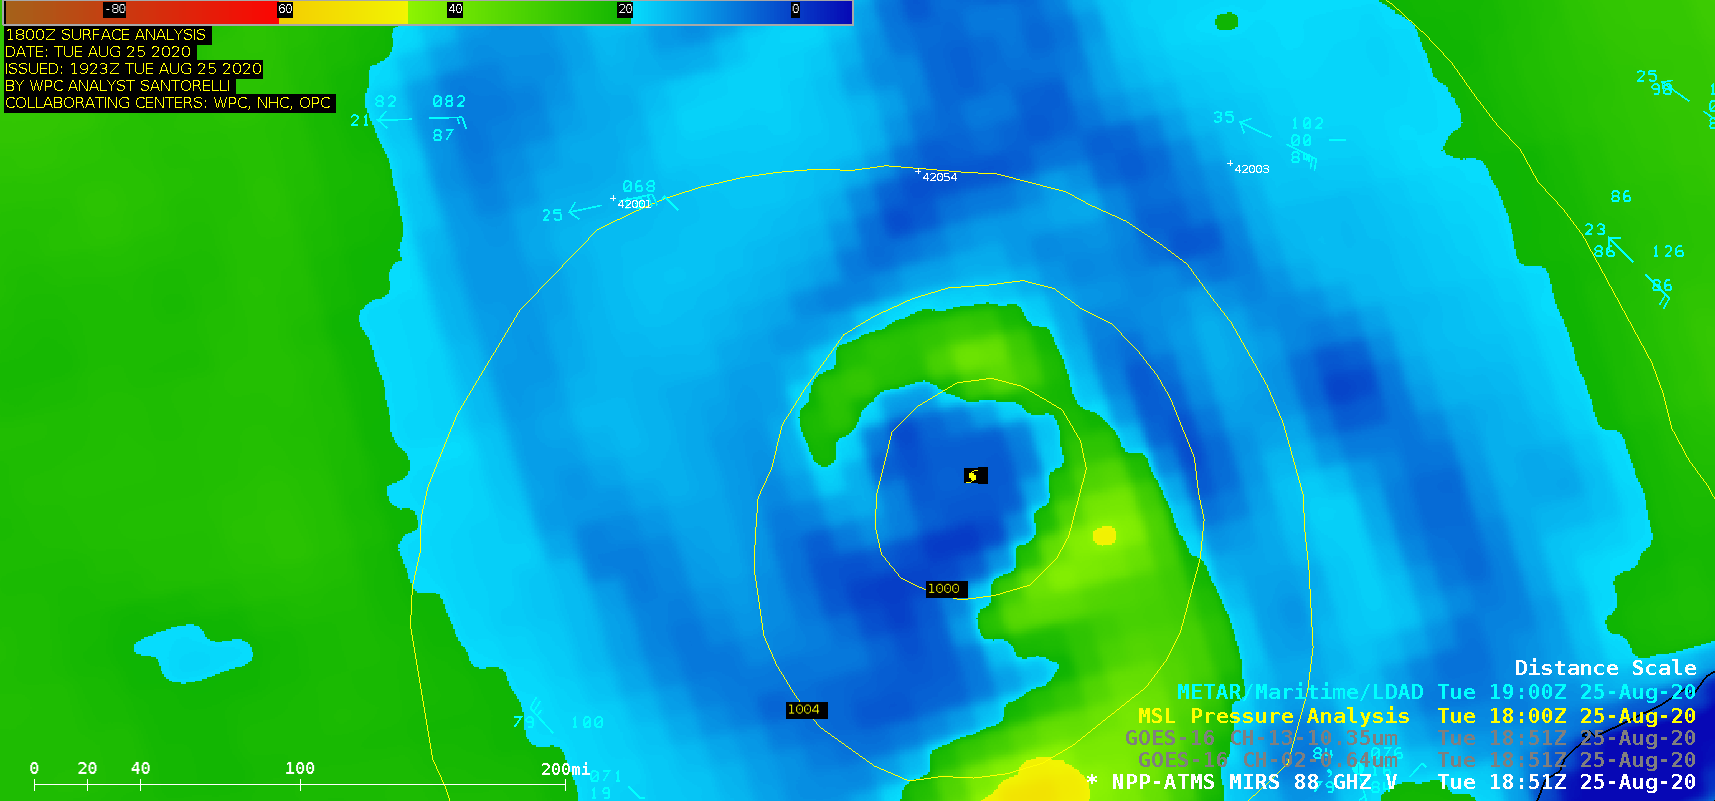
For the latest information on Hurricane Laura in the Gulf, refer to the National Hurricane Center.
View only this post
Read Less
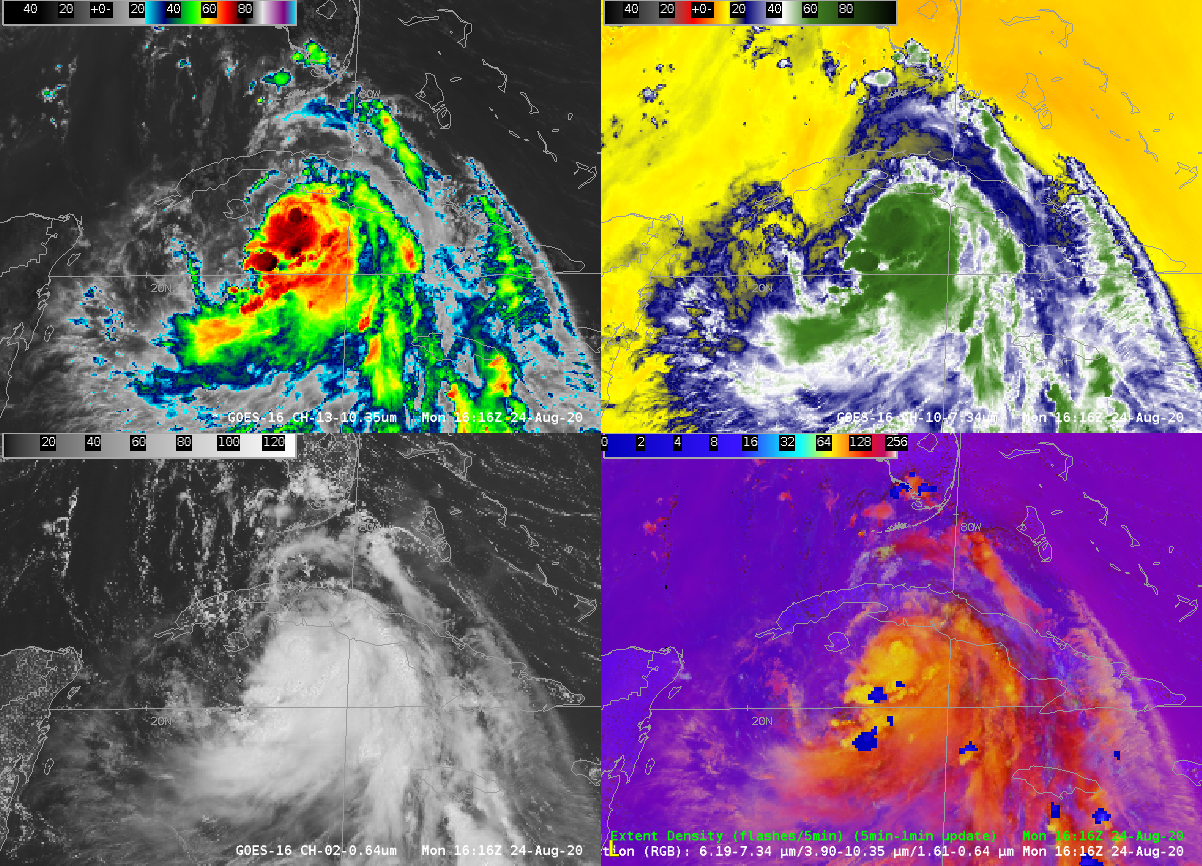
![GOES-16 “Red” Visible (0.64 µm) and “Clean” Infrared Window (10.35 µm) images [click to play animation | MP4]](https://cimss.ssec.wisc.edu/satellite-blog/images/2020/08/200825_goes16_visible_infrared_Hurricane_Laura_anim.gif)

![Infrared Window images from Suomi NPP (11.45 µm) and GOES-16 (10.35 µm) images at 1943 UTC [click to enlarge]](https://cimss.ssec.wisc.edu/satellite-blog/images/2020/08/200825_1943utc_suomiNPP_goes16_infrared_Hurricane_Laura_anim.gif)
![GOES-16 True Color RGB images [click to play animation | MP4]](https://cimss.ssec.wisc.edu/satellite-blog/images/2020/08/200824_goes16_trueColorRGB_CA_wildfire_smoke_anm.gif)
![532 nm and 1064 nm lidar attenuated backscatter during 24 August at Madison, Wisconsin [click to enlarge]](https://cimss.ssec.wisc.edu/satellite-blog/images/2020/08/200824_532backscatter_1064backscatter_Madison_WI_anim.gif)
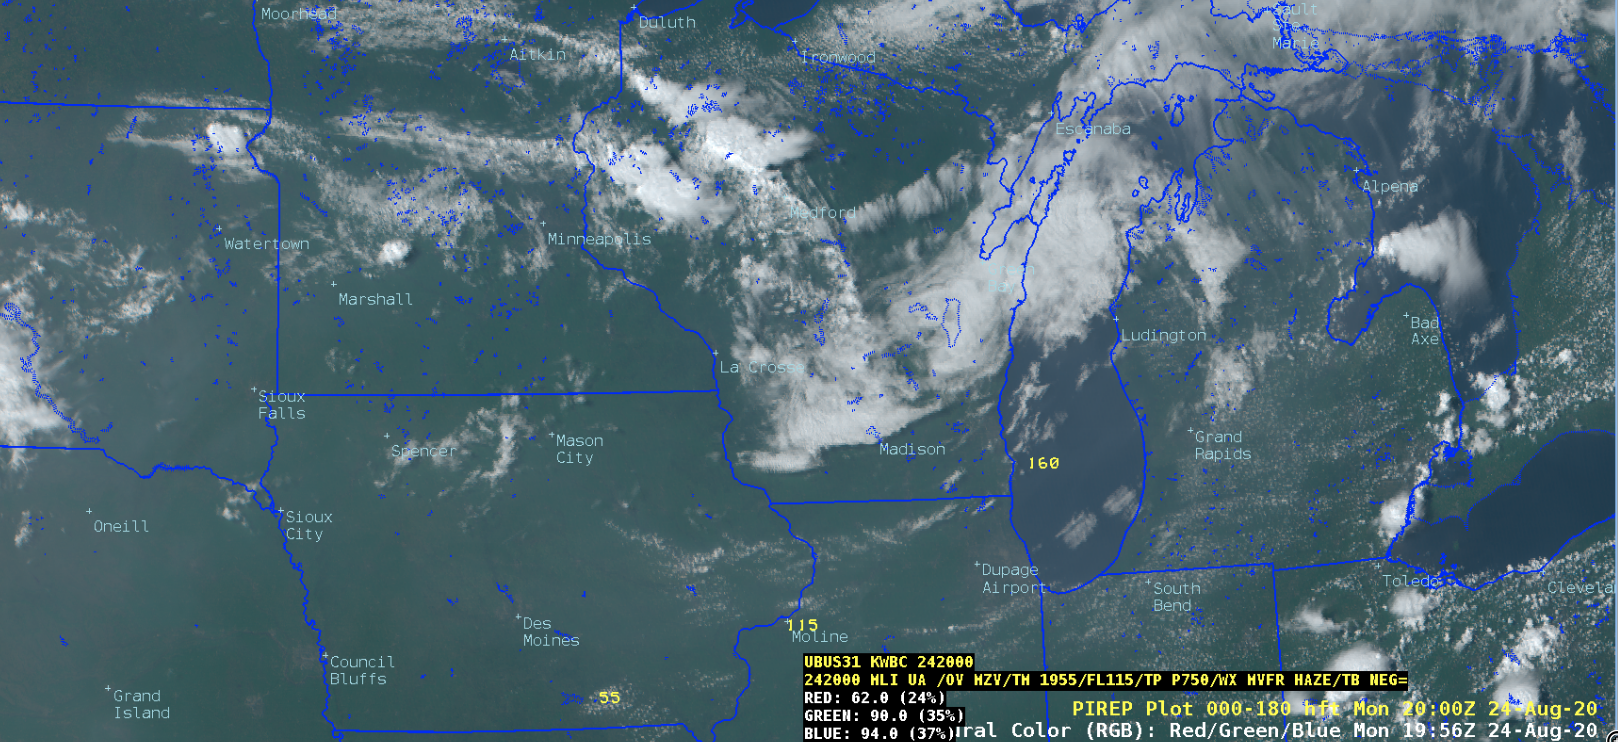
![CIMSS Natural Color RGB images, with plots of Pilot Reports [click to play animation | MP4]](https://cimss.ssec.wisc.edu/satellite-blog/images/2020/08/200824_goes16_cimssNaturalColorRGB_pireps_Upper_Midwest_smoke_anim.gif)

