Goni in the South China Sea
Himawari-8 Target (every 2.5 minutes) Infrared (10.41 µm) and visible (0.64 µm) Imagery, 0122 to 1352 UTC on 2 November 2020 (Click to animate)
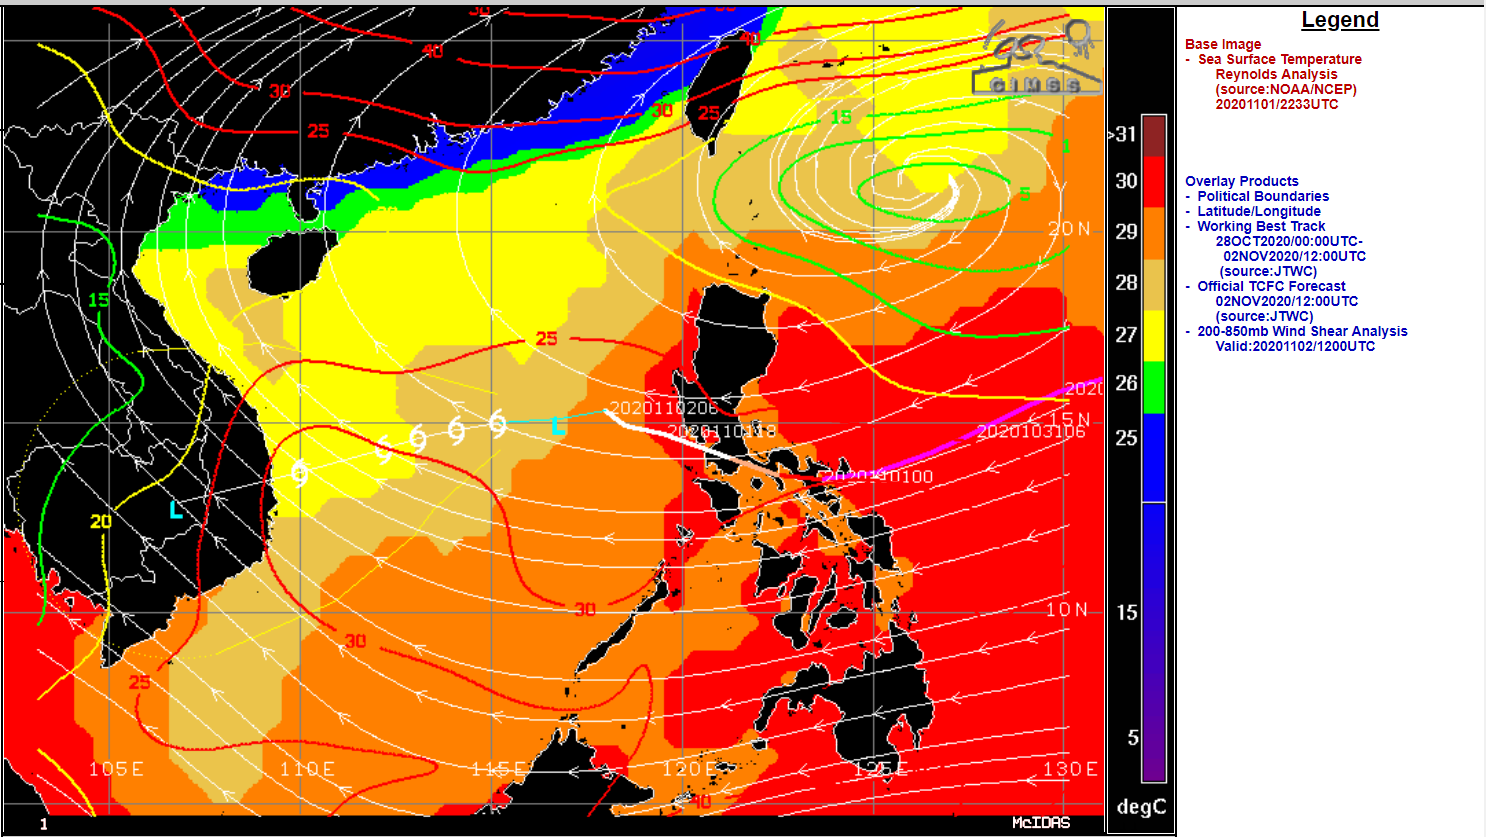
Typhoon Goni hit the Phillipines as a major typhoon on 31 October. Since then, an increase in shear and the topography of Luzon have both weakened the storm significantly. The mp4 animation above (click here as an mp4) shows 2.5-minute Himawari-8 Target imagery Infrared (10.41 µm, left) and visible (0.64 µm, right) imagery from 0122 through 1352 UTC on 2 November. Although significant convection continues, especially after dark near the center, suggesting strengthening, strong easterly shear, shown below, from this website, is present. Convection in the animation above is displaced to the west of the surface circulation, as expected given the shear. In addition, sea surface temperatures become progressively cooler along the projected track. Environmental factors do not favor significant strengthening.

Past and predicted storm path/intensity for Goni in the South China Sea, along with 1200 UTC 2 November Tropospheric Shear (850-200 mb), click to enlarge)
A two-day animation of MIMIC Total Precipitable water (imagery from this ftp site) shows the change in circulation as Goni moved over Luzon.

MIMIC Total Precipitable Water, 0000 UTC on 31 October through 0000 UTC 2 November 2020 (Click to animate)