1-minute Mesoscale Domain Sector GOES-16 (GOES-East) “Red” Visible (0.64 µm), Shortwave Infrared (3.9 µm), “Clean” Infrared Window (10.35 µm) and Fire Temperature Red-Green-Blue (RGB) images (above) showed a period of extreme behavior of the East Troublesome Fire in Colorado around and just after sunset on 21 October 2020. This rapidly-growing wildfire produced a series of pyrocumulonimbus (pyroCb) clouds — the coldest pyroCb cloud-top 10.35 µm infrared brightness temperatures... Read More
![GOES-16 “Red” Visible (0.64 µm, top left), Shortwave Infrared (3.9 µm, top right), “Clean” Infrared Window (10.35 µm, bottom left) and Fire Temperature RGB (bottom right) [click to play animation | MP4]](https://cimss.ssec.wisc.edu/satellite-blog/images/2020/10/co_4p-20201022_023154.png)
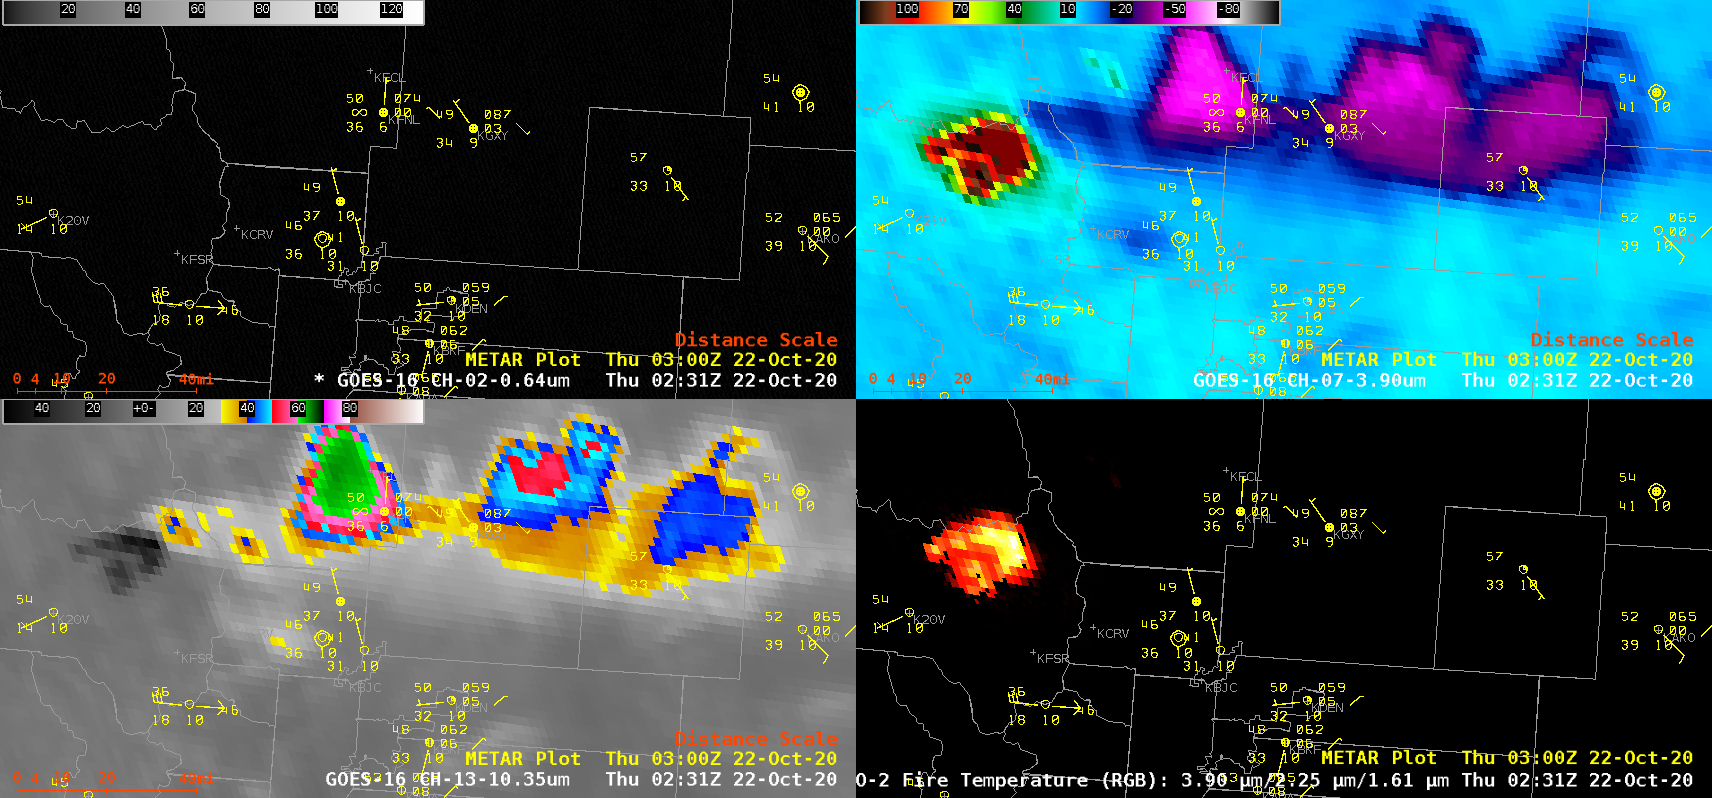
GOES-16 “Red” Visible (0.64 µm, top left), Shortwave Infrared (3.9 µm, top right), “Clean” Infrared Window (10.35 µm, bottom left) and Fire Temperature RGB (bottom right) [click to play animation | MP4]
1-minute
Mesoscale Domain Sector GOES-16
(GOES-East) “Red” Visible (
0.64 µm), Shortwave Infrared (
3.9 µm), “Clean” Infrared Window (
10.35 µm) and
Fire Temperature Red-Green-Blue (RGB) images
(above) showed a period of extreme behavior of the
East Troublesome Fire in Colorado around and just after sunset on
21 October 2020. This rapidly-growing wildfire produced a series of
pyrocumulonimbus (pyroCb) clouds — the coldest pyroCb cloud-top 10.35 µm infrared brightness temperatures were -65.1ºC
(darker green enhancement). The hottest Shortwave Infrared brightness temperatures within the fire’s large thermal anomaly were 138.7ºC — which is the saturation temperature of 3.9 µm detectors on the
ABI instrument of GOES-16.
=====22 October Update =====
A time-matched comparison of Shortwave Infrared images from Suomi NPP VIIRS (3.74 µm) and GOES-16 ABI (3.9 µm), valid at 0839 UTC on 22 October, is shown below. The finer spatial resolution of VIIRS (375 meters at nadir, vs 2 km for ABI) provided a more accurate depiction of the location of hottest fire pixels at that time. Note the amount of northwestward parallax shift of the cold (dark blue to violet) high clouds on the GOES-16 image.
![Shortwave Infrared images from Suomi NPP VIIRS (3.74 µm) and GOES-16 ABI (3.9 µm), valid at 0839 UTC [click to enlarge]](https://cimss.ssec.wisc.edu/satellite-blog/images/2020/10/201022_0839utc_suomiNPP_goes16_shortwaveInfrared_East_Troublesome_Fire_CO_anim.gif)
Shortwave Infrared images from Suomi NPP VIIRS (3.74 µm) and GOES-16 ABI (3.9 µm), valid at 0839 UTC [click to enlarge]
During the subsequent daytime hours, GOES-16 Visible, Shortwave Infrared, Infrared Window and Fire Temperature RGB images
(below) showed another series of pyroCb clouds that were produced by the East Troublesome Fire — but not to the extent that was seen on 21 October. By early evening, the total burned area had increased to 170,163 acres (and was only 5% contained).
![GOES-16 “Red” Visible (0.64 µm, top left), Shortwave Infrared (3.9 µm, top right), “Clean” Infrared Window (10.35 µm, bottom left) and Fire Temperature RGB (bottom right) [click to play animation | MP4]](https://cimss.ssec.wisc.edu/satellite-blog/images/2020/10/co2_4p-20201022_211454.png)
GOES-16 “Red” Visible (0.64 µm, top left), Shortwave Infrared (3.9 µm, top right), “Clean” Infrared Window (10.35 µm, bottom left) and Fire Temperature RGB (bottom right) [click to play animation | MP4]
Two high-resolution views of some of the pyroCb clouds and the fire’s thermal anomaly were provided by VIIRS Visible (0.64 µm), Shortwave Infrared (3.74 µm) and Infrared Window (11.45 µm) images from NOAA-20 at 1904 UTC and Suomi NPP at 1956 UTC
(below).
![VIIRS Visible (0.64 µm), Shortwave Infrared (3.74 µm) and Infrared Window (11.45 µm) images from NOAA-20 and Suomi NPP [click to enlarge]](https://cimss.ssec.wisc.edu/satellite-blog/images/2020/10/201022_noaa20_suomiNPP_viirs_visible_shortwaveInfrared_infraredWindow_East_Troublesome_Fire_CO_anim.gif)
VIIRS Visible (0.64 µm), Shortwave Infrared (3.74 µm) and Infrared Window (11.45 µm) images from NOAA-20 and Suomi NPP [click to enlarge]
Additional satellite imagery of this fire event is available on the
Satellite Liaison Blog.
===== 23 October Update =====
![GOES-16 True Color images [click to play animation | MP4]](https://cimss.ssec.wisc.edu/satellite-blog/images/2020/10/GOES-16_ABI_RadF_true_color_2020297_133020Z.png)
GOES-16 True Color RGB images [click to play animation | MP4]
GOES-16 True Color RGB images created using
Geo2Grid (above) revealed the light brown hue associated with smoke from the East Troublesome Fire, which was being transported eastward across the North Atlantic Ocean; the large cloud field of Hurricane Epsilon could also be seen southwest of the smoke pall. The bulk of this smoke pall was being transported along a cold frontal boundary
(below).
![GOES-16 CIMSS Natural Color RGB images [click to play animation | MP4]'](https://cimss.ssec.wisc.edu/satellite-blog/images/2020/10/atl_rgb-20201023_120020.png)
GOES-16 CIMSS Natural Color RGB images [click to play animation | MP4]
View only this post
Read Less
![GOES-16 “Clean” Infrared Window (10.35 µm) images (with and without an overlay of GLM Flash Extent Density) and “Red” Visible (0.64 µm) images [click to play animation | MP4]](https://cimss.ssec.wisc.edu/satellite-blog/images/2020/10/201025_goes16_infrared_visible_TS_Zeta_anim.gif)
![GOES-16 “Clean” Infrared Window (10.35 µm) images (with and without an overlay of GLM Flash Extent Density) images [click to play animation | MP4]](https://cimss.ssec.wisc.edu/satellite-blog/images/2020/10/201025_goes16_infrared_glmFlashExtentDensity_TS_Zeta_anim.gif)
![GOES-16 “Clean” Infrared Window (10.35 µm) images (with and without an overlay of GLM Flash Extent Density) and “Red” Visible (0.64 µm) images [click to play animation | MP4]](https://cimss.ssec.wisc.edu/satellite-blog/images/2020/10/201026_goes16_infrared_glmFlashExtentDensity_visible_Hurricane_Zeta_anim.gif)
![Sea Surface Temperature and Ocean Heat Content images [click to enlarge]](https://cimss.ssec.wisc.edu/satellite-blog/images/2020/10/201026_seaSurfaceTemperature_oceanHeatContent_Hurricane_Zeta_anim.gif)
![GOES-16 Longwave Infrared (11.2 µm) images, with contours of 22 UTC deep-layer wind shear [click to enlarge]](https://cimss.ssec.wisc.edu/satellite-blog/images/2020/10/201026_infrared_22utc_shear_Zeta.gif)
![Suomi NPP VIIRS Infrared Window (11.45 µm) and Topography images [click to enlarge]](https://cimss.ssec.wisc.edu/satellite-blog/images/2020/10/201025_0915utc_suomiNPP_viirs_infrared_topography_Potomac_MT_anim.gif)

![GOES-16 “Red” Visible (0.64 µm, top left), Shortwave Infrared (3.9 µm, top right), “Clean” Infrared Window (10.35 µm, bottom left) and Fire Temperature RGB (bottom right) [click to play animation | MP4]](https://cimss.ssec.wisc.edu/satellite-blog/images/2020/10/201021_goes16_visible_shortwaveInfrared_infraredWindow_fireTemperatureRGB_EastTroublesomeFire_CO_anim.gif)
![GOES-16 “Red” Visible (0.64 µm, top left), Shortwave Infrared (3.9 µm, top right), “Clean” Infrared Window (10.35 µm, bottom left) and Fire Temperature RGB (bottom right) [click to play animation | MP4]](https://cimss.ssec.wisc.edu/satellite-blog/images/2020/10/201022_goes16_visible_shortwaveInfrared_infraredWindow_fireTemperatureRGB_EastTroublesomeFire_CO_anim.gif)
![GOES-16 True Color images [click to play animation | MP4]](https://cimss.ssec.wisc.edu/satellite-blog/images/2020/10/201023_goes16_trueColorRGB_Colorado_wildfire_smoke_Atlantic_anim.gif)
![GOES-16 CIMSS Natural Color RGB images [click to play animation | MP4]'](https://cimss.ssec.wisc.edu/satellite-blog/images/2020/10/201023_goes16_cimssNaturalColorRGB_Atlantic_smoke_anim.gif)
![GOES-16 “Red” Visible (0.64 µm) and “Clean” Infrared Window (10.35 µm) images [click to play animation | MP4]](https://cimss.ssec.wisc.edu/satellite-blog/images/2020/10/201021_goes16_visible_infrared_Hurricane_Epsilon_anim.gif)
![GOES-16 Mid-level Water Vapor(6.9 µm) images, with plots of Derived Motion Winds [click to enlarge]](https://cimss.ssec.wisc.edu/satellite-blog/images/2020/10/201021_goes16_waterVapor_winds_Epsilon.gif)
