![GOES-16 “Clean” Infrared Window (10.35 µm) images, with hourly Precipitation Type plotted in cyan [click to play animation | MP4]](https://cimss.ssec.wisc.edu/satellite-blog/images/2021/03/210327_210328_goes16_infrared_TN_flooding_anim.gif)
GOES-16 “Clean” Infrared Window (10.35 µm) images, with hourly Precipitation Type plotted in cyan [click to play animation | MP4]
Hourly images of the MIMIC TPW product (below) showed the northward surge of moisture from the Gulf of Mexico beginning early on 27 March, providing an environment conducive to heavy rainfall.
![MIMIC TPW product [click to play animation | MP4]](https://cimss.ssec.wisc.edu/satellite-blog/images/2021/03/210327_210328_mimicTPW_anim.gif)
MIMIC TPW product [click to play animation | MP4]
![Plots of rawinsonde data from 00 UTC and 12 UTC on 27 March [click to enlarge]](https://cimss.ssec.wisc.edu/satellite-blog/images/2021/03/210327_KBNA_RAOBS.GIF)
Plots of Nashville rawinsonde data from 00 UTC and 12 UTC on 27 March [click to enlarge]
![Plots of rawinsonde data from 00 UTC and 12 UTC on 28 March [click to enlarge]](https://cimss.ssec.wisc.edu/satellite-blog/images/2021/03/210328_KBNA_RAOBS.GIF)
Plots of Nashville rawinsonde data from 00 UTC and 12 UTC on 28 March [click to enlarge]
Here are some of our highest rainfall reports from Saturday morning through this morning and a map of combined radar estimates and observed precip. https://t.co/H9DHgOxCZW pic.twitter.com/Hk8qMxcRc3
— NWS Nashville (@NWSNashville) March 28, 2021
Nashville has measured another 0.94″ of rain since midnight. This gives us a 2-day rainfall total of 6.69″. This surpasses the 6.68″ measured on September 13-14, 1979, and gives us our 2nd largest 2-day rainfall total in Nashville’s history, trailing only May 1-2, 2010 (13.57″).
— NWS Nashville (@NWSNashville) March 28, 2021
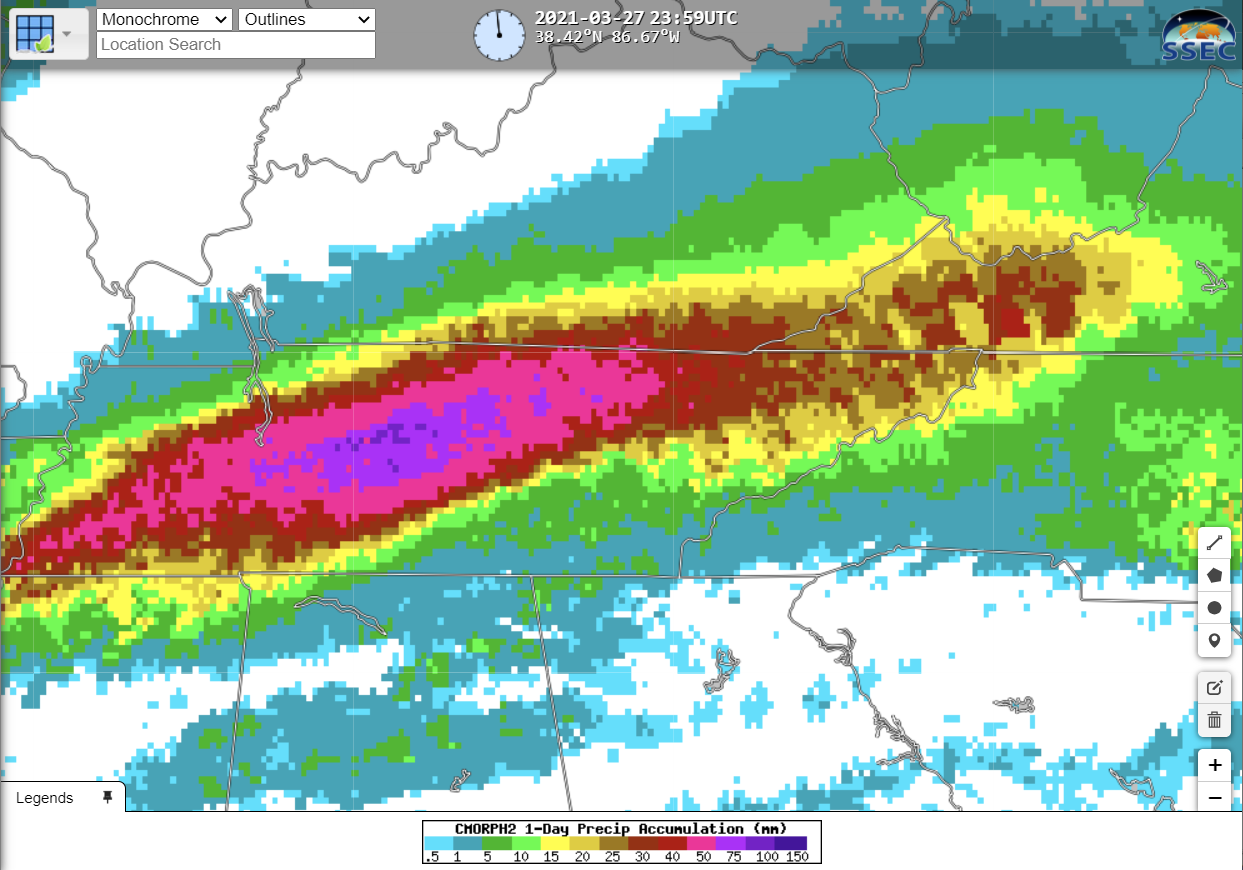
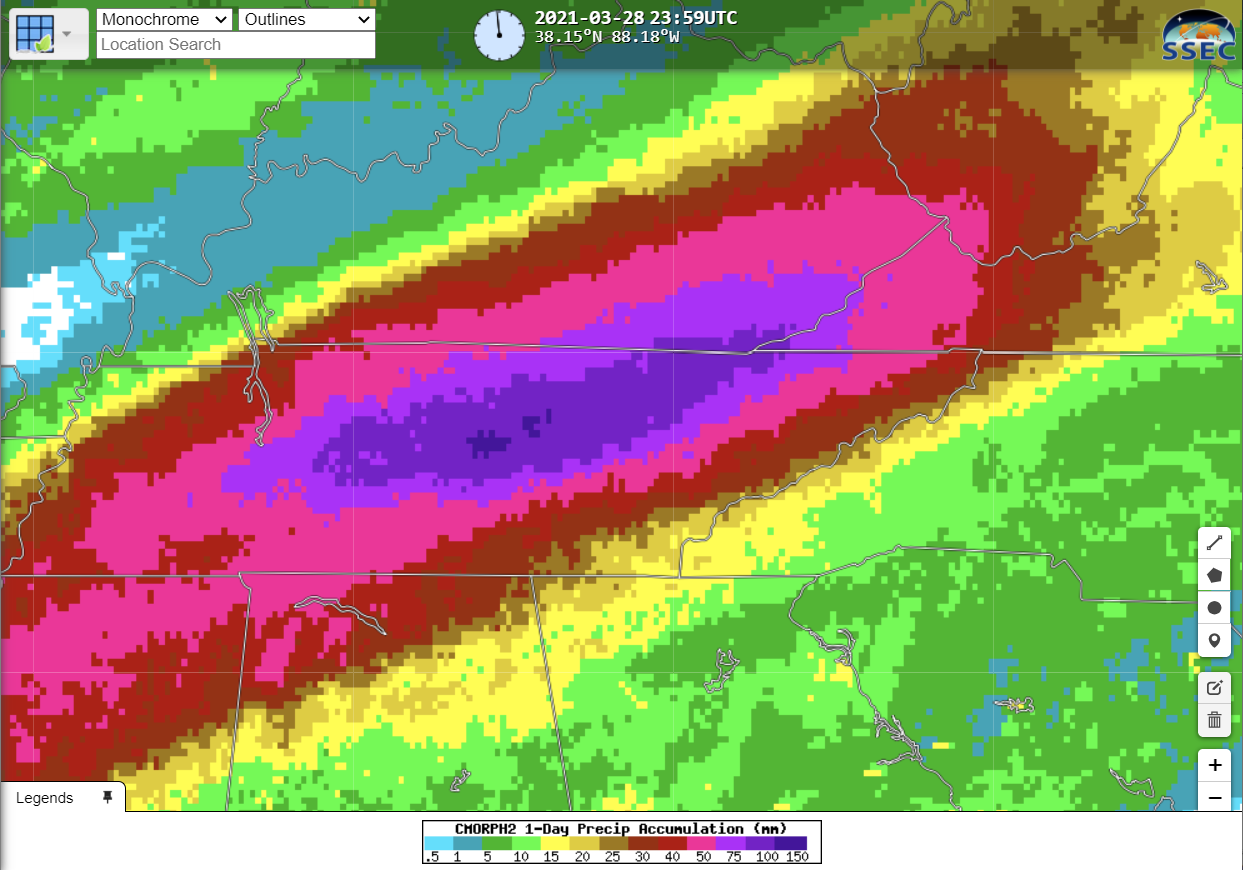
CMORPH estimates of accumulated precipitation (available in RealEarth) are shown below, with 24-hour totals ending 23:59 on 27 March (left) and 28 March (right). The darker purple region denotes totals of >100 mm in 24 hours.
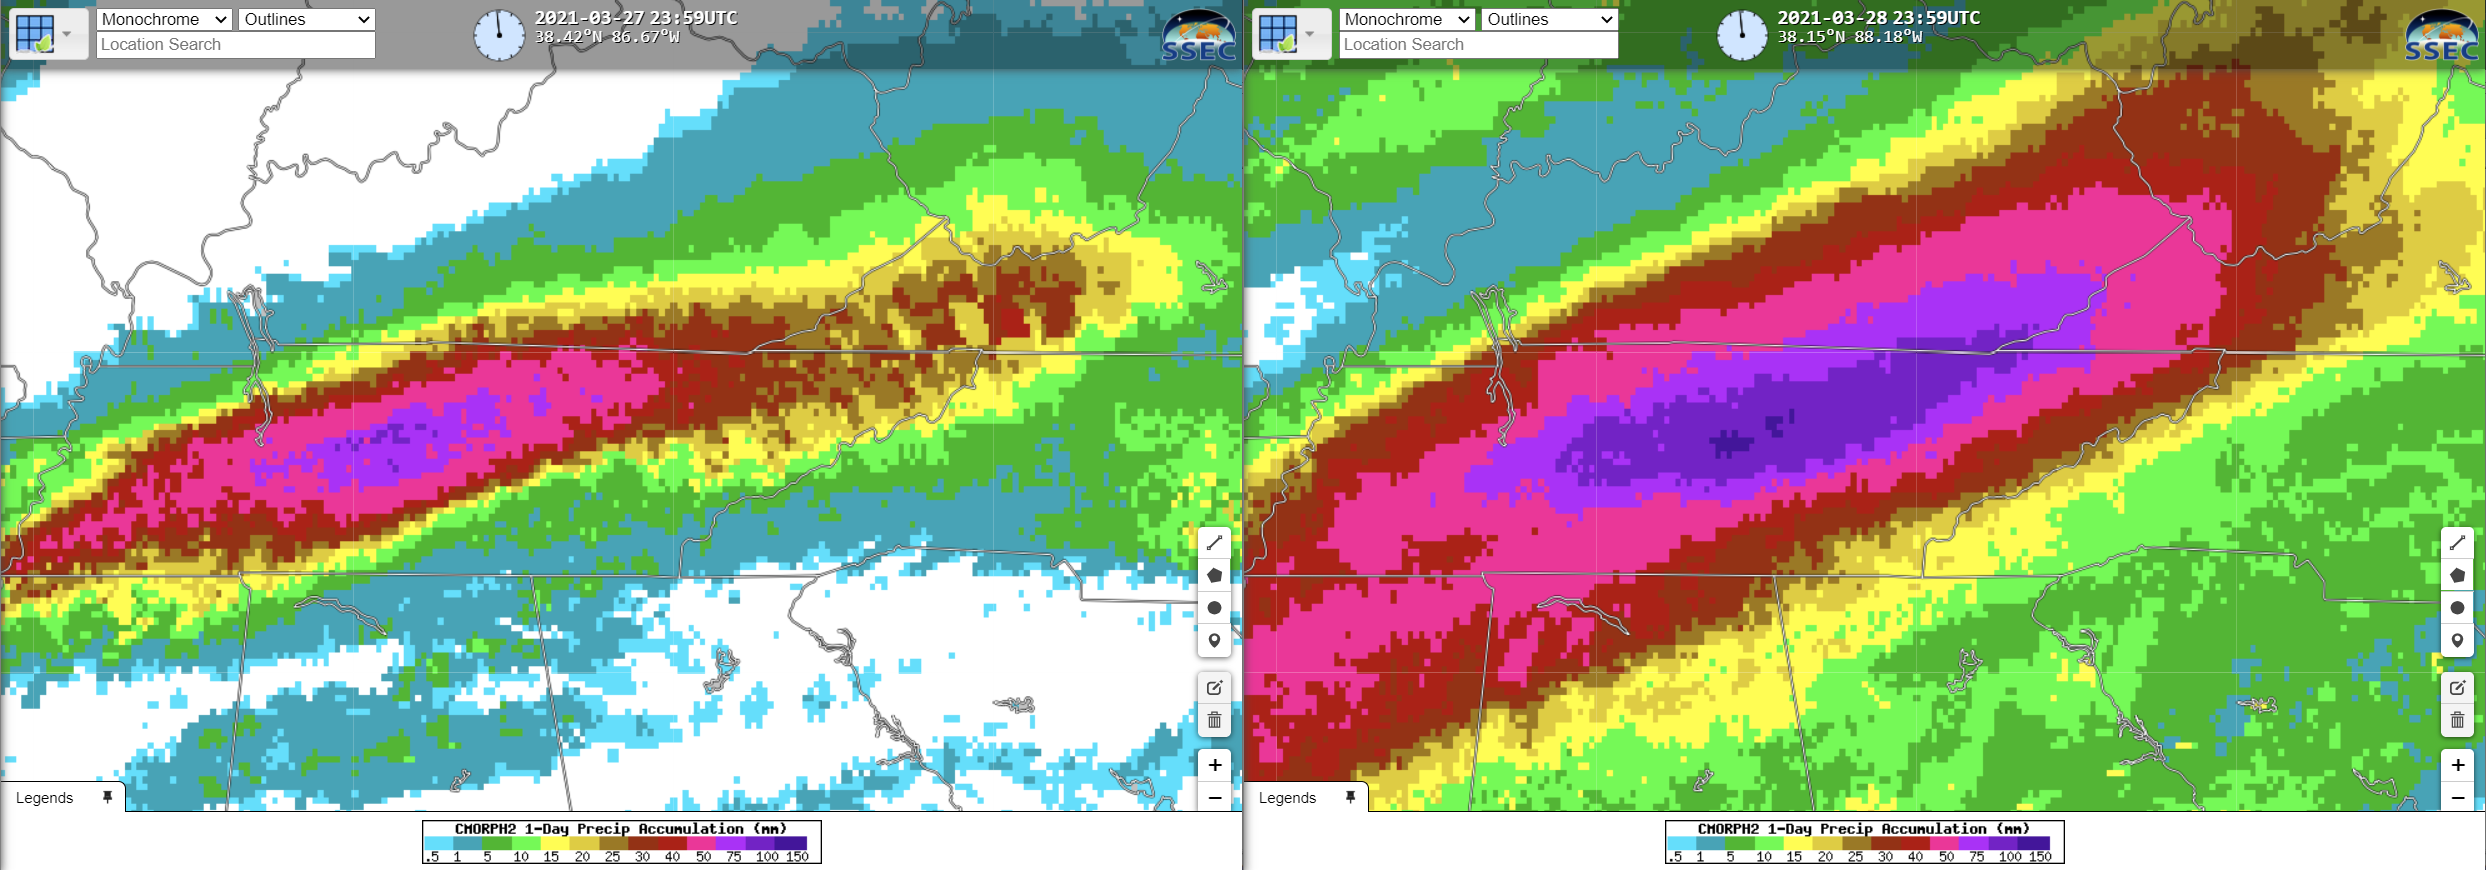
24-hour precipitation totals ending 23:59 on 27 March (left) and at 23:59 28 March (right) 2021 (Click to enlarge)
View only this post Read Less

![GOES-16 “Red” Visible (0.64 µm) images, with time-matched SPC Storm Reports plotted in red [click to play animation | MP4]](https://cimss.ssec.wisc.edu/satellite-blog/images/2021/03/210325_goes16_visible_spcStormReports_Deep_South_anim.gif)
![GOES-16 “Clean” Infrared Window (10.35 µm) images, with time-matched SPC Storm Reports plotted in cyan [click to play animation | MP4]](https://cimss.ssec.wisc.edu/satellite-blog/images/2021/03/210325_goes16_infrared_spcStormReports_Deep_South_anim.gif)
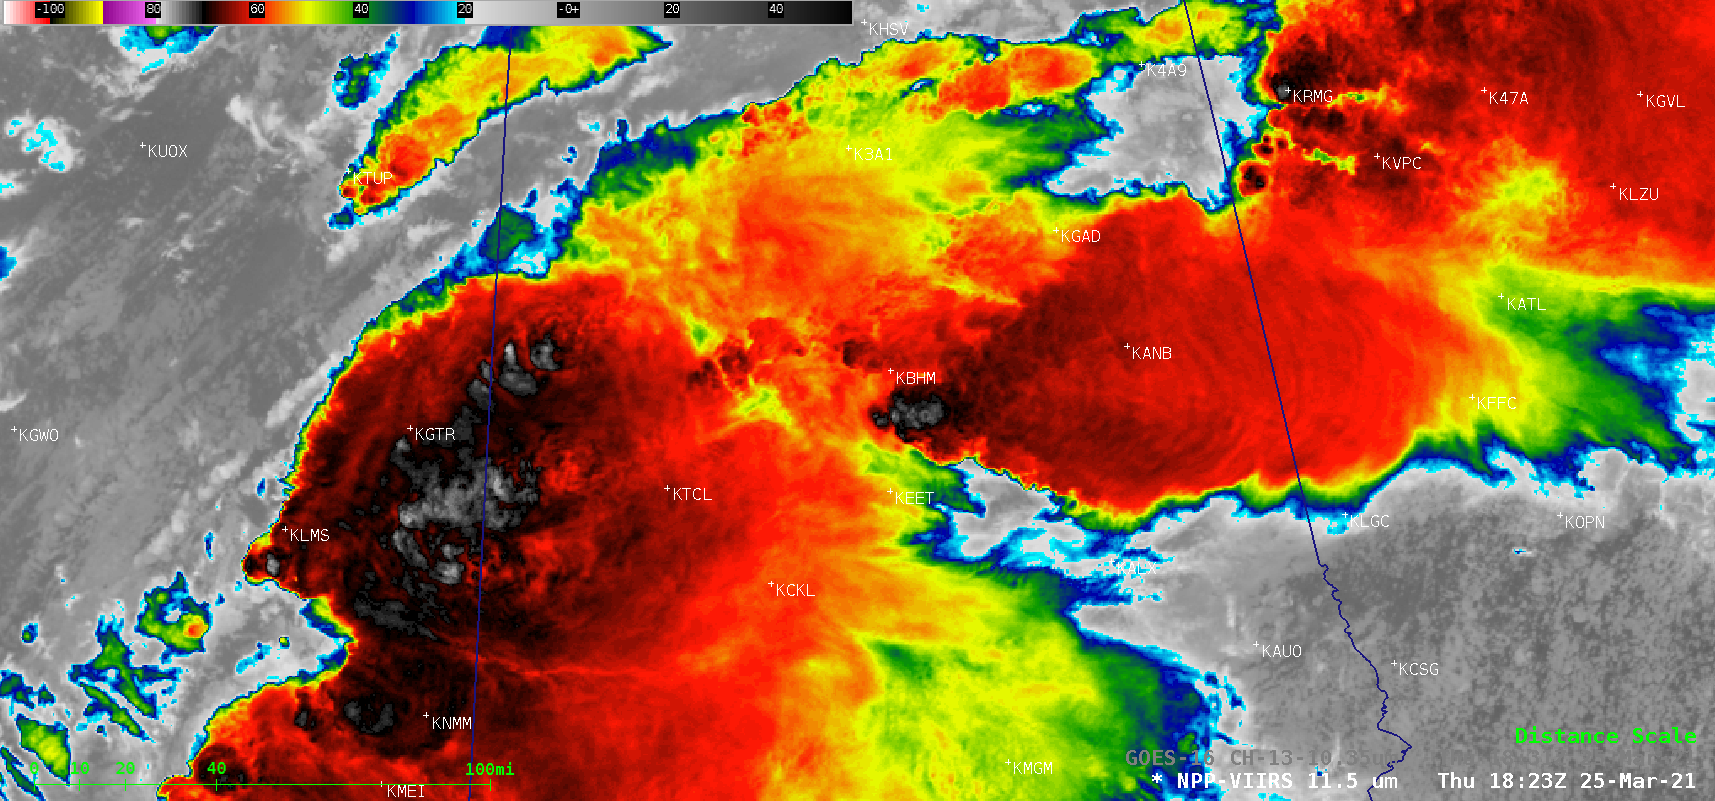
![GOES-16 “Clean” Infrared Window (10.35 µm) and Suomi NPP VIIRS Infrared Window (11.45 µm) images at 1921 UTC [click to enlarge]](https://cimss.ssec.wisc.edu/satellite-blog/images/2021/03/210325_1831utc_suomiNPP_goes16_infrared_Deep_South_anim.gif)
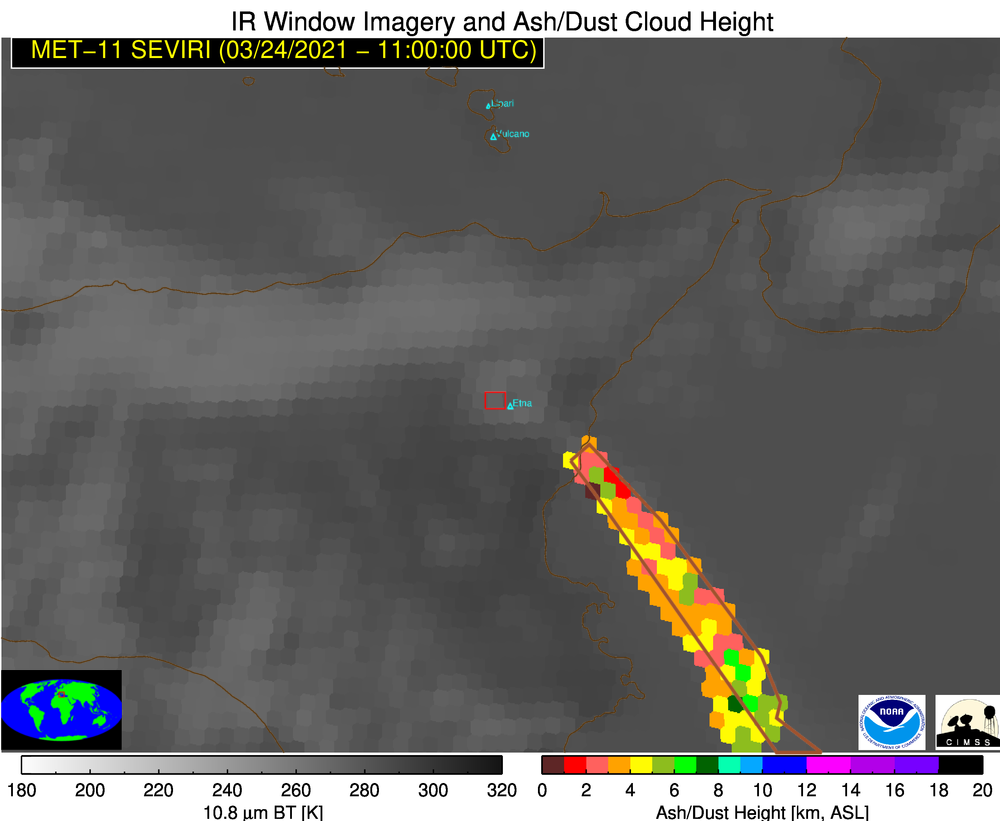
![Meteosat-11 Ash Height images [click to play animation | MP4]](https://cimss.ssec.wisc.edu/satellite-blog/images/2021/03/210324_meteosat11_ashHeight_Etna_anim.gif)
![Meteosat-11 Ash Loading images [click to play animation | MP4]](https://cimss.ssec.wisc.edu/satellite-blog/images/2021/03/210324_meteosat11_ashLoading_Etna_anim.gif)
![Suomi NPP VIIRS Ash Loading at 1200 UTC [click to enlarge]](https://cimss.ssec.wisc.edu/satellite-blog/images/2021/03/210324_1200z_loading_snpp_etna.png)
![VIIRS True Color RGB images from NOAA-20 and Suomi NPP [click to enlarge]](https://cimss.ssec.wisc.edu/satellite-blog/images/2021/03/210324_1124utc_noaa20_1205utc_suomiNPP_viirs_trueColorRGB_Etna_ash_plume_anim.gif)
