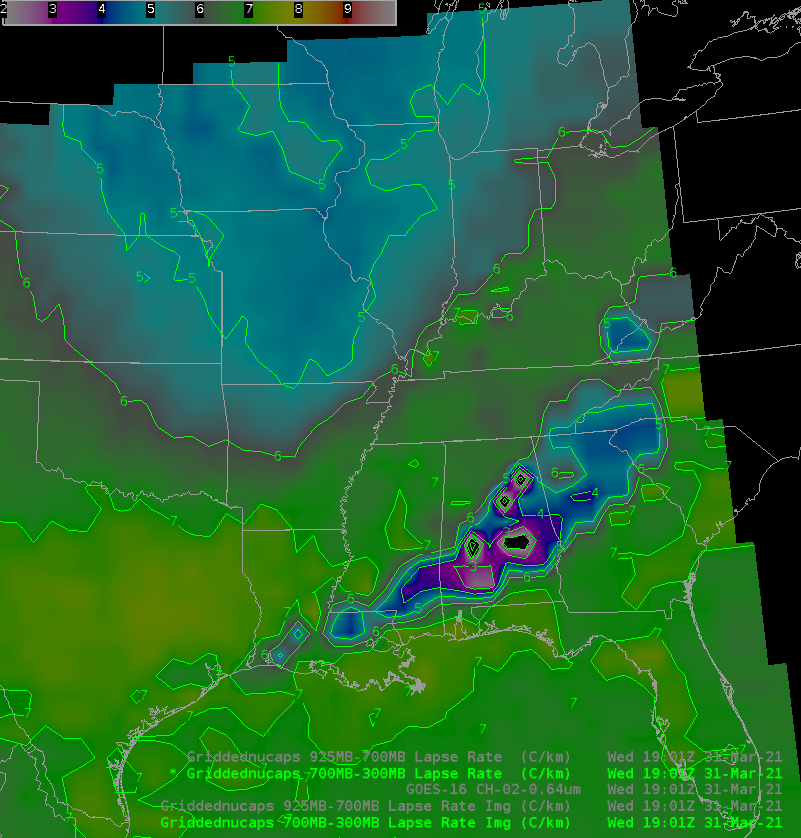
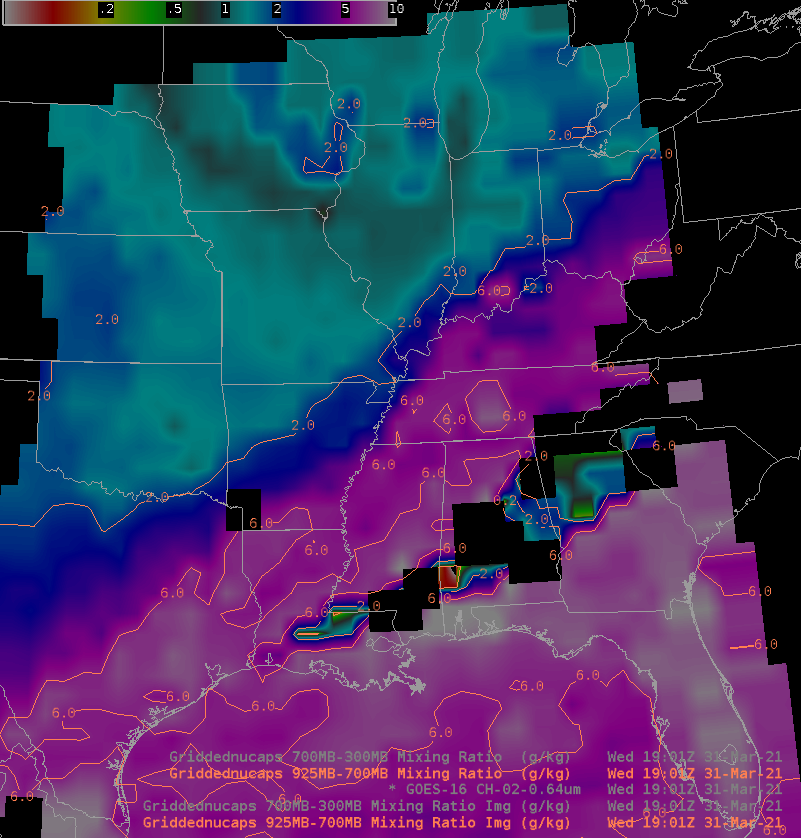
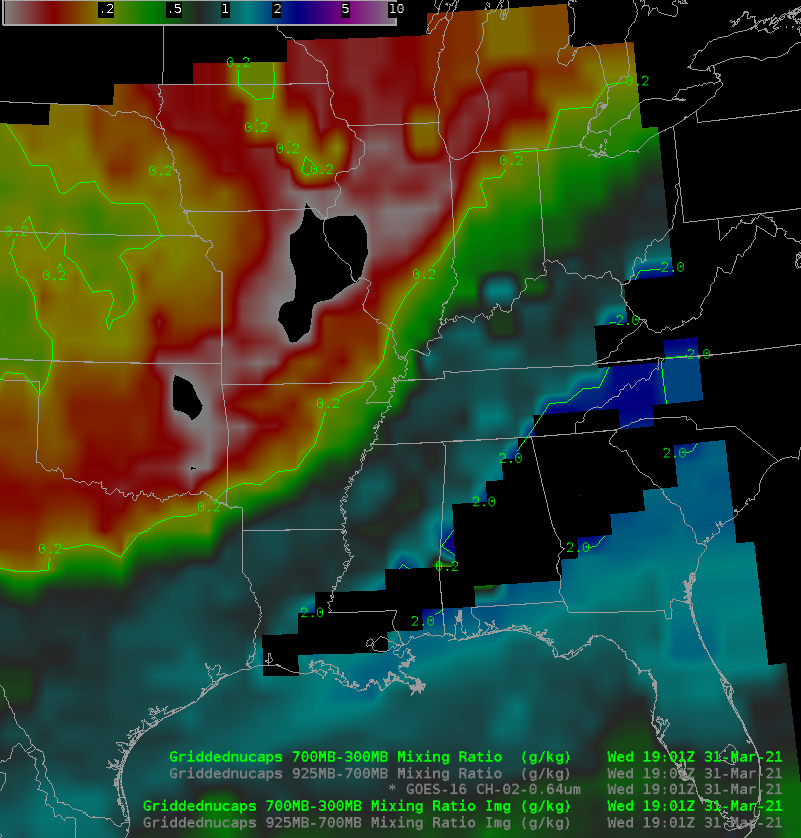
GOES-16 ABI Band 02 (0.64 µm) visible imagery, 1901 UTC, and NUCAPS estimates of Lapse Rate and Mixing Ratio at 925-700 mb, and 700-300 mb (Click to enlarge)
The animation above cycles through GOES-16 Visible Imagery (0.64 µm) at 1901 UTC as well as simultaneous observations (from NUCAPS) of Lapse Rates (925-700 mb and 700-300 mb) and Mixing Ratio (925-700 mb and 700-300 mb). Thermodynamic information from NUCAPS complements information about the atmosphere that can be inferred by the GOES-16 imagery.
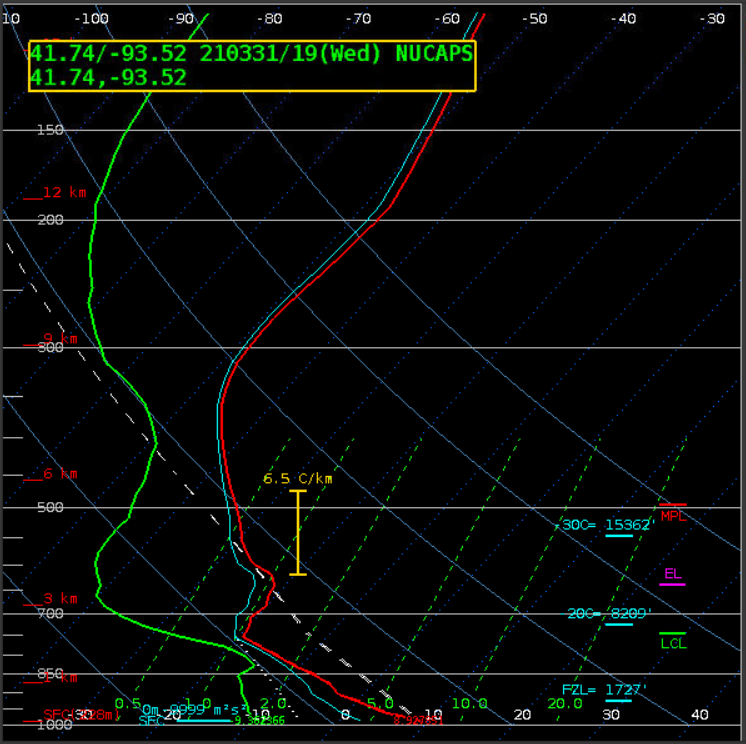
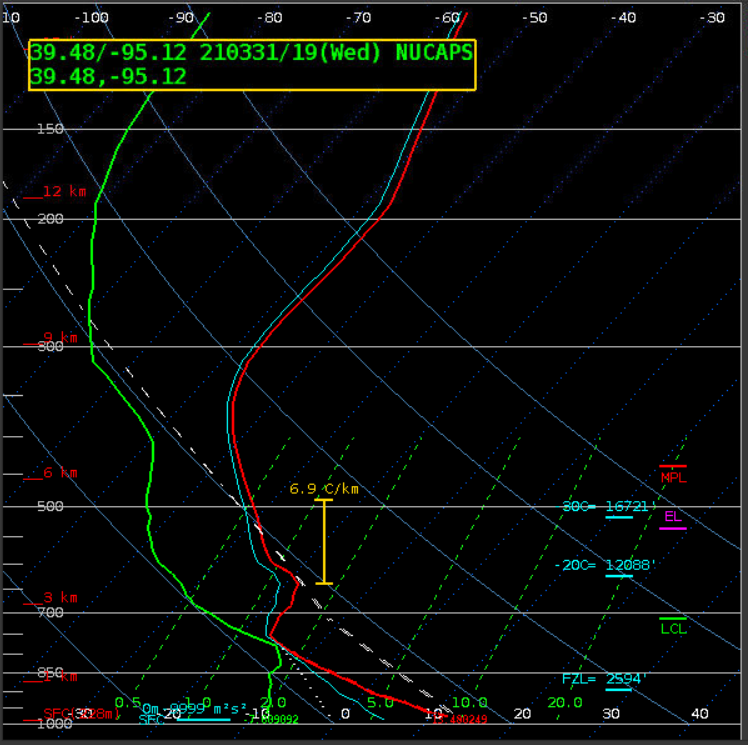
There are very strong low-level (925-700) lapse rates around Missouri behind the cold front that stretches over the south. The atmosphere there is also very dry. The smaller lapse rates at higher altitudes (700-300) also are in a region of very dry air. NUCAPS Soundings from Des Moines, Kansas City and St Louis show the inversion that exists between the steep low-level lapse rates and smaller upper-level lapse rates. There is a much smaller change in lapse rates over the southeastern United States, with small stability all through the troposphere.
NUCAPS thermodynamic fields also capture the relatively moist air within the cloud features in northeastern Iowa, with strong low-level lapse rates on either side of the cloud field there.
View only this post Read Less
![GOES-16 Shortwave Infrared images, with hourly surface wind barbs (cyan) and gusts (in knots, red); Interstate 90 is plotted in red [click to play animation | MP4]](https://cimss.ssec.wisc.edu/satellite-blog/images/2021/03/210329_goes16_shortwaveInfrared_winds_SD_fires_anim.gif)
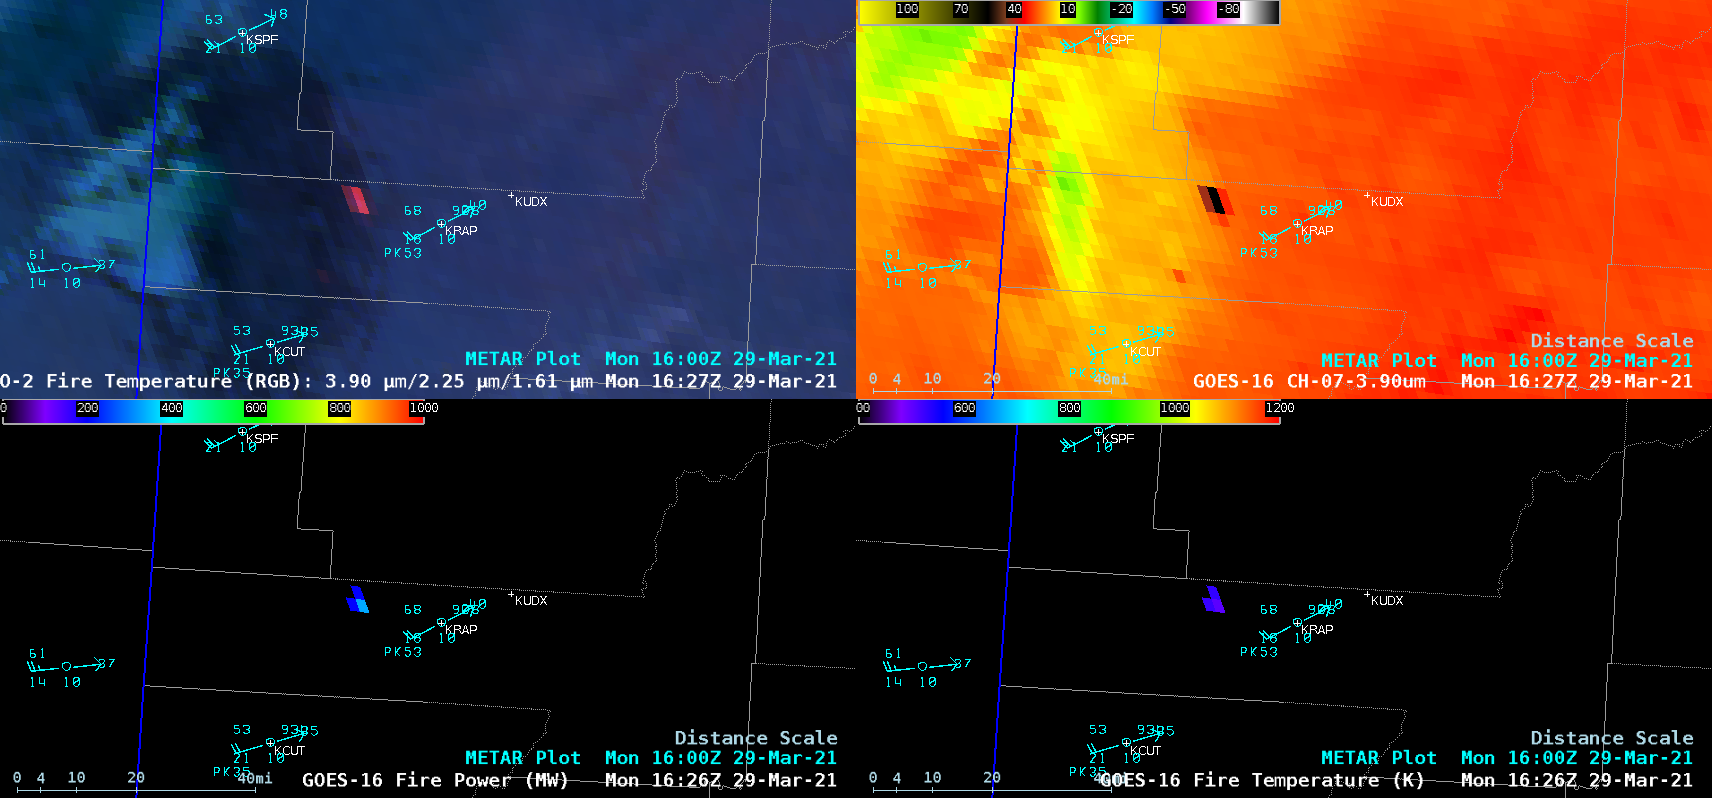
![GOES-16 Fire Temperature RGB (top left), Shortwave Infrared (top right), Fire Power (bottom left) and Fire Temperature (bottom right) [click to play animation | MP4]](https://cimss.ssec.wisc.edu/satellite-blog/images/2021/03/210329_goes16_4panel_Rapid_City_SD_fire_anim.gif)
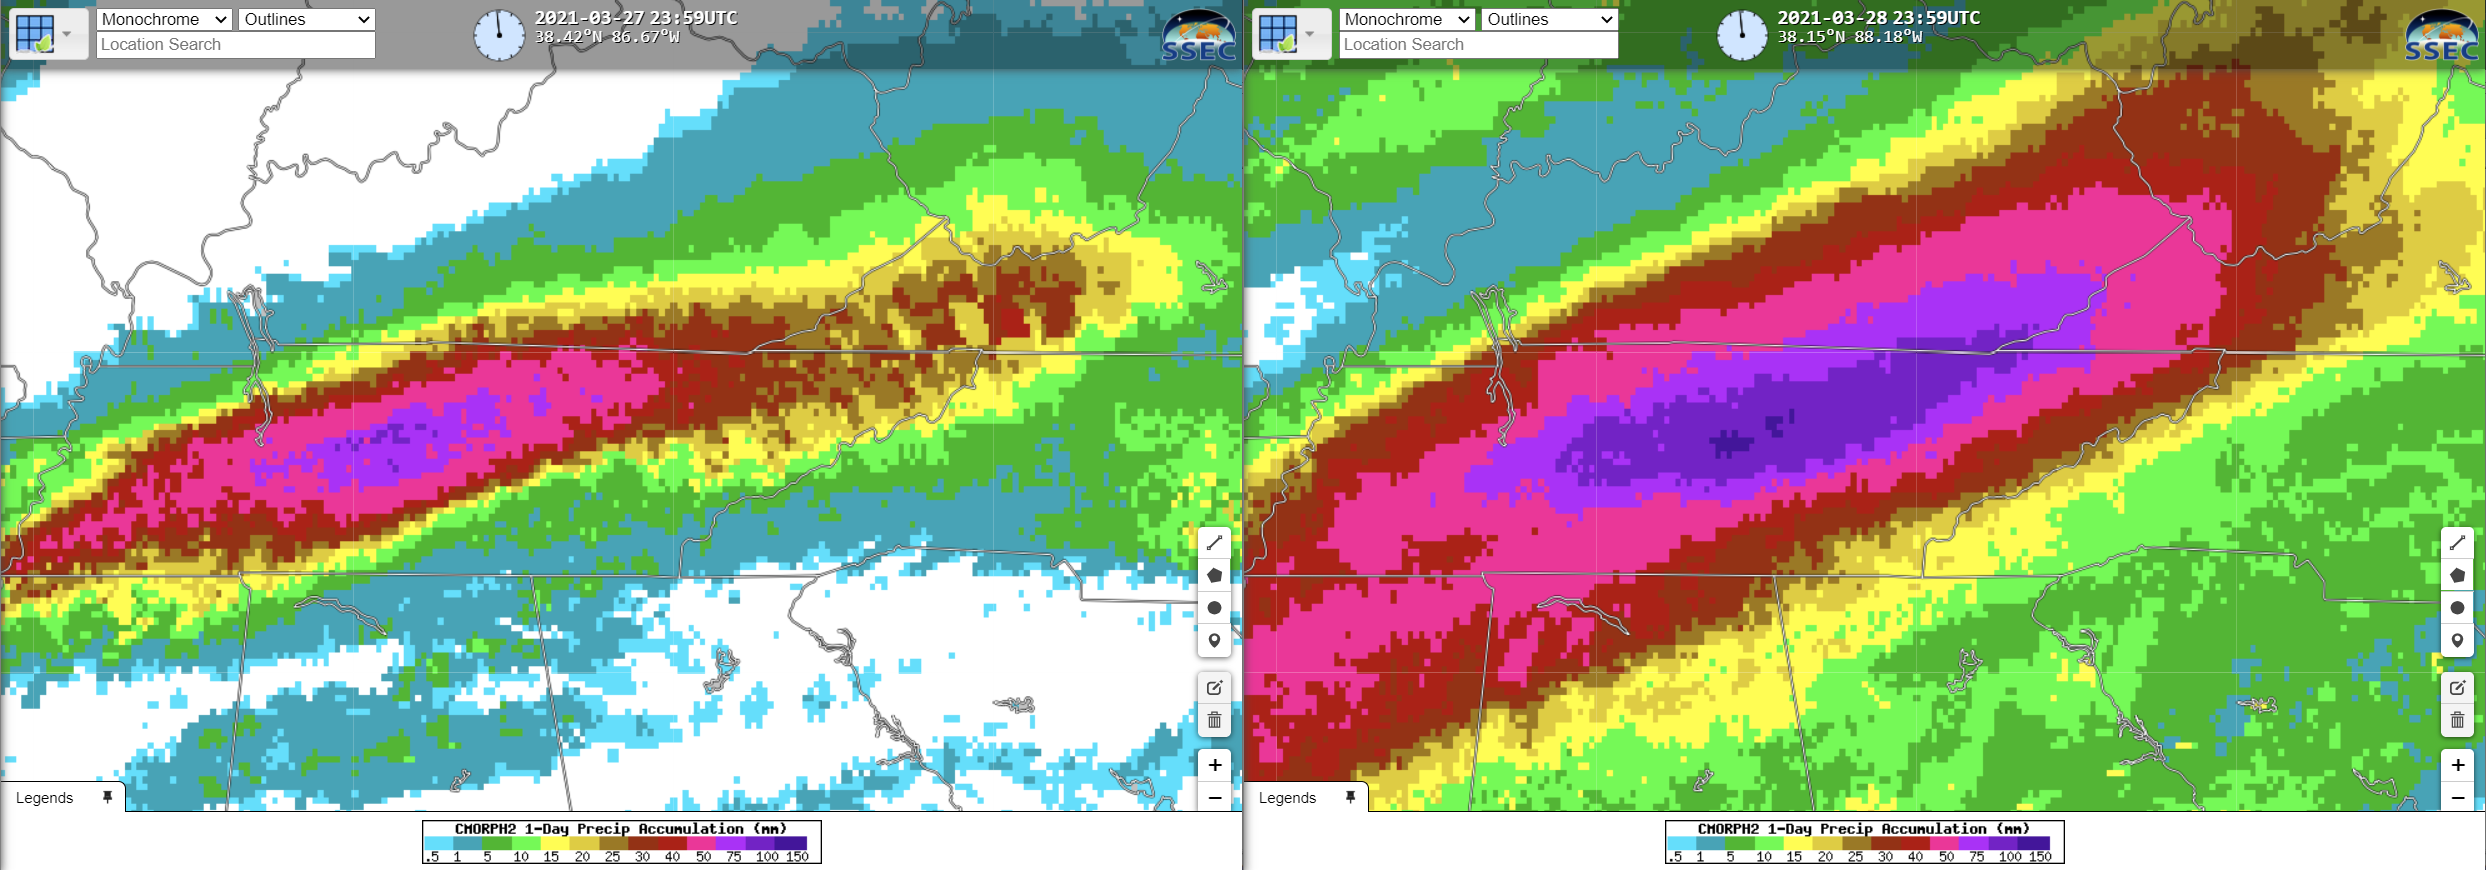
![GOES-16 “Clean” Infrared Window (10.35 µm) images, with hourly Precipitation Type plotted in cyan [click to play animation | MP4]](https://cimss.ssec.wisc.edu/satellite-blog/images/2021/03/210327_210328_goes16_infrared_TN_flooding_anim.gif)
![MIMIC TPW product [click to play animation | MP4]](https://cimss.ssec.wisc.edu/satellite-blog/images/2021/03/210327_210328_mimicTPW_anim.gif)
![Plots of rawinsonde data from 00 UTC and 12 UTC on 27 March [click to enlarge]](https://cimss.ssec.wisc.edu/satellite-blog/images/2021/03/210327_KBNA_RAOBS.GIF)
![Plots of rawinsonde data from 00 UTC and 12 UTC on 28 March [click to enlarge]](https://cimss.ssec.wisc.edu/satellite-blog/images/2021/03/210328_KBNA_RAOBS.GIF)
