![GOES-16 “Red” Visible (0.64 µm) images and “Clean” Infrared Window (10.35 µm) images, with plots of SPC Storm Reports [click to play animation | MP4]](https://cimss.ssec.wisc.edu/satellite-blog/images/2021/04/210428_goes16_visible_infrared_spcStormReports_TX_anim.gif)
GOES-16 “Red” Visible (0.64 µm) images (top) and “Clean” Infrared Window (10.35 µm) images (bottom), with plots of SPC Storm Reports [click to play animation | MP4]
The NWS and @disastersafety surveyed a giant hailstone that fell in Hondo, TX on April 28th, measuring 6.4″ in diameter! The measurement will be presented to a State Climate Extreme Committee, who will be tasked to verify and determine what, if any, records were broken. pic.twitter.com/MPujiIXJBv
— NWS Austin/San Antonio (@NWSSanAntonio) May 7, 2021
Vigorous overshooting tops were seen in both the Visible and Infrared GOES-16 images, with the coldest IR brightness temperatures in the -80 to -89ºC range (shades of violet to purple) — and along the southern flank of the storms, inflow feeder bands were evident the Visible imagery. 00 UTC rawinsonde data from Del Rio, Texas (below) showed that parcel temperatures of -80 to -89ºC would indicate significant vertical overshoots of both the equilibrium level (-67ºC) and the tropopause (-74.7ºC).
![Plot of rawinsonde data from Del Rio, Texas [click to enlarge]](https://cimss.ssec.wisc.edu/satellite-blog/images/2021/04/210429_00utc_kdrt_raob.png)
Plot of rawinsonde data from Del Rio, Texas [click to enlarge]
![GOES-16 “Clean” Infrared Window (10.35 µm) images, with SPC Storm Reports plotted in cyan [click to play animation | MP4]](https://cimss.ssec.wisc.edu/satellite-blog/images/2021/04/210428_goes16_infrared_spcStormReports_N_TX_anim.gif)
GOES-16 “Clean” Infrared Window (10.35 µm) images, with SPC Storm Reports plotted in cyan [click to play animation | MP4]
View only this post Read Less

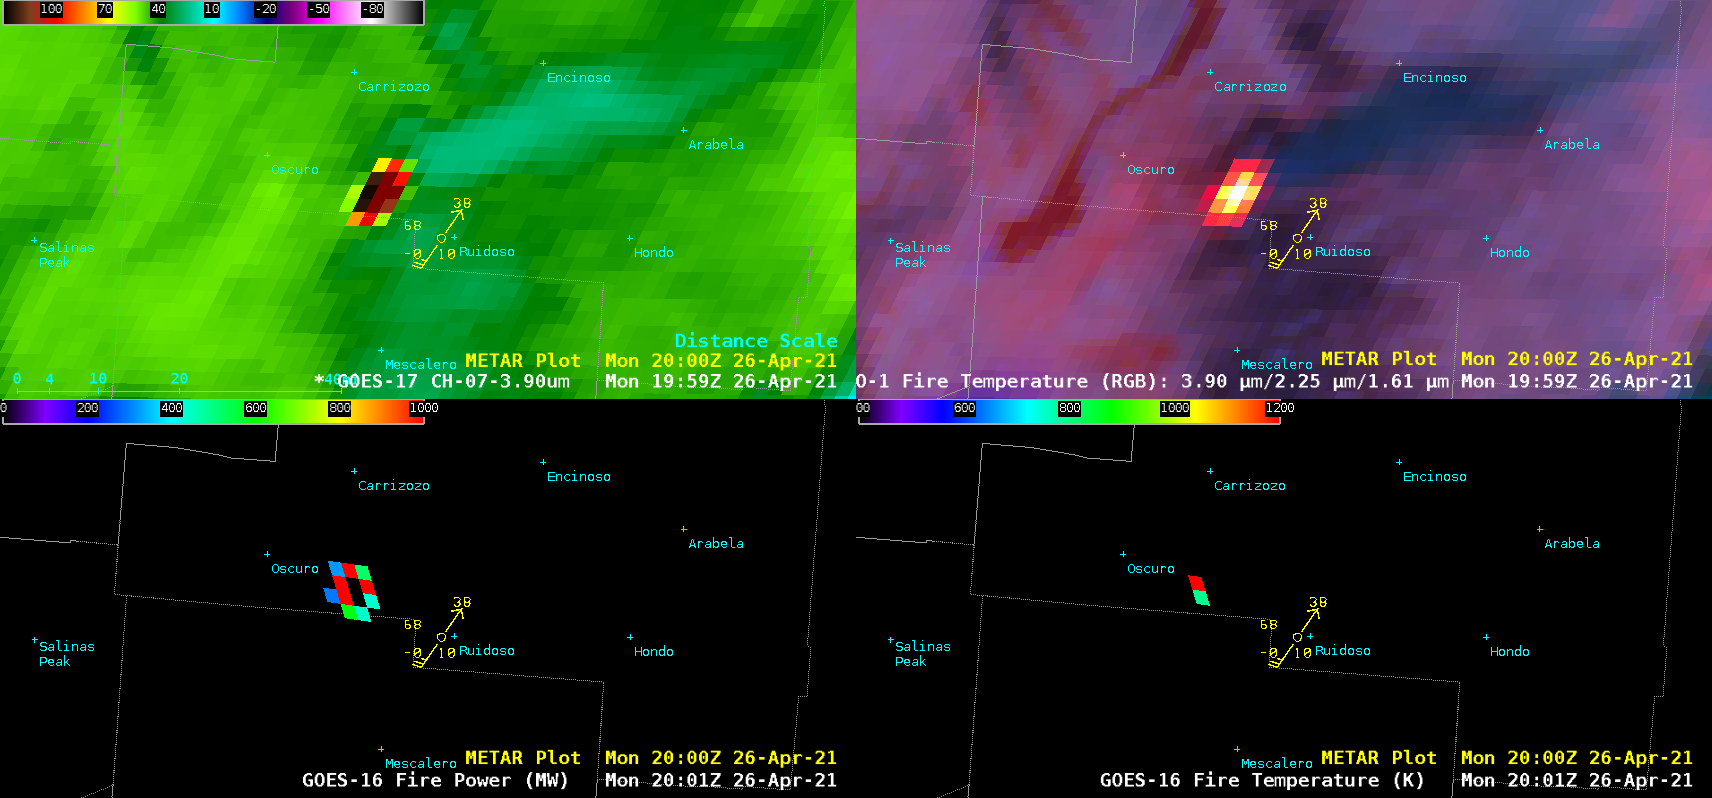
![GOES-17 Shortwave Infrared (3.9 µm) (top left), GOES-17 Fire Temperature RGB (top right), GOES-16 Fire Power (bottom left) and GOES-16 Fire Temperature (bottom right) [click to play animation | MP4]](https://cimss.ssec.wisc.edu/satellite-blog/images/2021/04/210426_goes17_shortwaveInfrared_fireTemperatureRGB_goes16_firePower_fireTemperature_Three_Rivers_Fire_NM_anim.gif)
![GOES-16 True Color RGB images [click to play animation | MP4]](https://cimss.ssec.wisc.edu/satellite-blog/images/2021/04/210426_goes16_trueColorRGB_NM_fire_anim.gif)
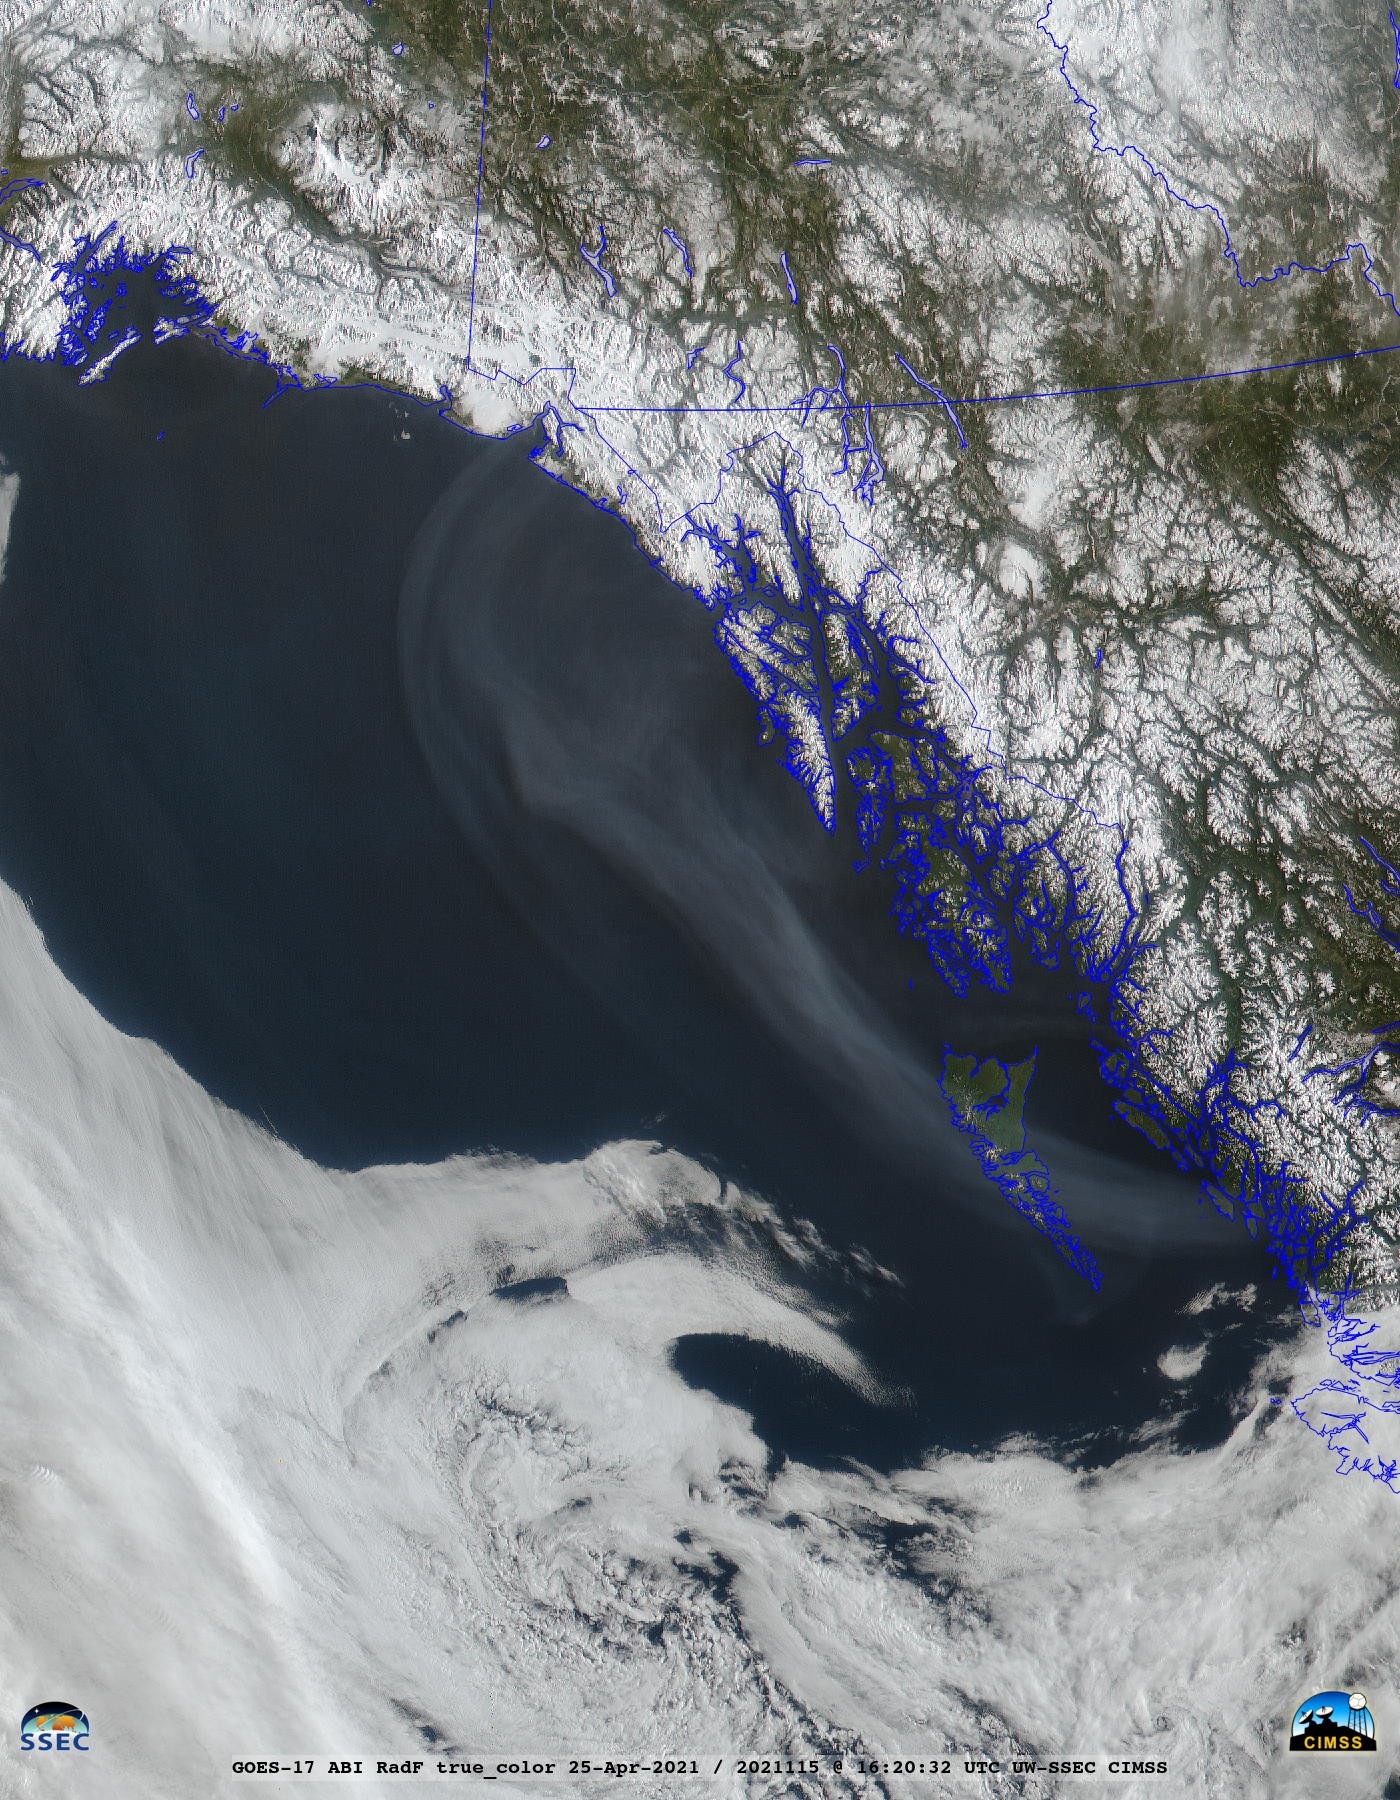
![GOES-17 CIMSS Natural Color RGB images [click to play animation | MP4]](https://cimss.ssec.wisc.edu/satellite-blog/images/2021/04/210425_goes17_cimssNaturalColorRGB_AK_anim.gif)
![GOES-17 Near-Infrared "Cirrus" (1.37 µm) images [click to play animation | MP4]](https://cimss.ssec.wisc.edu/satellite-blog/images/2021/04/210425_goes17_nearInfraredCirrus_AK_anim.gif)
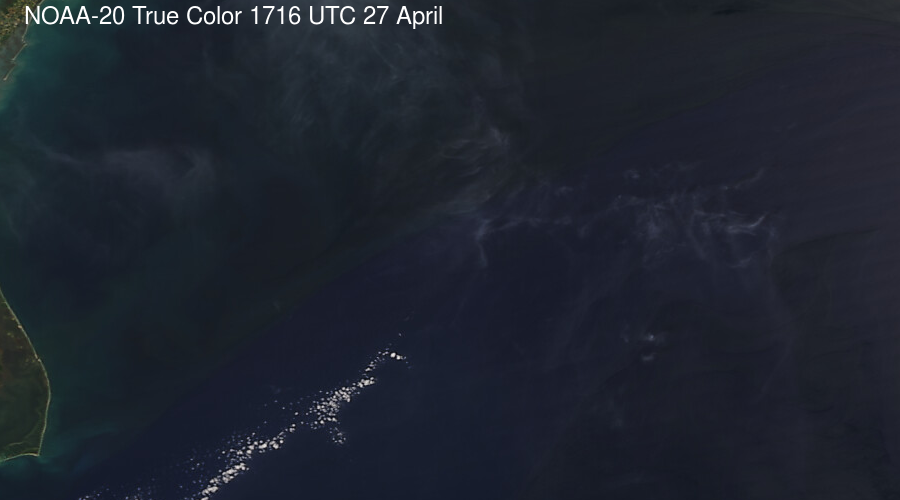
![GOES-17 True Color RGB images [click to play animation | MP4]](https://cimss.ssec.wisc.edu/satellite-blog/images/2021/04/210425_goes17_trueColorRGB_AK_anim.gif)
![Suomi NPP VIIRS Day/Night Band (0.7 µm) image [click to enlarge]](https://cimss.ssec.wisc.edu/satellite-blog/images/2021/04/ak_dnb-20210425_122142.png)
