The NOAA/CIMSS ProbSevere portfolio contains AI models for nowcasting convective weather. I’ll use Monday’s severe weather over the Southern Plains to highlight several of them.A strong cold front spawned numerous severe-hail, wind, and tornado producing storms over Texas and Oklahoma, aided by very large values of convective available potential energy... Read More
The NOAA/CIMSS ProbSevere portfolio contains AI models for nowcasting convective weather. I’ll use Monday’s severe weather over the Southern Plains to highlight several of them.
A strong cold front spawned numerous severe-hail, wind, and tornado producing storms over Texas and Oklahoma, aided by very large values of convective available potential energy (CAPE; > 4000 J/kg). You can see numerous storm reports in Figure 1.
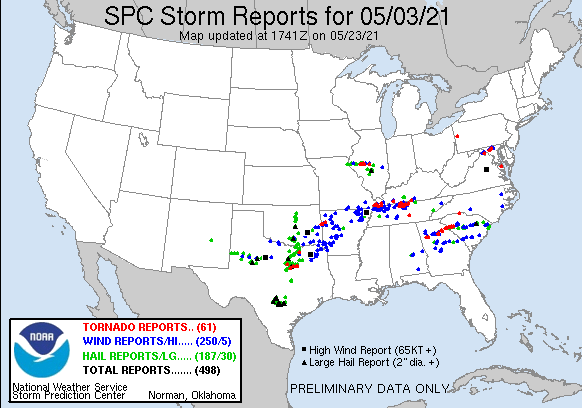
Storm Prediction Center’s preliminary severe storm reports for May 3rd, 2021.
Probsevere version 2 (PSv2) is an operational set of models at NOAA, which predict the probability of severe hail, severe wind, and tornadoes, in the next 60 minutes. The models are storm-centric, and the models’ domain is the entire contiguous United States (CONUS). These models use MRMS (radar), GOES (satellite), short-term NWP, and terrestrial-based lightning observations to generate probabilistic guidance of severe hazards. Figure 2 shows output from an experimental version (PSv3), which includes additional MRMS, GOES, and NWP fields as predictors in a machine learning model.
Figure 2: ProbSevere v3 contours (colored, around storms), MRMS MergedReflectivity, and NWS severe weather warnings (yellow and red boxes) for storms over the Southern Plains. The second outer contour around some storms is colored by the probability of tornado.
Another ProbSevere product is a convolutional neural network that uses GOES-R ABI and GLM images to detect regions of intense convection, and is often correlated with strong overshooting tops, “bubbly-like” texture in visible imagery, strong lightning cores, and the cold-U/above-anvil cirrus plume signature. The intense convection probability (ICP) can be run on the 1-minute mesoscale scans as well as 5-minute CONUS sector scans aboard the GOES satellites. The ICP does not require radar data, and may also be able to operate on data from satellites with similar intruments (e.g., Meteosat Third Generation). ICP output is being used as a predictor in the experimental ProbSevere v3.
Predicting when and where lightning will occur is also important for many users, such as mariners, aviators, and outdoor event managers. The probability of lightning model (PLTG) is also a convolutional neural network, using images of visible, near-infrared, and longwave-infrared channels to nowcast lightning occurrence in the next 60 minutes. The purple-to-orange shaded regions in the video below show GLM flash-extent density (i.e., flashes passing through a location).
View only this post
Read Less
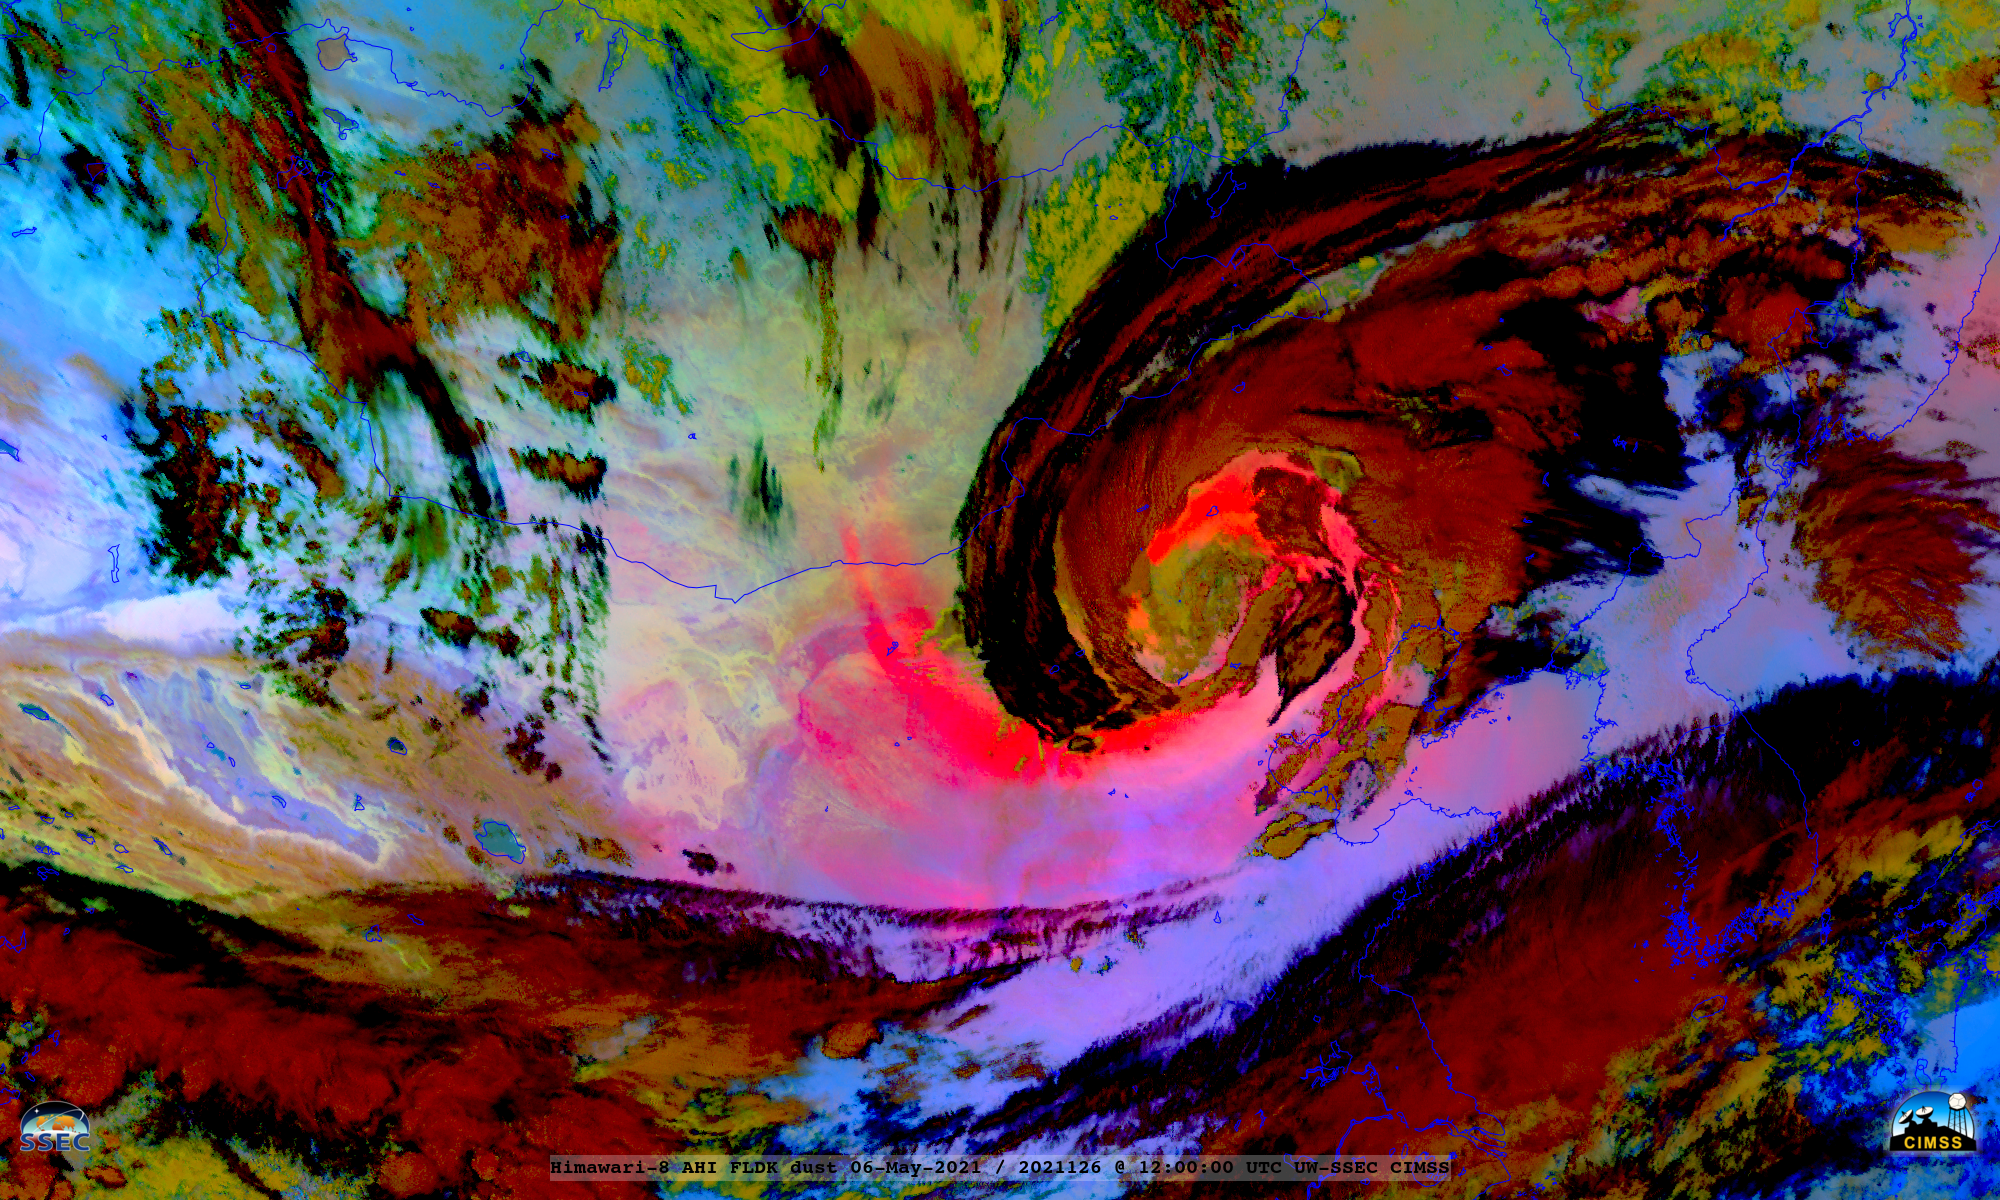
![Himawari-8 Dust RGB images [click to play animation | MP4]](https://cimss.ssec.wisc.edu/satellite-blog/images/2021/05/210504_210506_himawari8_dustRGB_Mongolia_blowing_dust_anim.gif)
![Surface analyses during the period from 21 UTC on 0 May to 21 UTC on 06 May [click to enlarge | MP4]](https://cimss.ssec.wisc.edu/satellite-blog/images/2021/05/210504_210506_Asia_surface_analyses_anim.gif)
![VIIRS True Color RGB mages from Suomi NPP and NOAA-20 [click to enlarge]](https://cimss.ssec.wisc.edu/satellite-blog/images/2021/05/210506_0026utc_noaa20_viirs_trueColorRGB_Mongolia_China_blowing_dust_anim.gif)
![GOES-16 “Red” Visible (0.64 µm) images, with SPC Storm Reports plotted in red [click to play animation | MP4]](https://cimss.ssec.wisc.edu/satellite-blog/images/2021/05/210504_goes16_visble_spcStormReports_Deep_South_anim.gif)
![GOES-16 “Clean” Infrared Window (10.35 µm) images, with SPC Storm Reports plotted in cyan [click to play animation | MP4]](https://cimss.ssec.wisc.edu/satellite-blog/images/2021/05/210504_goes16_infrared_spcStormReports_Deep_South_anim.gif)
![GOES-16 “Red” Visible (0.64 µm) images, with SPC Storm Reports plotted in red [click to play animation | MP4]](https://cimss.ssec.wisc.edu/satellite-blog/images/2021/05/210504_goes16_visible_spcStormReports_Southeast_US_anim.gif)
![GOES-16 “Clean” Infrared Window (10.35 µm) images, with SPC Storm Reports plotted in cyan [click to play animation | MP4]](https://cimss.ssec.wisc.edu/satellite-blog/images/2021/05/210504_goes16_infrared_spcStormReports_Southeast_US_anim.gif)

![GOES-16 True Color RGB images [click to play animation | MP4]](https://cimss.ssec.wisc.edu/satellite-blog/images/2021/05/210502_goes16_trueColorRGB_CO_anim.gif)
