Mount Sinabung eruption in Indonesia
![Himawari-8 True Color RGB images [click to play animation | MP4]](https://cimss.ssec.wisc.edu/satellite-blog/images/2020/08/200810_himawari8_trueColorRGB_Sinabung_anim.gif)
Himawari-8 True Color RGB images [click to play animation | MP4]
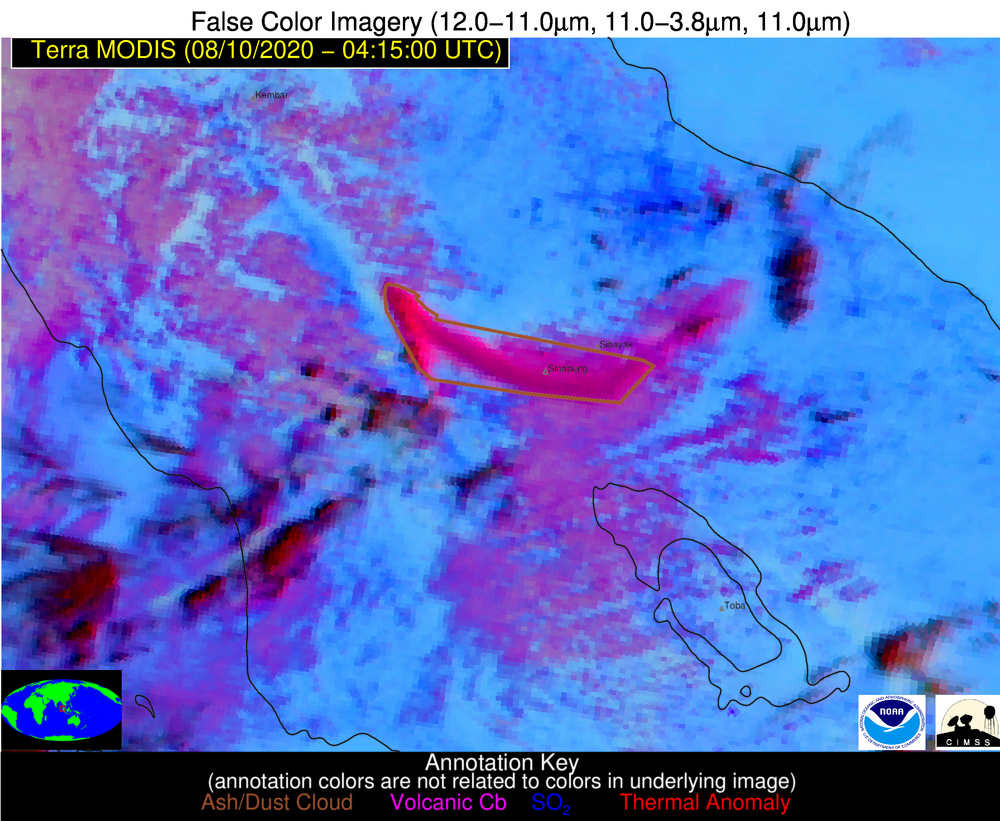
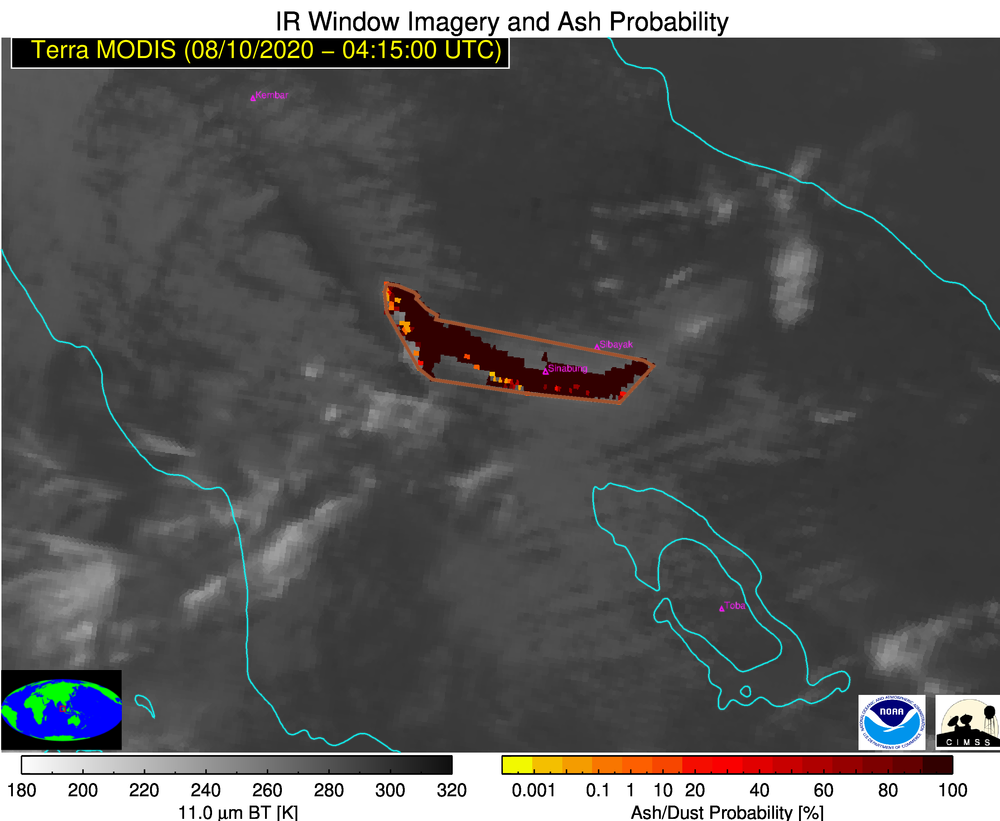
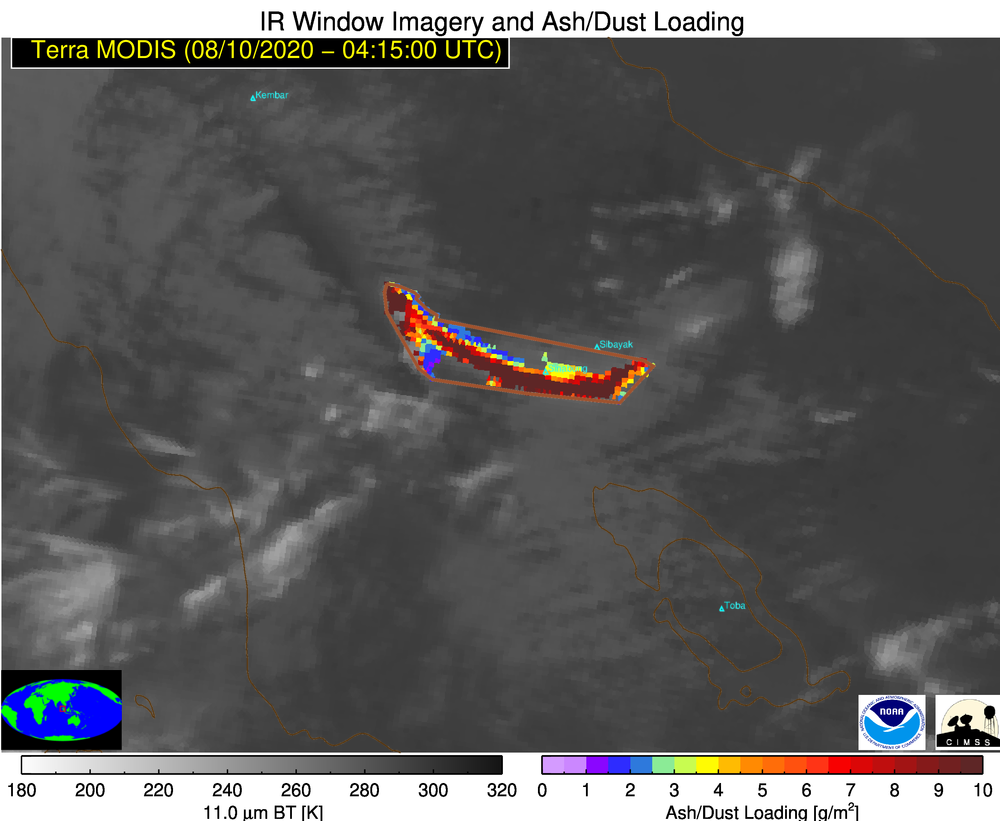
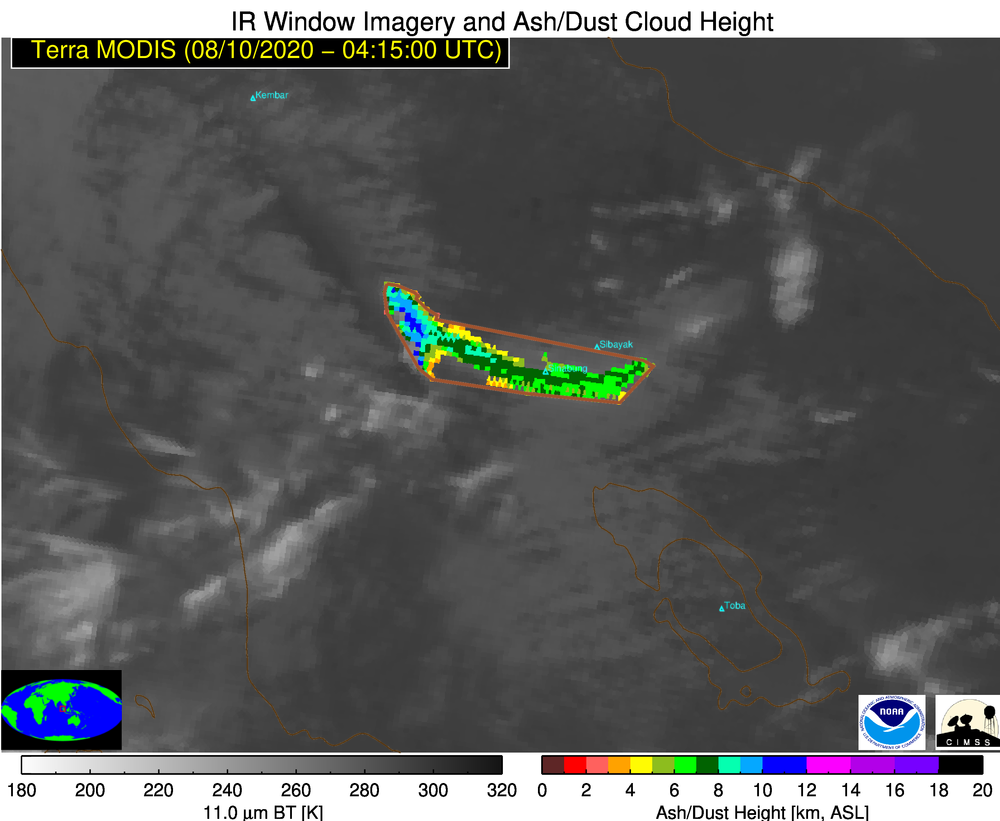
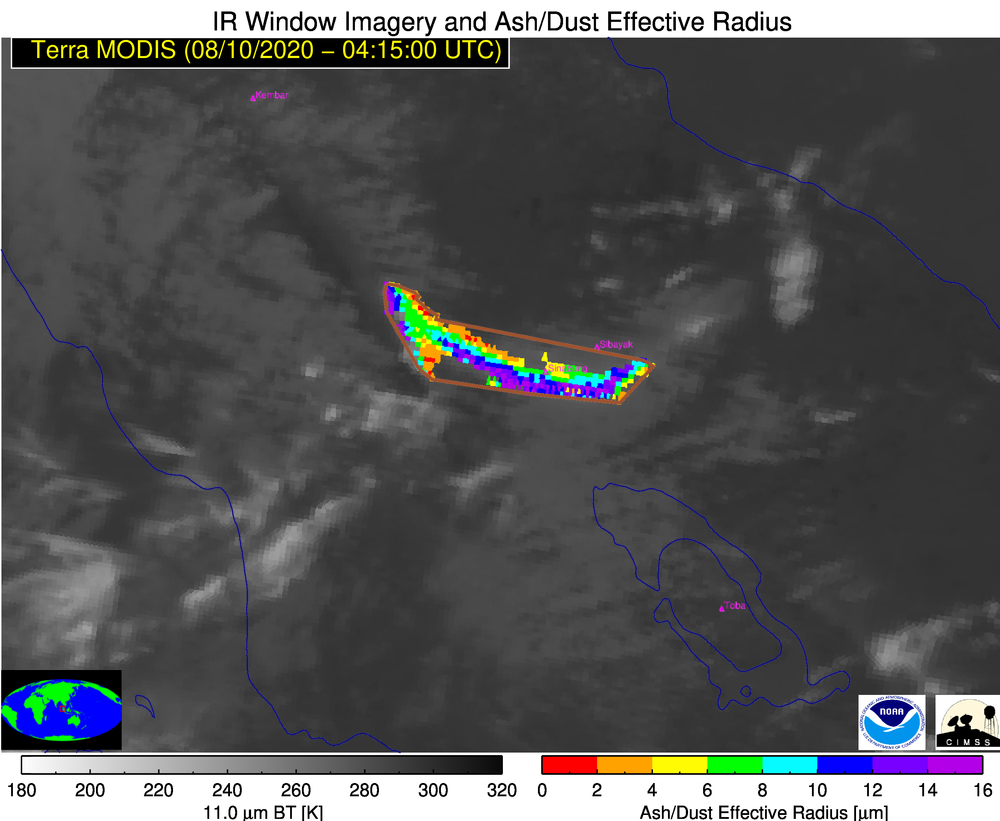
A sequence of Terra MODIS False Color RGB, Ash Probability, Ash Loading, Ash Height and Ash Effective Radius products from the NOAA/CIMSS Volcanic Cloud Monitoring site (below) showed various characteristics of the ash plume at 0415 UTC.
![Terra MODIS False Color RGB, Ash Probability, Ash Loading, Ash Height and Ash Effective Radius [click to enlarge]](https://cimss.ssec.wisc.edu/satellite-blog/images/2020/08/200810_0415utc_terra_modis_falseColorRGB_ashProbabilty_ashLoading_ashHeight_ashEffectiveRadius_Sinabung_anim.gif)
Terra MODIS False Color RGB, Ash Probability, Ash Loading, Ash Height and Ash Effective Radius [click to enlarge]
![Plot of 00 UTC rawinsonde data from Medan, Indonesia [click to enlarge]](https://cimss.ssec.wisc.edu/satellite-blog/images/2020/08/200810_00UTC_WIMM_RAOB.GIF)
Plot of 00 UTC rawinsonde data from Medan, Indonesia [click to enlarge]