
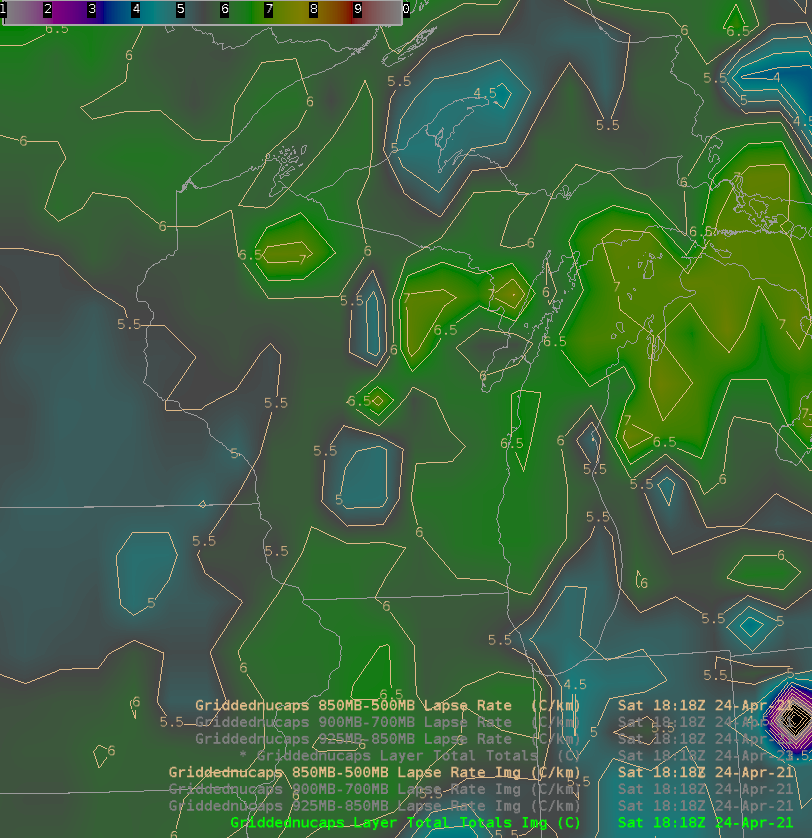
NUCAPS-derived lapse rates over the upper Midwest at 181 UTC on 24 April 2021; 925-850 mb, 900-700 mb, 850-500 mb (Click to enlarge)
April showers developed over the upper Midwest on the afternoon of 24 April 2021. The toggle above shows atmospheric lapse rates (as derived from NUCAPS Sounding observations) at 1818 UTC in 3 different layers: 925-850 mb, 900-700 mb, and 850-500 mb. A very tight gradient in low-level lapse rates exists southwest-to-northeast over Wisconsin. How do the cloud patterns change in that region? Can you use NUCAPS Lapse Rate distributions to anticipate when and where convection might develop?
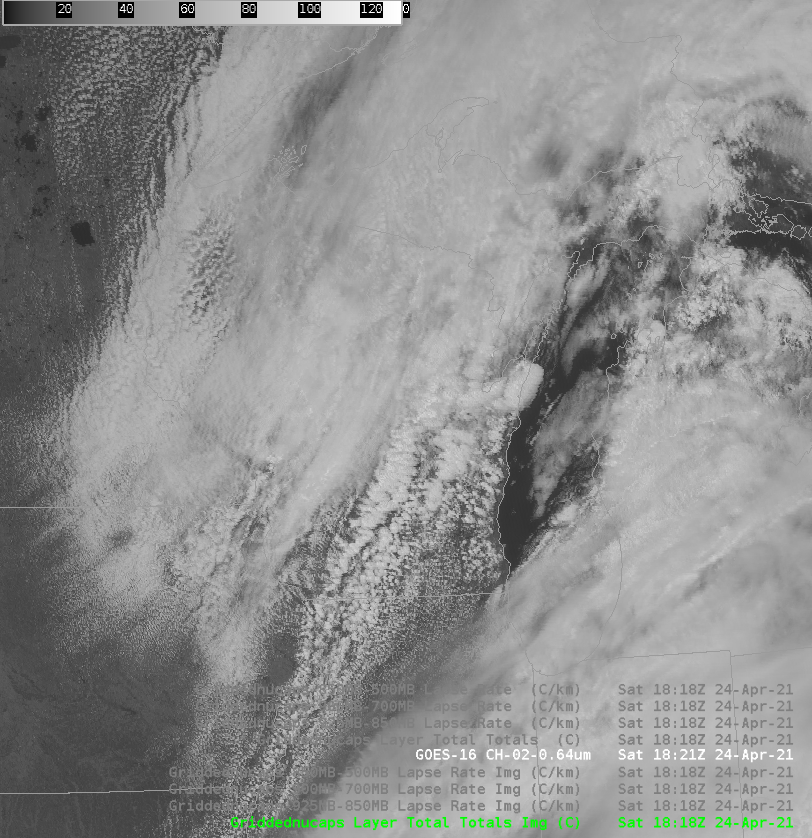
The toggle below shows the visible imagery and the 925-850 mb lapse rate. The character of the clouds in the visible imagery (0.64 µm) west of the strong lapse rate gradient over southwestern Wisconsin is much different from the more cumuliform clouds over south-central and southeast Wisconsin.

GOES-16 ABI Band 2 Visible (0.64 µm) and NUCAPS low-level (925-850 mb) lapse rates, 1818 UTC on 24 April 2021 (click to enlarge)
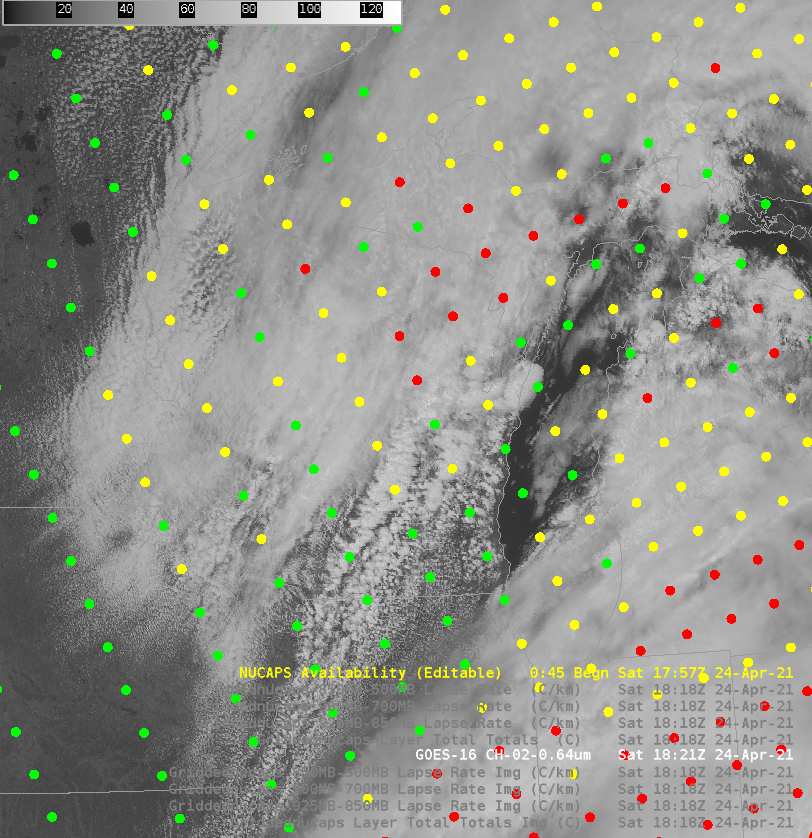
When using gridded NUCAPS fields, it’s important to know what kind of data are used. That is: was the NUCAPS retrieval successful? The toggle below shows the NUCAPS Sounding Availability points from AWIPS overlain on top of the visible imagery: Green Dots show where the infrared retrieval converged to a solution; yellow dots show regions where the infrared retrieval did not converge — but the microwave retrieval did; red dots show where neither the infrared nor microwave retrievals converged. There are many ‘green’ sounding points over Wisconsin in the region of the strong horizontal gradient in lapse rates.

GOES-16 ABI Band 2 Visible (0.64 µm) and NUCAPS Sounding Availability Points, 1818 UTC on 24 April 2021 (click to enlarge)
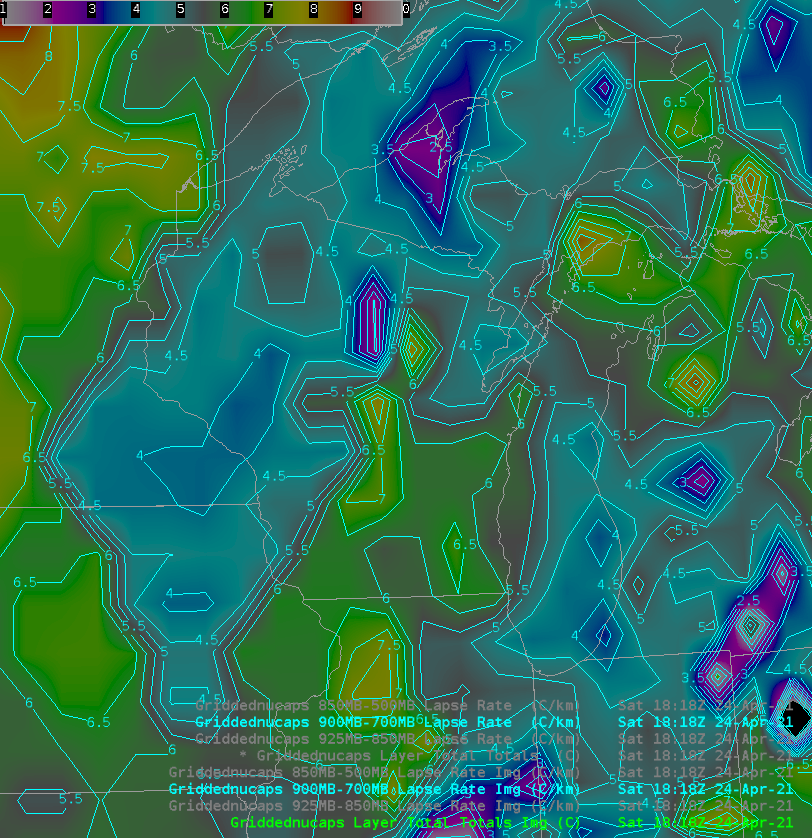
One can also view stability fields such as Total Totals index, shown below, in a toggle with the low-level lapse rates. Note that a pronounced gradient in the Total Totals index is not apparent. A user who wants to find a gradient along which convection might develop should look at more than one field (or level). It’s useful to create 4-panels in AWIPS and develop AWIPS Procedures to load and display the imagery.

Gridded Total Totals index and gridded 925-850 mb lapse rates, 1818 UTC on 24 April 2021 (Click to enlarge)
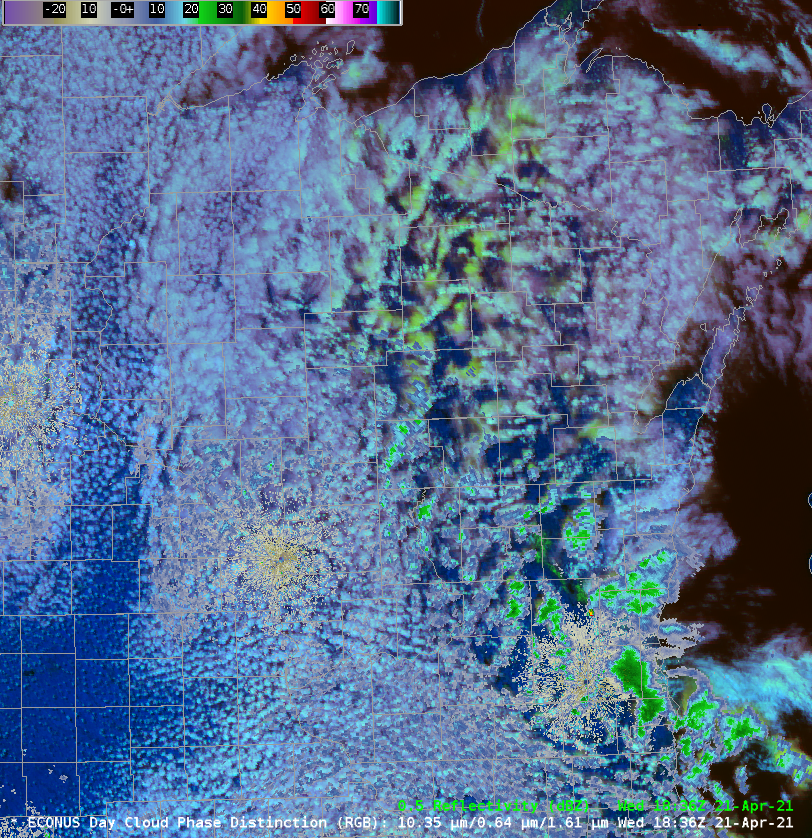
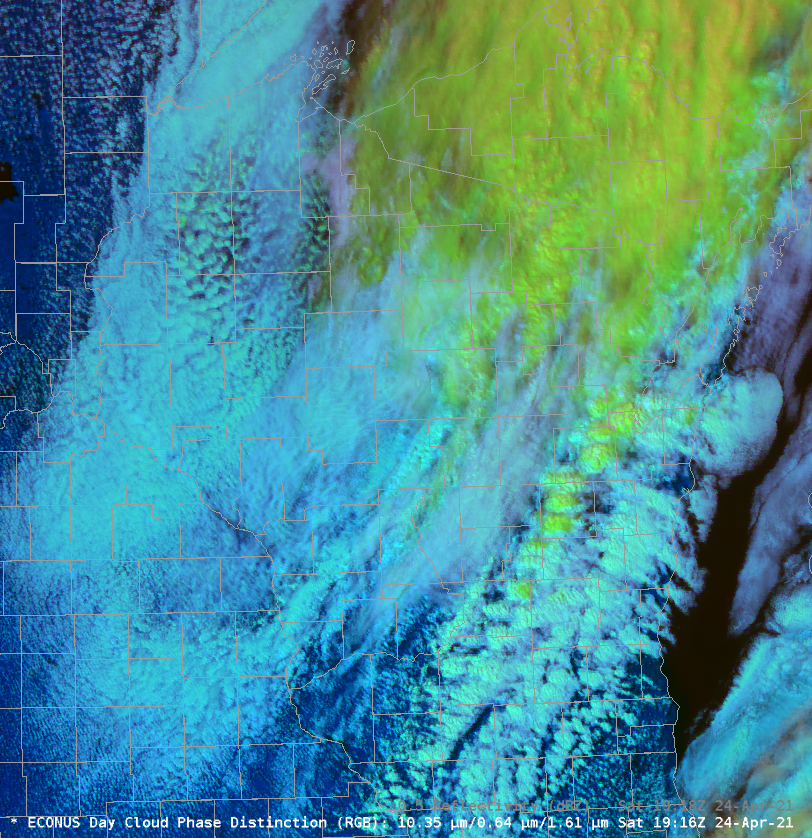
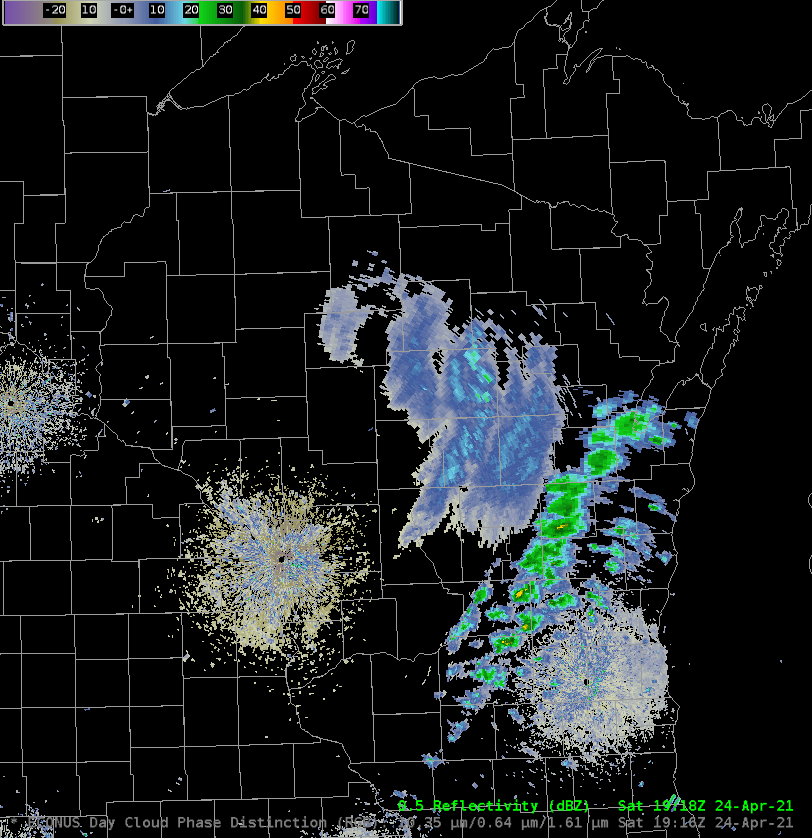
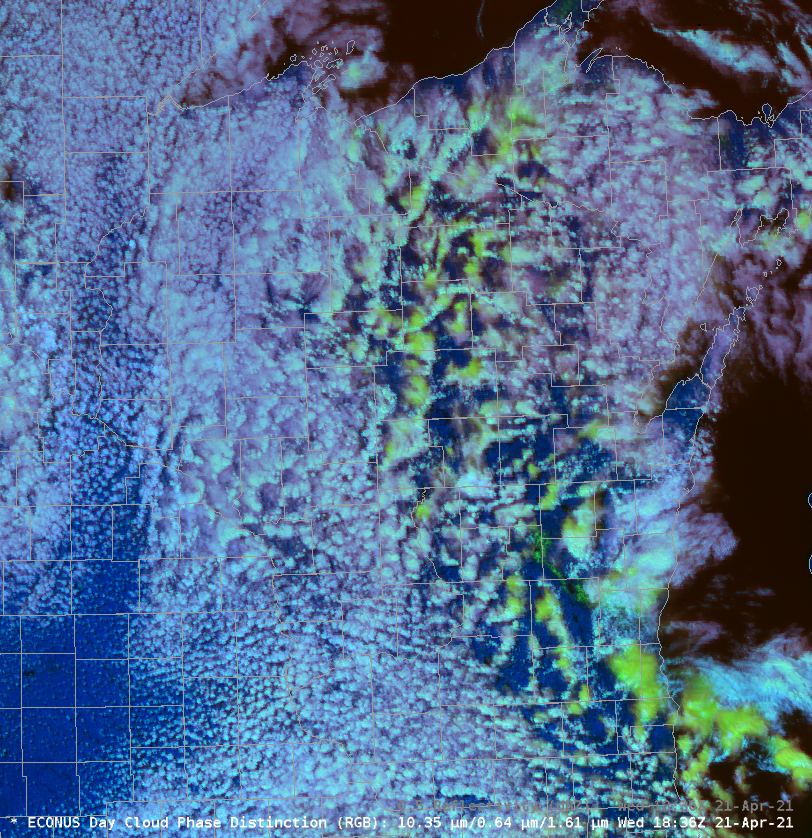
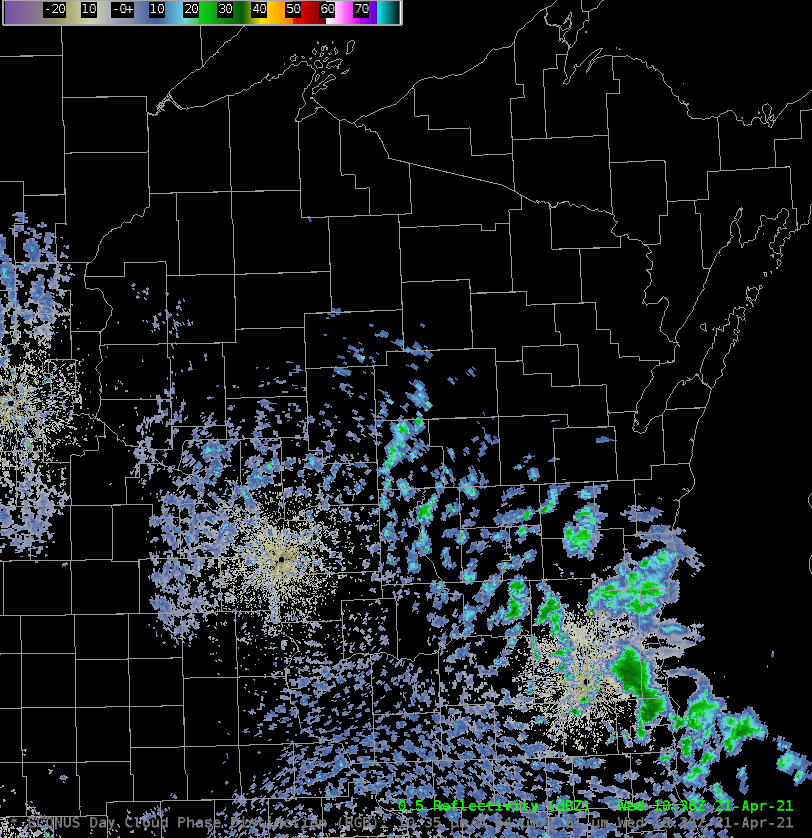
The Day Cloud Phase Distinction RGB stood in nicely for radar imagery in the region where showers developed (this also happened on 21 April, as discussed in this blog post). The toggle below cycles through the Day Cloud Phase Distinction with and without radar overlain, and also shows the radar data alone. Rain showers are occurring where the Day Cloud Phase Distinction RGB has a chartreuse/yellow hue. In regions with more wide-spread cirrus clouds (over the Upper Peninsula of Michigan for example), the relationship between chartreuse/yellow and showery precipitation is less noticeable.

GOES-16 Day Cloud Phase Distinction RGB with and without radar data overlain, 1916 UTC on 24 April 2021 (click to enlarge)
Visible (1636-2131 UTC on 24 April) and Day Cloud Phase Distinction (1651 – 2146 UTC) animations can be viewed here (visible) and here (Day Cloud Phase Distinction)
The alert reader will notice above that the time stamp of the gridded NUCAPS fields (1818 UTC) differs from the timestamp of the NUCAPS Sounding Availability points (1757 UTC). Why is that the case for this ascending NOAA-20 overpass? Satellite imagery is typically timestamped with the first line of data in the image. That’s usually around 40 S Latitude for Sounding Availability plots in NUCAPS. The gridded fields, however, use smaller portions of the NOAA-20 orbit. The gridded fields shown on this day started at about 30 N Latitude; it took NOAA-20 about 20 minutes to move from 40 S to 30 N!
View only this post Read Less
![US Space Force EWS-G1 Infrared (10.7 µm) images [click to play animation | MP4]](https://cimss.ssec.wisc.edu/satellite-blog/images/2021/04/210422_210424_ewsG1_Infrared_Jobo_anim.gif)
![VIIRS Infrared Window (11.45 µm) images from NOAA-20 and Suomi NPP [click to enlarge]](https://cimss.ssec.wisc.edu/satellite-blog/images/2021/04/210422_210424_noaa20_suomiNPP_infrared_Jobo_anim.gif)

