This website works best with a newer web browser such as Chrome, Firefox, Safari or Microsoft
Edge. Internet Explorer is not supported by this website.
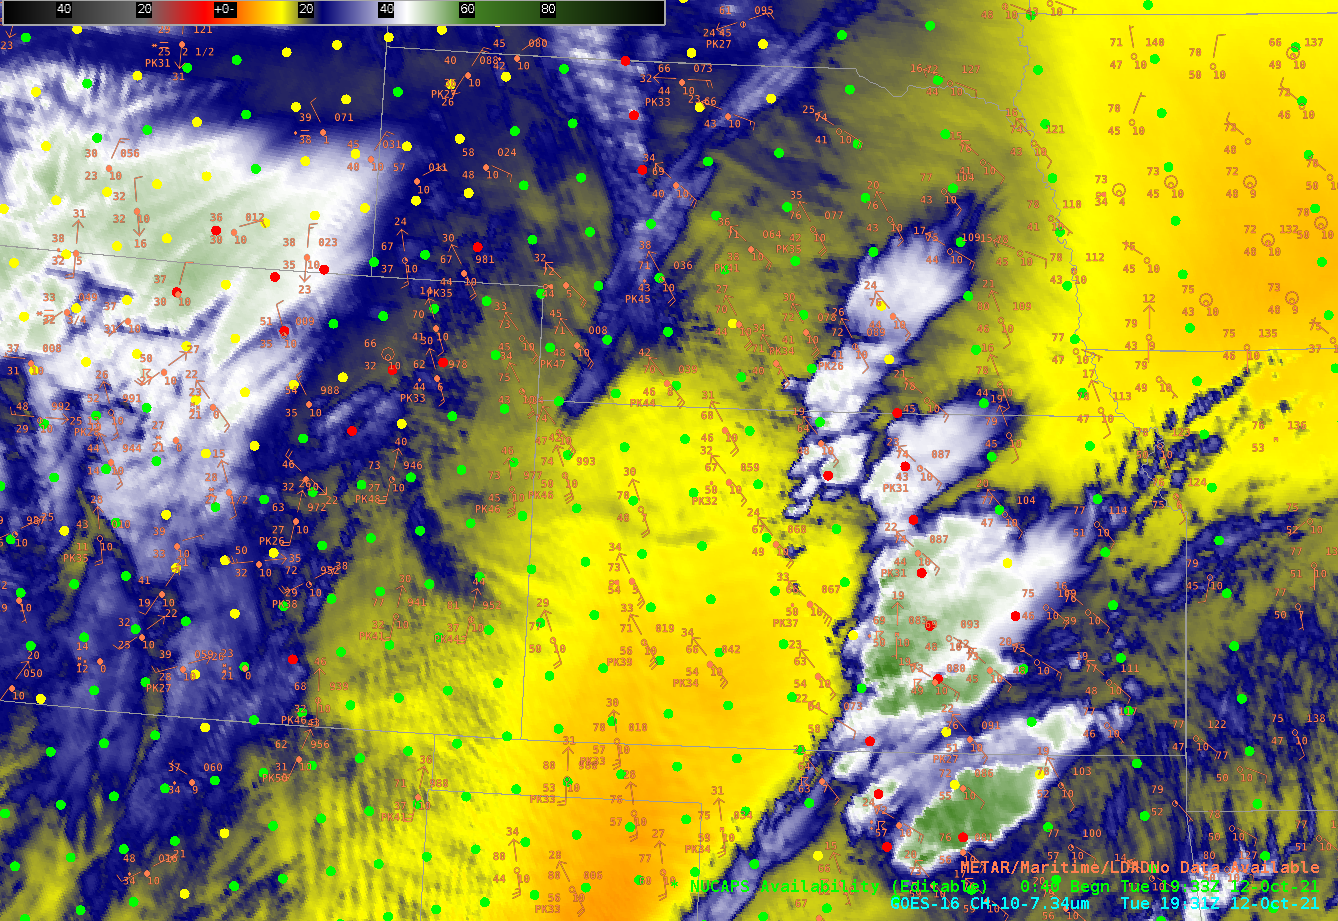
GOES-16 Low-Level water vapor infrared imagery (Band 10, 7.34 µm) at 1931 UTC on 12 October 2021 (Click to enlarge). NOAA-20 NUCAPS Sounding Availability points are indicated as colored dots. METAR plots are also included.
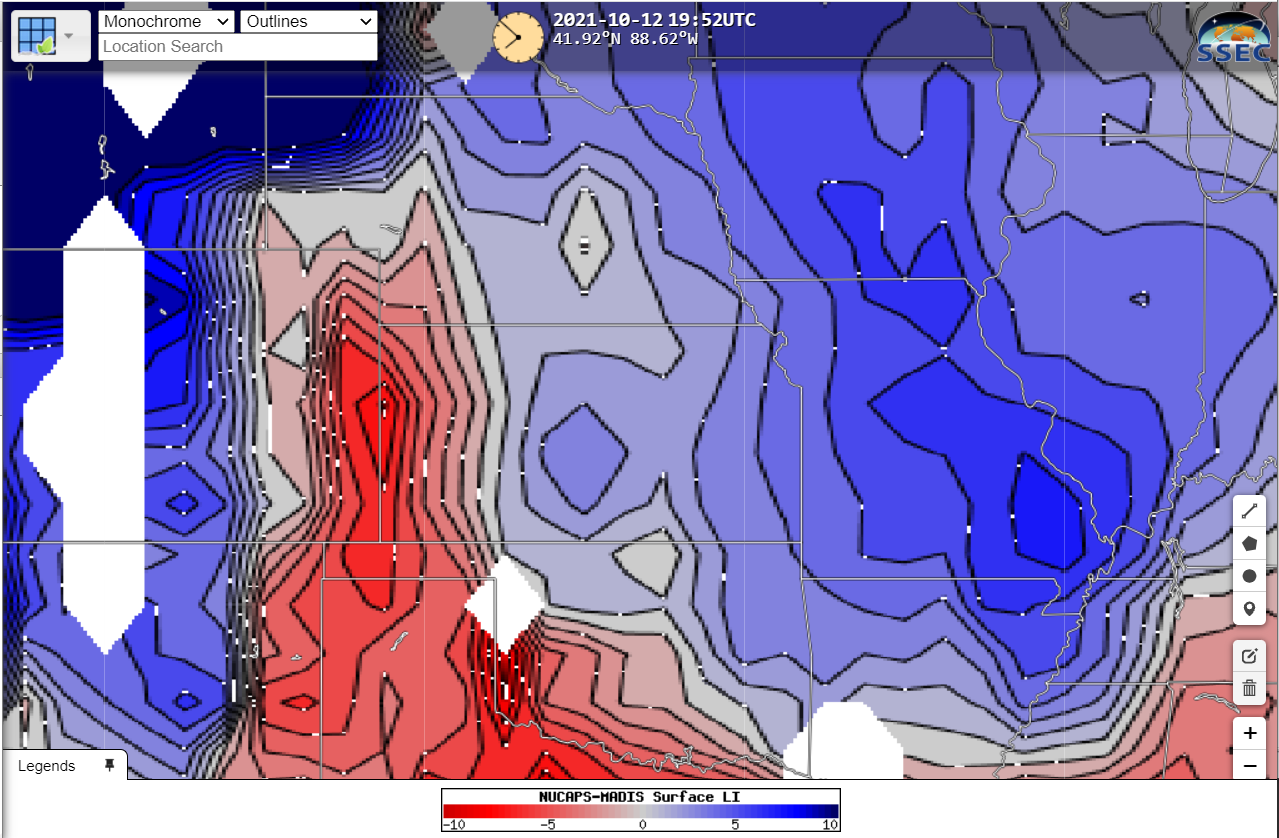
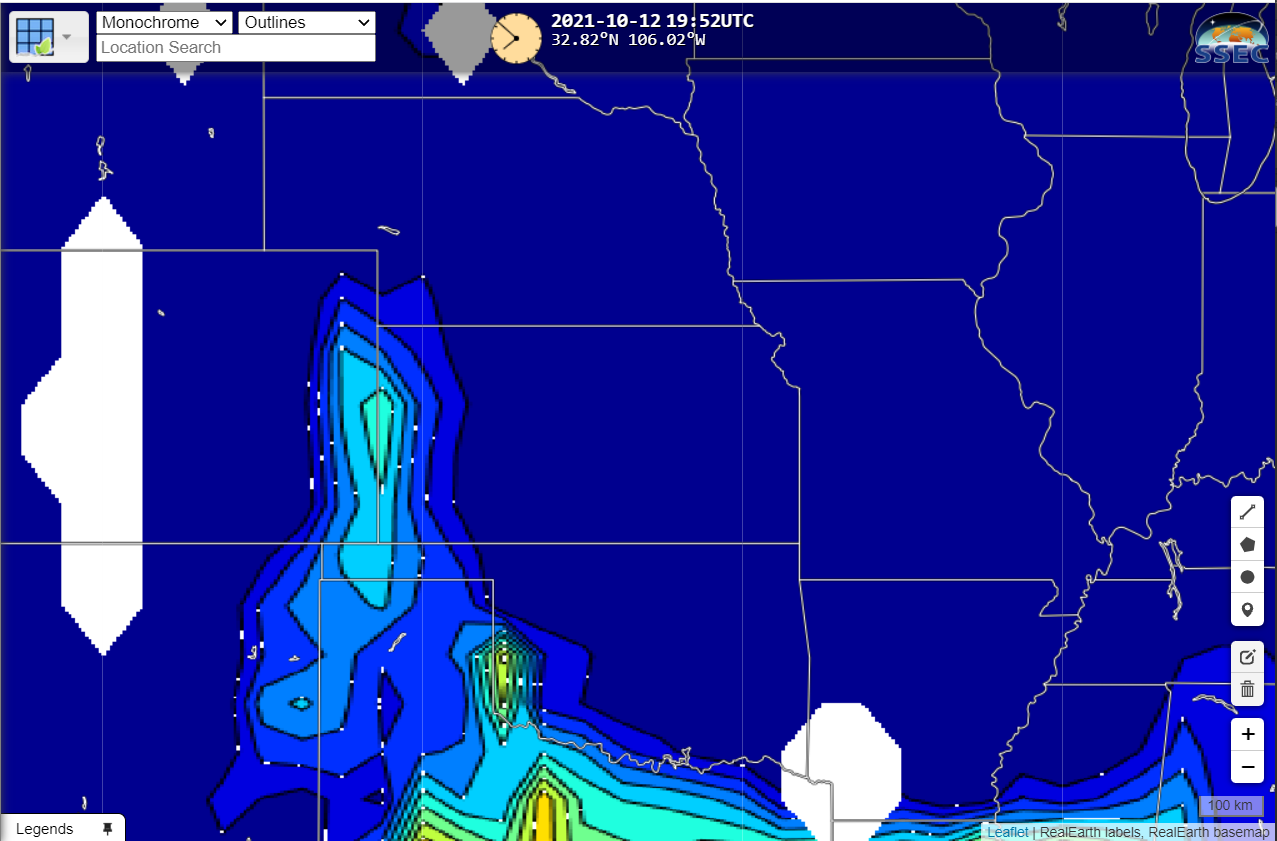
The plot below, taken from RealEarth, shows the Lifted Index computed from NUCAPS soundings blended with MADIS surface observations. The greatest instability, shaded in red, lies along the Kansas/Colorado border, and it extends to the southeast along the western Oklahoma/north Texas border. (Click here to see surface-based CAPE at the same time).
NUCAPS/MADIS Surface-based Lifted Index, 1952 UTC on 12 October 2021 (Click to enlarge)
What do individual profiles show? 20 different profiles over southwestern Kansas are in the stepped animation below. Steep mid-level lapse rates (greater than 8 K/km) are indicated in the soundings, and Most Unstable Convective Available Potential Energy (MUCAPE) values persist in the lower troposphere. It also appears that moisture is pooling along the Kansas/Colorado border: precipitable water values from two soundings (at 38.42 N/102.60 N and 38.04 N /101.89 W) and are greater than surrounding values. So: instability is present, and moisture is available. Model-independent information like this can help a forecaster during the wait for initiation.
GOES-16 Day Cloud Phase Distinction image at 1931 UTC, along with NUCAPS Sounding Availability plots. Individual profiles as indicated are shown in the inset; values from those soundings are shown in the grey box in upper left (Click to enlarge)
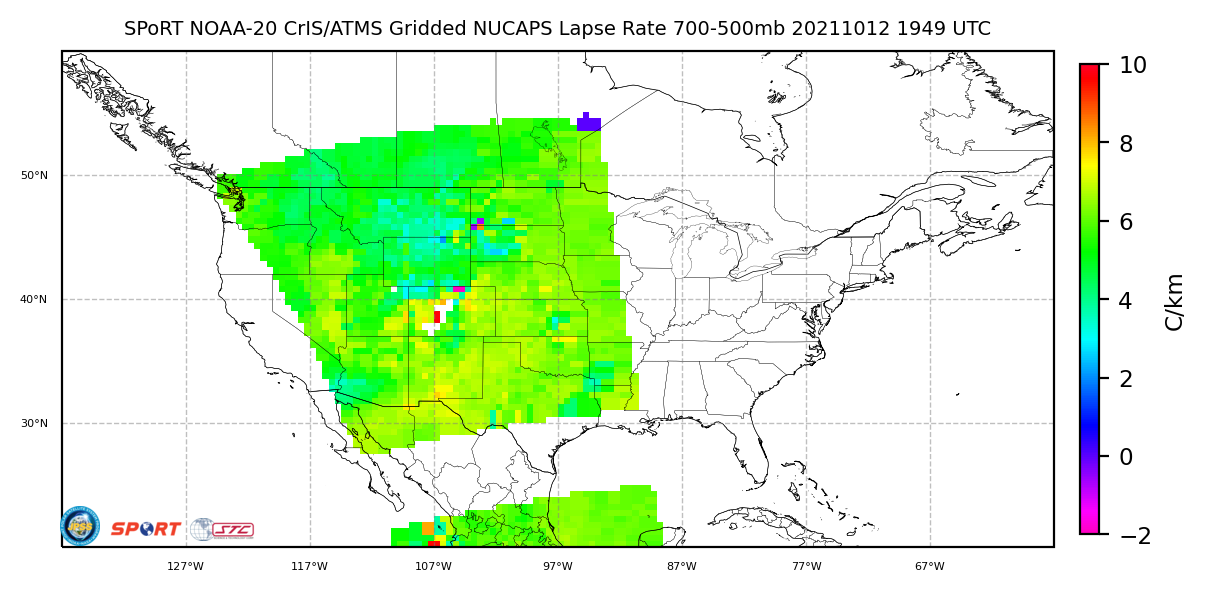
It can be time-consuming in AWIPS to look through multiple soundings (the Pop-up SkewT functionality can be helpful, but for subtle changes in precipitable water, or in lapse rate, that use is limited). Gridded NUCAPS fields are available in AWIPS, and also online. The 700-500 mb lapse rate, shown below, from this website, diagnoses the steep lapse rates that were present (perhaps to be expected given the suggestion of an elevated mixed layer in the water vapor imagery at the top of this blog post!)
Lapse Rate (700-500 mb) diagnosed from NOAA-20 NUCAPS, 1949 UTC on 12 October 2021 (Click to enlarge)
So what happened with this event? Convection developed along the Colorado/Kansas border, and spawned severe weather over western Kansas, western Oklahoma, and western Texas. GOES-16 clean window infrared imagery (10.3 µm), below, shown on top of the Level 2 stability Lifted index product, shows the instability and the development of the convection (Click here for a Band 13 animation only).
GOES-16 clean window infrared imagery (Band 13, 10.3 µm) and Level 2 Derived Stability Index (Lifted Index, clear sky only) from 2201 UTC on 12 October 2021 through 0646 UTC on 13 October 2021 (Click to enlarge).
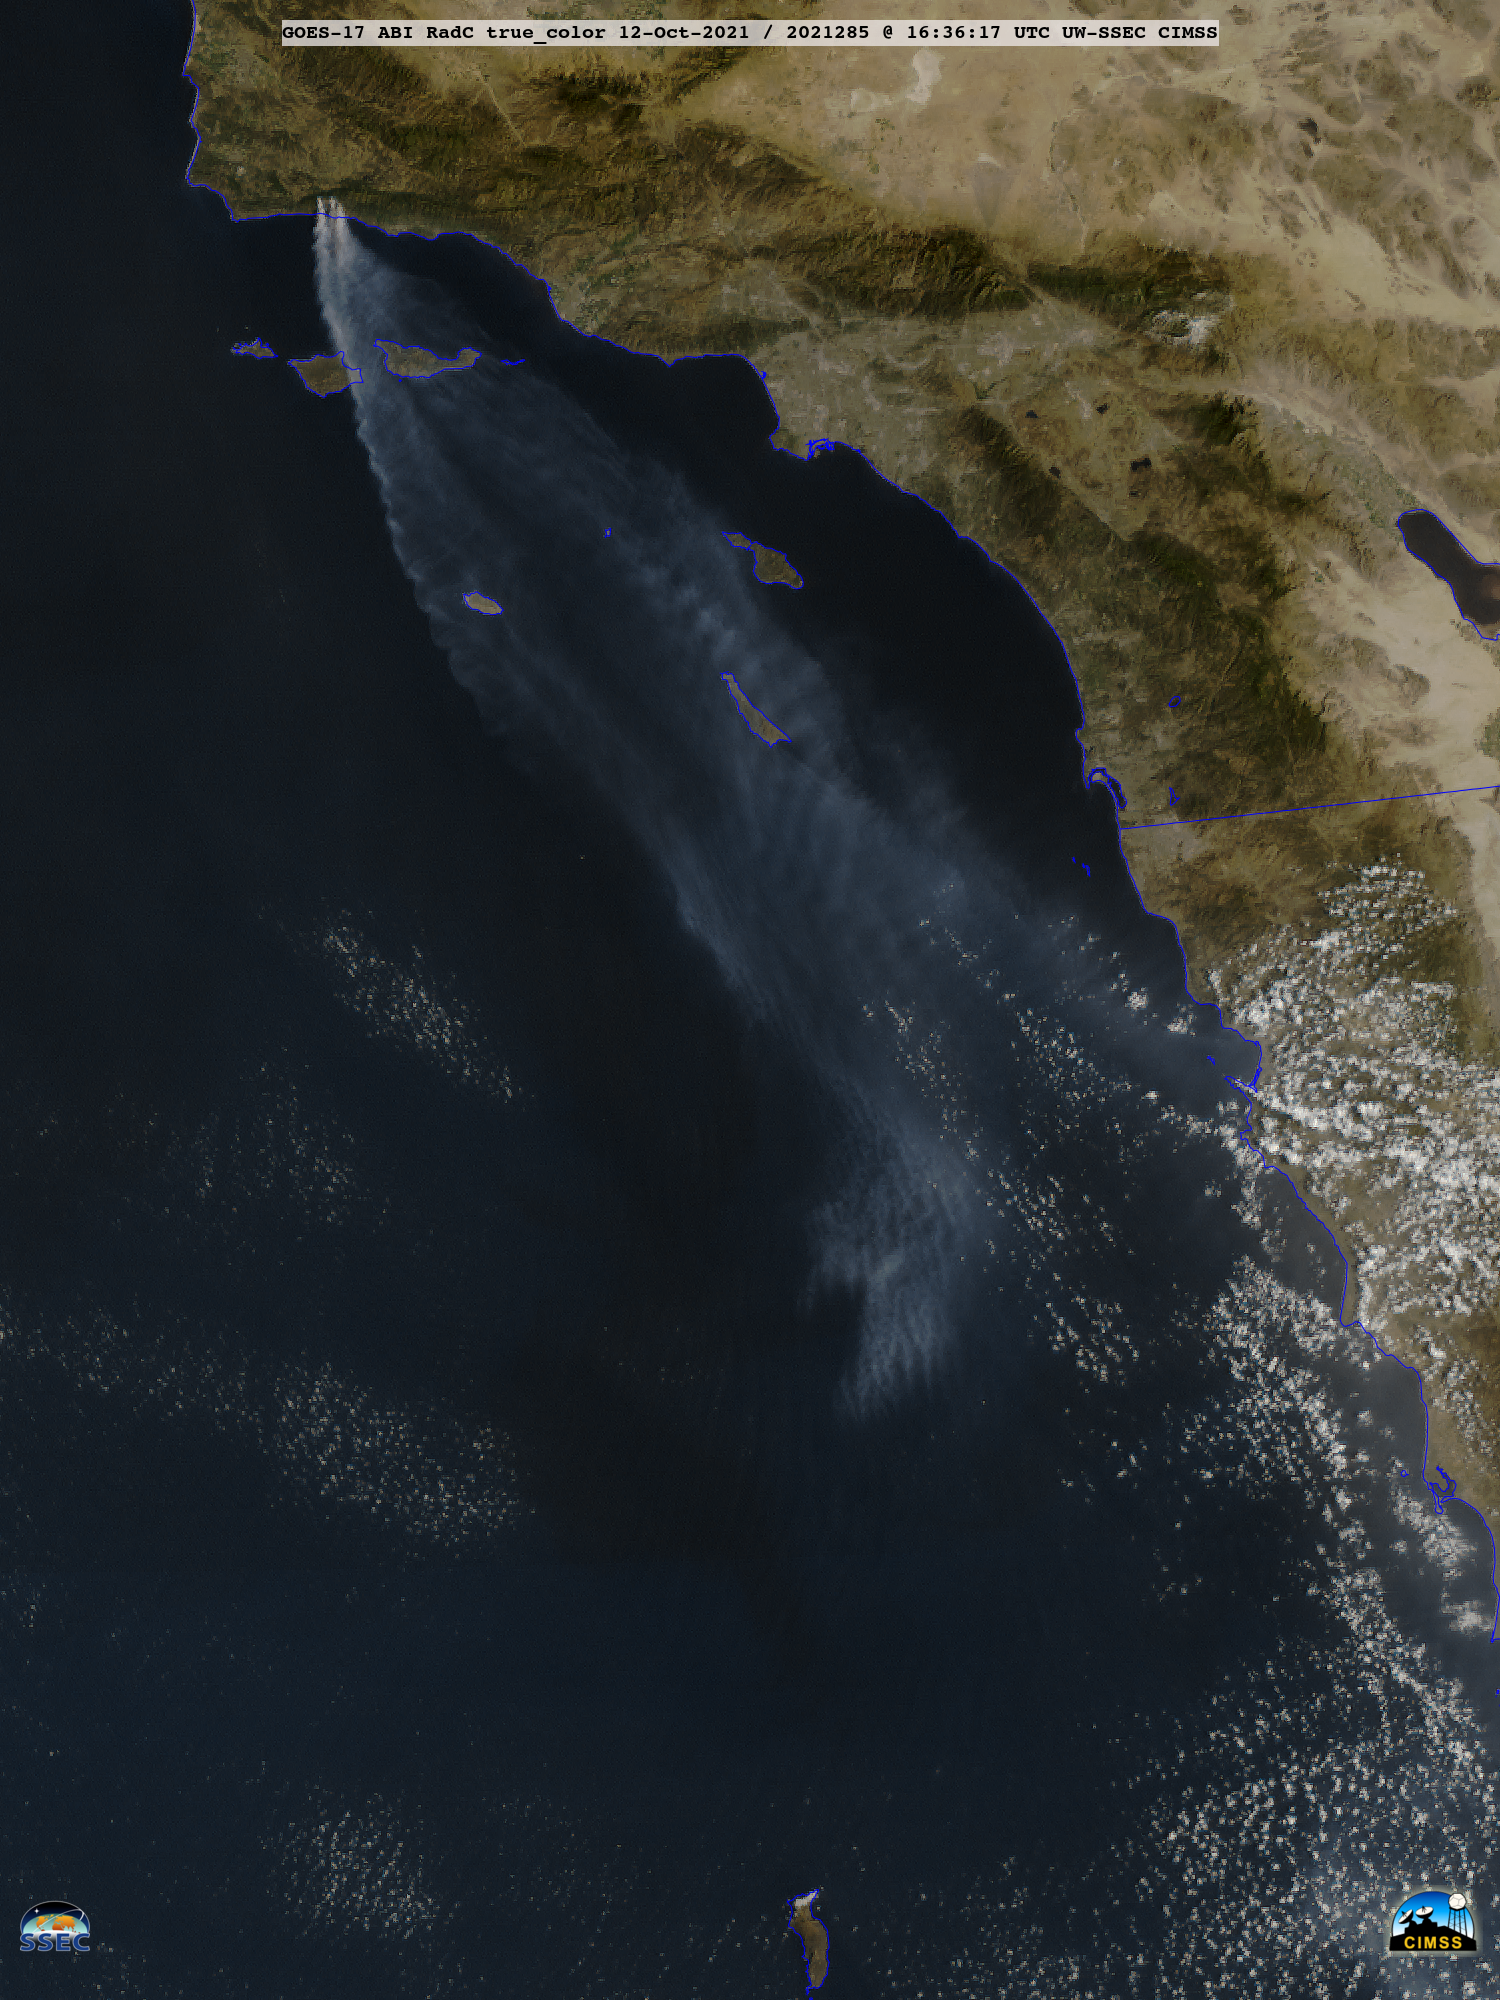
GOES-17 (GOES-West) True Color RGB images created using Geo2Grid (above) showed the transport of smoke from the Alisal Fire in Southern California on 12 October 2021. The dashed line in the images is Highway 101 — a portion of which was closed, as the wind-driven fire raced toward the coast. Late in the day some... Read More
GOES-17 True Color RGB images [click to play animated GIF | MP4]
GOES-17 (GOES-West) True Color RGB images created using Geo2Grid(above) showed the transport of smoke from the Alisal Fire in Southern California on 12 October 2021. The dashed line in the images is Highway 101 — a portion of which was closed, as the wind-driven fire raced toward the coast. Late in the day some low-altitude smoke began to move eastward along the coast, eventually reducing the surface visibility to 6 miles at Santa Barbara.
During the preceding overnight hours (at 0916 UTC or 2:16 am PDT), a comparison of Suomi-NPP VIIRS Shortwave Infrared and Day/Night Band images (below) revealed the thermal signature and nighttime glow of the fire. The VIIRS imagery was downloaded and processed via the SSEC/CIMSS Direct Broadcast ground station.
Suomi-NPP VIIRS Shortwave Infrared (3.74 µm) and Day/Night Band (0.7 µm) images [click to enlarge]
The Suomi-NPP overpass time of the fire region was actually 0926 UTC — and a time-matched comparison of Shortwave Infrared images from GOES-17 and Suomi-NPP (below) demonstrated that the superior spatial resolution of VIIRS instrument (~375 meters, vs ~2 km for the ABI on GOES-17) provided a more accurate depiction of the areal coverage of the fire.
Shortwave Infrared images from Suomi-NPP (3.74 µm) and GOES-17 (3.9 µm) [click to enlarge]
===== 13 October Update =====
GOES-17 True Color RGB images [click to play animated GIF | MP4]
On 13 October, GOES-17 True Color RGB images (above) showed that as offshore wind speeds relaxed, a shift to onshore flow recirculated some of the smoke inland — with smoke briefly reducing the surface visibility to 1.5 miles at Santa Barbara airport (below). Farther to the south, residual smoke from the previous day of burning was also evident, with some of it traveling as far as Isla Guadalupe (Guadalupe Island) nearly 400 miles away.
Time series of surface observation data from Santa Barbara Municipal Airport [click to enlarge]
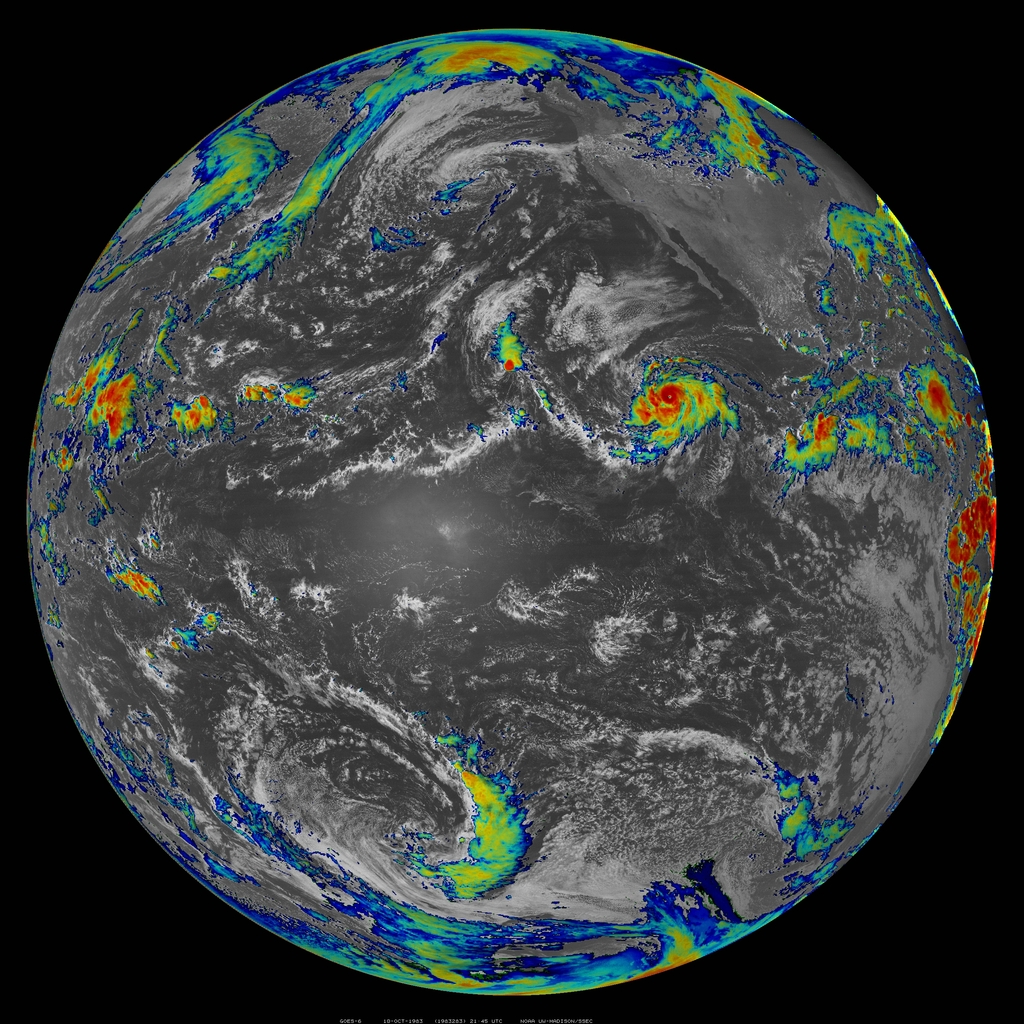
GOES-6GOES-6 was NOAA‘s operational satellite during the 1983 Hurricane Raymond, which was a Cat 4. This incredibly powerful storm was made famous in the 1998 book “Red Sky in Mourning: A True Story of Love, Loss, and Survival at Sea” written by Tami Oldham Ashcraft with Susea McGearhart, and also by the... Read More
GOES-6
GOES-6 was NOAA‘s operational satellite during the 1983 Hurricane Raymond, which was a Cat 4. This incredibly powerful storm was made famous in the 1998 book “Red Sky in Mourning: A True Story of Love, Loss, and Survival at Sea” written by Tami Oldham Ashcraft with Susea McGearhart, and also by the 2018 movie “Adrift”.
“[October 12, 1983]… About 1000 the seas arched into skyscrapers, looming over our boat. The anemometer– the wind speed gauge — now read a steady sixty knots [69 mph or 31 m/s] and we were forced to take down all sails and maintain our position under bare poles with the engine running … The wind sounded like jet engines being thrown in reverse. I looked at the anemometer and gasped when I read 140 knots [161 mph or 72 m/s] … I looked up at the ship’s clock: It was 1300 hours. My eyes dropped to the barometer: It was terrifyingly low — below twenty-eight-inch mark [948 hPa]. Dread engulfed me. I hugged the musty blanket to my chest as I was flung side to side in the hammock. No sooner had I closed my eyes when all motion stopped. Something felt very wrong, it became too quiet — this trough too deep. “OHMIGOD!” I heard Richard scream. My eyes popped open. WHOMP! I covered my head as I sailed into oblivion.”
From the book: Red Sky in Mourning: A True Story of Love, Loss, and Survival at Sea
GOES-6 IR loop from 13:15 UTC on October 11th, to 02:45 UTC on October 13th, 1983 in the eastern Pacific. The locations of the boat (Hazana) are approximate.
The above GOES-6 infrared satellite loop has been annotated with two approximate locations of the boat (Hazana), one of October 9th and the other on October 18th, 1983. While the location of the boat (in beige) on October 12th and it’s relationship to Hurricane Raymond is unknown, the boat must have received the brunt of the storm. A similar loop as above, but without the labels or grid lines. Or an image with only the grid lines and boat locations.
Multi-day, large-scale, visible loop of the daytime images from GOES-6 between October 8-13, 1983.
A similar visible loop, but animated twice as fast and as an animated gif. Note the development of the eye, along with the fast forward speed of the storm.
A higher resolution GOES-6 visible loop over the daytime hours of October 10th, 1983.
Similar GOES-6 visible loops (mp4) from October 11th and 12th, 1983 (and as animated gifs: October 11th and 12th).
A full spatial resolution GOES-6 visible loop over the daytime hours of October 10th, 1983.
Similar as above, full spatial resolution GOES-6 visible loops (mp4) views from October 11th and 12th, 1983 (and as animated gifs: October11th and 12th).
Multi-day infrared loop of the daytime images from GOES-6 between October 8-13, 1983.
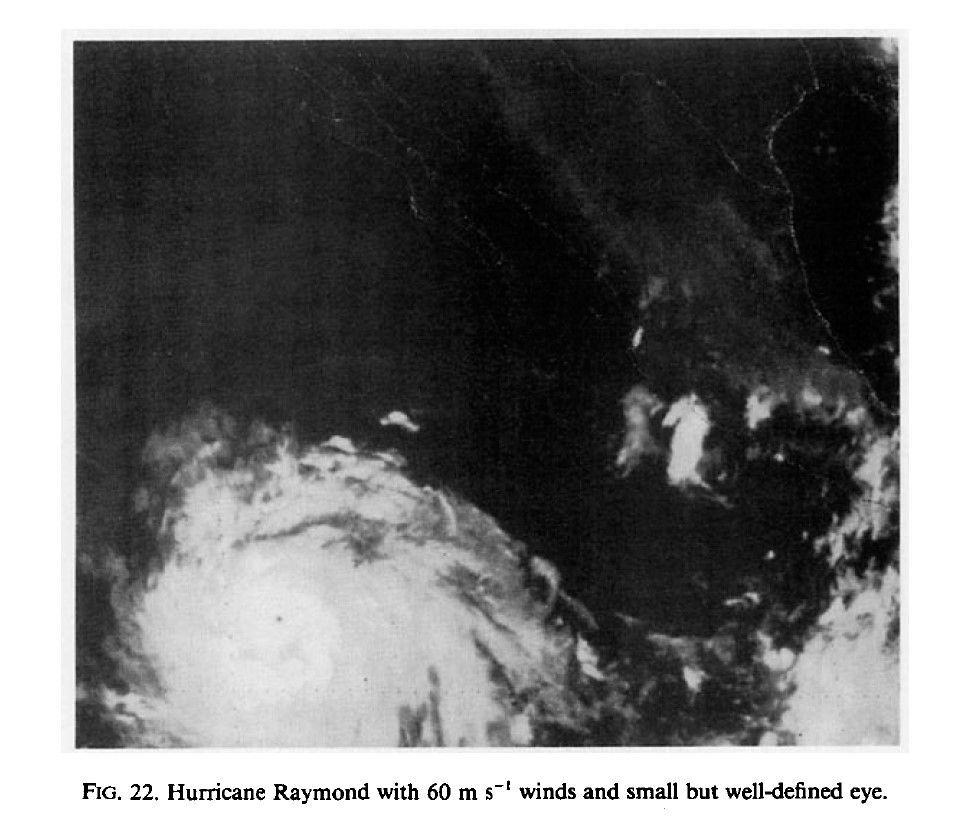
Infrared (IR) imagery can monitor the storm throughout the day and night. Recall that a smaller hurricane eye can imply a more powerful storm.
…. “A tropical wave, later to become Hurricane Raymond, passed into the Pacific from Nicaragua on 5 October and moved westward at 8 m s-1. At this time, a deep-layer mean high center was over Mexico and a well developed ridge line extended westward toward the Hawaiian Islands. By 0600 GMT 8 October, infrared satellite imagery showed increasing cyclonic shear over the disturbance, and the first advisory on the cyclone was issued with the center near 12.4°N, 104.4°W. The depression moved due west at 2 m s-1, south of the mean ridge line, and over very warm 29-30°C water. Intensification to tropical storm occurred at 0000 GMT 9 October near 12.3°N, 106.4°W. Tropical Storm Raymond continued moving west, accelerated and intensified. By 1200 GMT 10 October, winds had reached 34 m s-1 and the storm was upgraded to a hurricane near· 12.0°N, 114.6°W. Raymond was now moving west at 8 m s-1 and a small but distinct eye had become visible near the center. Raymond then began to intensify rapidly (Fig. 22). Twenty-four hours later, the cyclone reached its maximum intensity of 64 m s-1 [143 mph] near 12.4°N, 121.2°W. Raymond then turned west-northwest, moving at 8 to 9 m s-1. With sea surface temperatures remaining above 27°C, Raymond moved across 140°W longitude with 57 m s-1 winds shortly after 0600 GMT on 14 October.“
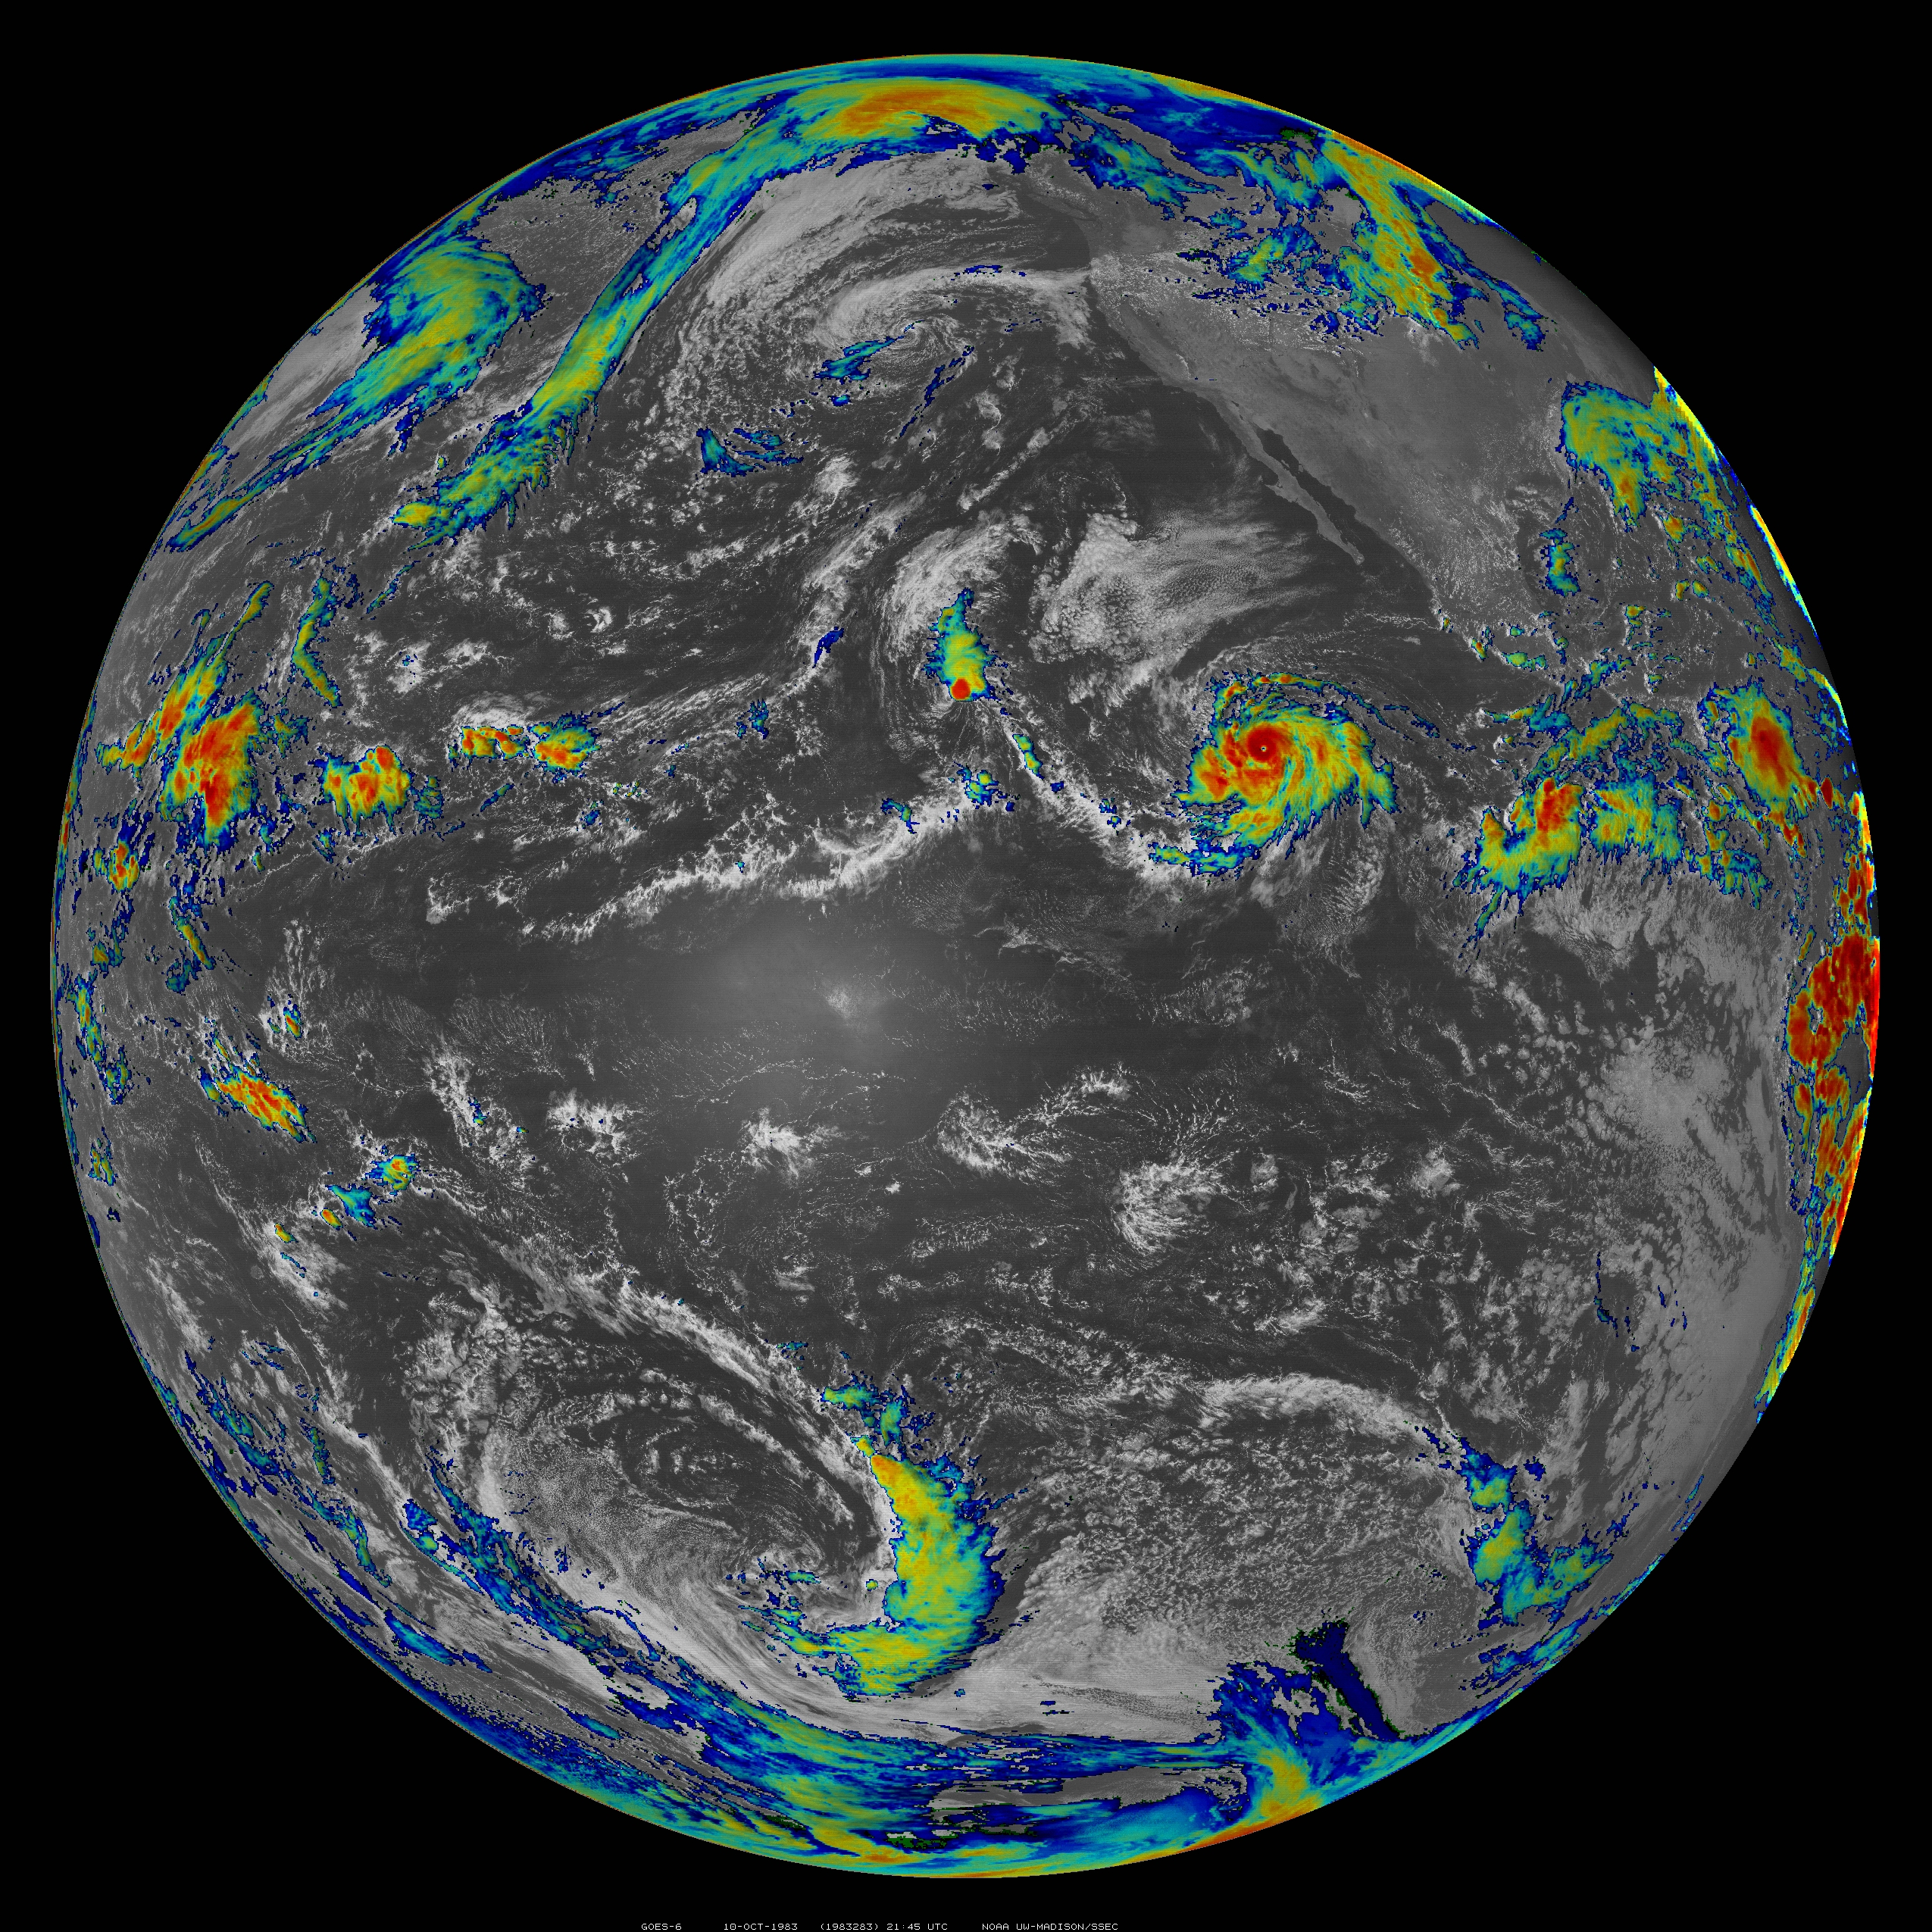
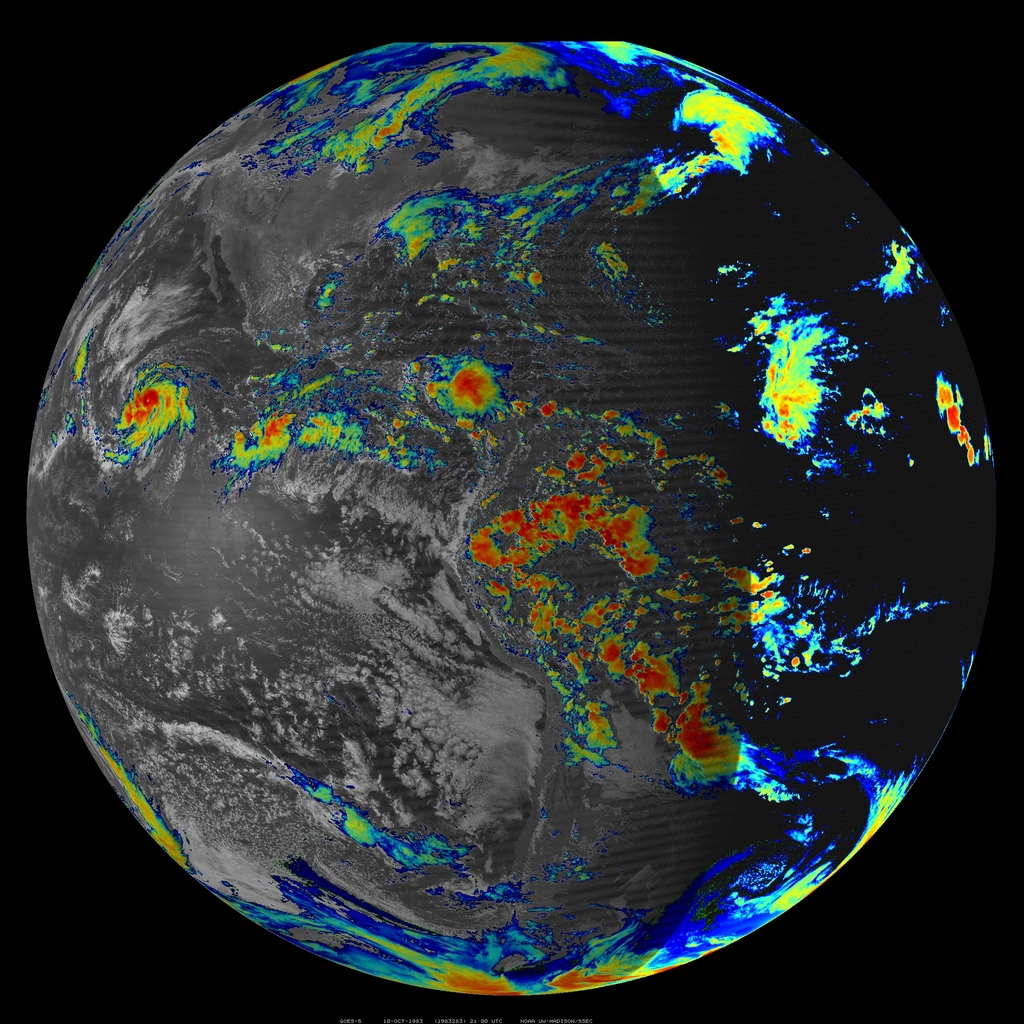
GOES-6 Full Disk image from October 10, 1983. This image combines visible imagery and cloud infrared temperatures.
A larger version of the above image. A similar image as above, but as seen by NOAA’s GOES-5, which was then the eastern GOES.
2020 – Hurricane Marie
Another long-lived eastern Pacific category 4 storm was Hurricane Marie in 2020 as detailed by NHC. Of course the more modern GOES-17 Advanced Baseline Imager (ABI) was able to acquire images more frequently and at a higher spatial resolution than was possible in 1983, as in shown in this CIMSS Satellite Blog post.
Animation of both visible and IR (cold pixels) bands of Hurricane Marie, 2020.
2021 – Hurricane Linda
GOES-15 band 3 (6.5 mircometer) band in August of 2021 over the Eastern Pacific.
A similar storm in August of 2021, as shown in a GOES-15 water vapor band loop over several days.
Credits
NOAA GOES-6 data (and other GOES) are via the University of Wisconsin-Madison SSEC Satellite Data Services. These images were made using the McIDAS-X software, developed at the UW/SSEC. Thanks for all who have made the entire suite of GOES possible, as well as the experimental satellites that preceded the operational ones. Much progress has been made in the monitoring of tropical cyclones between GOES-5/6 and the current advanced imagers. More GOES-16 and -17 imagery and other information. Scott Bachmeier is thanked for his help with this post.
Severe Tropical Storm Kompasu moved westward just north of the island of Luzon in the Philippines on 11 October. The Himawari-8 Target Sector clean window infrared (Band 13, 10.4 µm) imagery, above, from 0232 – 1502 UTC (Imagery courtesy JMA; imagery available here), shows deep convection becoming more organized as the storm... Read More
Himawari-8 clean window infrared (band 13, 10.4 µm) imagery, 0232 – 1502 UTC on 11 October 2021
Severe Tropical Storm Kompasu moved westward just north of the island of Luzon in the Philippines on 11 October. The Himawari-8 Target Sector clean window infrared (Band 13, 10.4 µm) imagery, above, from 0232 – 1502 UTC (Imagery courtesy JMA; imagery available here), shows deep convection becoming more organized as the storm center moved.
Moderate wind shear that had been affecting Kompasu slowly relaxed in the 24 hours before the storm moved north of Luzon, as shown in the wind shear tendency map shown below (imagery obtained from this link at the CIMSS Tropical Website). Shear over/around the storm has been relaxing.
Wind shear tendency, 1500 UTC 10 October 2021 – 1200 UTC 11 October 2021 (click to enlarge)Wind shear over the western Pacific, 1200 UTC 10 October – 1200 UTC 11 October 2021 (Click to enlarge)
Computed shear (imagery also taken from the CIMSS Tropical Website) is shown in the animation above. Wind shear for both animations above is defined here. A relatively small area of favorable wind shear was near the storm center as Kompasu became better organized in the band 13 imagery above.
Scatterometry imagery, below, from various satellite platforms at this site, tracked the system’s motion from 0100 to 1130 UTC on 11 October, as it moved north of Luzon.
Scatterometer imagery from HY-2B and HY-2C, and from ASCAT A, B and C, between 0100 and 1130 UTC on 11 October (2021)
Kompasu is forecast to move due west across the South China Sea in the next days, affecting the island of Hainan on the 13th before 1200 UTC. (Forecast, from JTWC; Here is a similar plot from JMA). Wind shear is not forecast to relax further in the next days so significant stregthening is not forecast.


