This website works best with a newer web browser such as Chrome, Firefox, Safari or Microsoft
Edge. Internet Explorer is not supported by this website.
The Manam volcano in Papua New Guinea erupted around 2200 UTC on 19 October 2021. JMA Himawari-8 True Color RGB images created using Geo2Grid (above) showed lower- to middle-altitude ash clouds (shades of tan to brown) moving westward and northward, while the main eruptive cloud — composed of a mixture... Read More
Himawari-8 True Color RGB images [click to play animated GIF | MP4]
The Manam volcano in Papua New Guinea erupted around 2200 UTC on 19 October 2021. JMA Himawari-8 True Color RGB images created using Geo2Grid(above) showed lower- to middle-altitude ash clouds (shades of tan to brown) moving westward and northward, while the main eruptive cloud — composed of a mixture of ash, SO2 and ice particles — spread out at high altitudes to the east and north. (Side note: brief flashes of sun glint off some of the island rivers were also seen.)
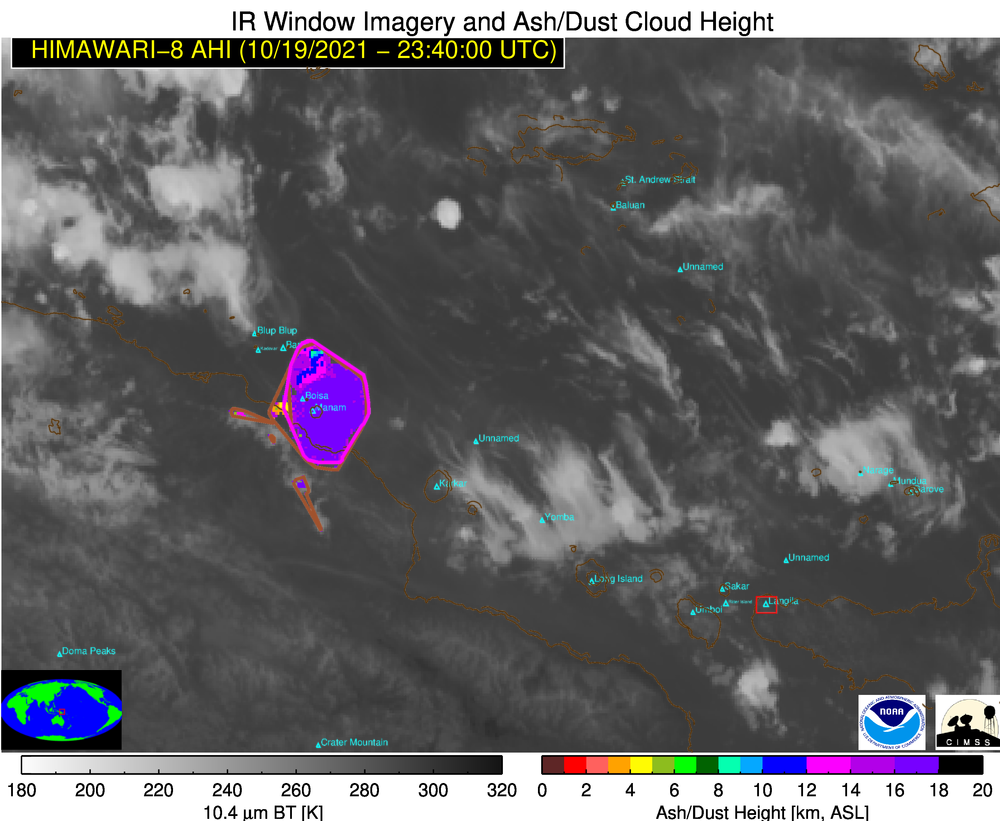
Retrieved values of Ash Height from the NOAA/CIMSS Volcanic Cloud Monitoring site (below) indicated that the Manam eruption cloud reached maximum altitudes within the 16-18 km range.
Himawari-8 Ash Height [click to play animated GIF | MP4]
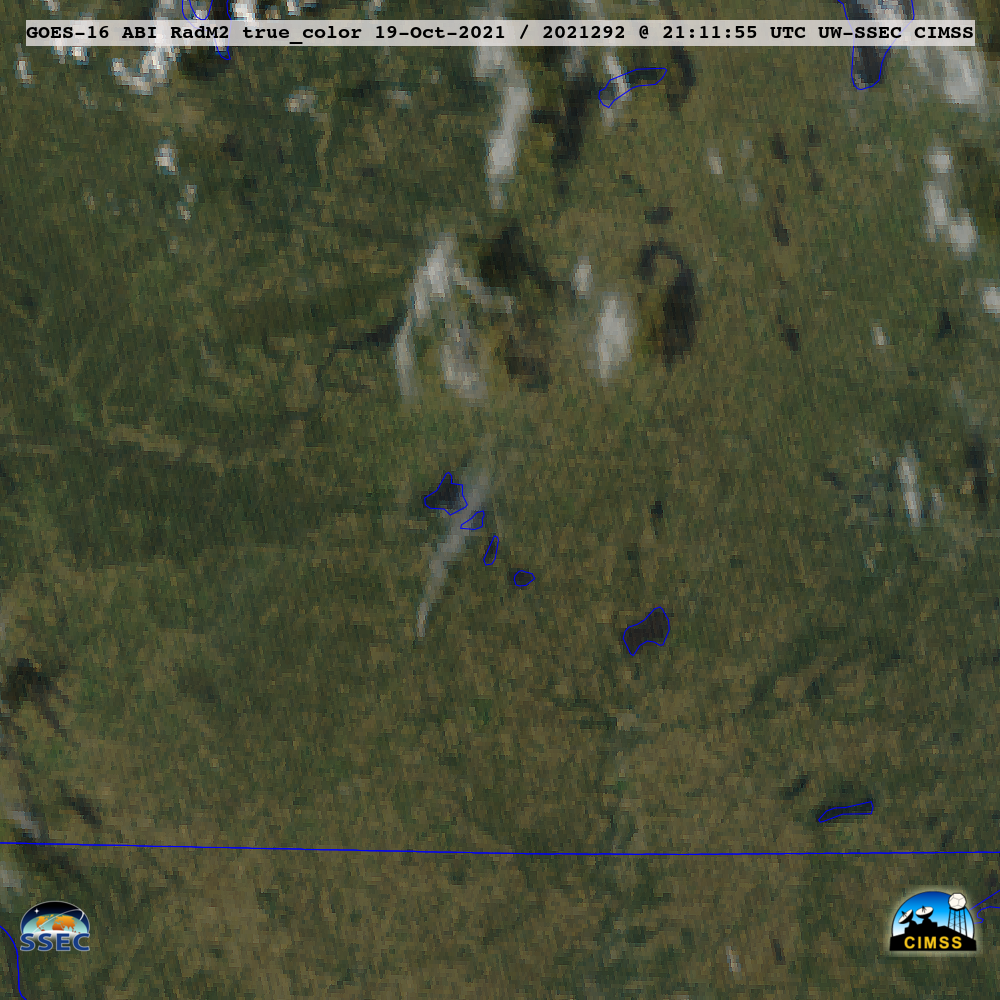
1-minute Mesoscale Domain Sector GOES-16 (GOES-East) “Red” Visible (0.64 µm) and Shortwave Infrared (3.9 µm) images (above) showed the smoke plume and thermal anomaly or “hot spot” (cluster of darker black pixels) associated with what was likely a prescribed burn at or near the Brooklyn Wildlife Area in south-central Wisconsin on 19 October 2021.A toggle between... Read More
GOES-16 “Red” Visible (0.64 µm, top) and Shortwave Infrared (3.9 µm, bottom) images [click to play animated GIF | MP4]
1-minute Mesoscale Domain Sector GOES-16 (GOES-East) “Red” Visible (0.64 µm) and Shortwave Infrared (3.9 µm) images (above) showed the smoke plume and thermal anomaly or “hot spot” (cluster of darker black pixels) associated with what was likely a prescribed burn at or near the Brooklyn Wildlife Area in south-central Wisconsin on 19 October 2021.
A toggle between the GOES-16 Shortwave Infrared image at 2027 UTC and a background Google Maps image — as viewed using RealEarth(below) — further implicated Brooklyn Wildlife Area as the likely fire source region.
GOES-16 Shortwave Infrared (3.9 µm) image at 2027 UTC, along with a Google Maps background [click to enlarge]
GOES-16 True Color RGB images created using Geo2Grid(below) offered a clearer depiction of the smoke plume, as it eventually moved northeastward over the Madison metro area.
GOES-16 True Color images [click to play animated GIF | MP4]
A few miles to the northeast, the ceilometer at Madison Dane County Regional Airport also detected the base of the smoke plume aloft (below).
Plot of surface report data from Madison Dane County Regional Airport [click to enlarge]
Southwesterly surface wind gusts at Monroe (located about 20 miles southwest of the fire source region) were as high as 24 knots (28 mph) just before 19 UTC (below).
Plot of surface data from Monroe [click to enlarge]
Thanks to Kathy Strabala (SSEC) for bringing this case to our attention!
The suite of Fog/Low Stratus (FLS) products derived using GOES-17 (GOES-West) data within the PACUS Sector (above) became available via the Satellite Broadcast Network (SBN) for AWIPS on 18 October 2021. Two examples are shown below: one centered over Oregon, and the other centered over the Big Island of Hawai’i. The 4... Read More
GOES-17 MVFR Probability over the PACUS Sector [click to play animation]
The suite of Fog/Low Stratus (FLS) products derived using GOES-17 (GOES-West) data within the PACUS Sector (above) became available via the Satellite Broadcast Network (SBN) for AWIPS on 18 October 2021. Two examples are shown below: one centered over Oregon, and the other centered over the Big Island of Hawai’i. The 4 products are Marginal Visual Flight Rules (MVFR, cloud ceiling 1000 to 3000 feet above ground level and/or visibility 3 to 5 miles) Probability, Instrument Flight Rules (IFR, cloud ceiling 500 feet to less than 1000 feet and/or visibility 1 to less than 3 miles) Probability, Low Instrument Flight Rules (LIFR, cloud ceiling less than 500 feet and/or visibility less than 1 mile) Probability and Cloud Thickness.
GOES-17 MVFR Probability (top left), IFR Probability (top right), Low IFR Probability (bottom left) and Low Cloud Thickness (bottom right) [click to play animation]
GOES-17 MVFR Probability (top left), IFR Probability (top right), Low IFR Probability (bottom left) and Low Cloud Thickness (bottom right) [click to play animation]
GOES-17 FLS products are also being produced by CIMSS over the Alaska region (below) — which are being distributed via an LDM feed.
GOES-17 MVFR Probability (top left), IFR Probability (top right), Low IFR Probability (bottom left) and Low Cloud Thickness (bottom right) [click to play animation]
A library of FLS applications can be found on the GOES-R Fog Product Examples site, and FLS Forecaster Training is available here.
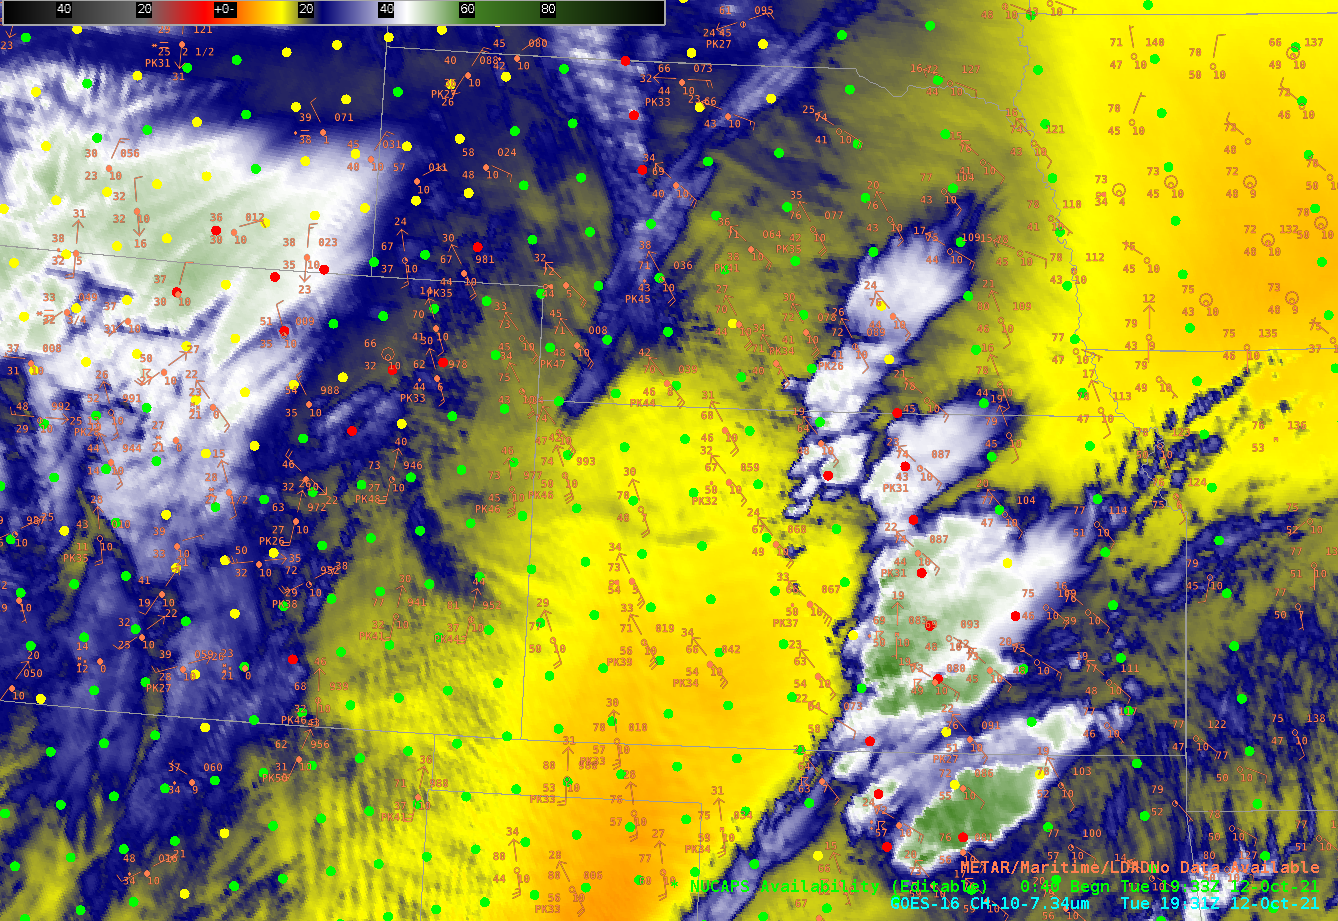
GOES-16 Low-Level water vapor infrared imagery (Band 10, 7.34 µm) at 1931 UTC on 12 October 2021 (Click to enlarge). NOAA-20 NUCAPS Sounding Availability points are indicated as colored dots. METAR plots are also included.
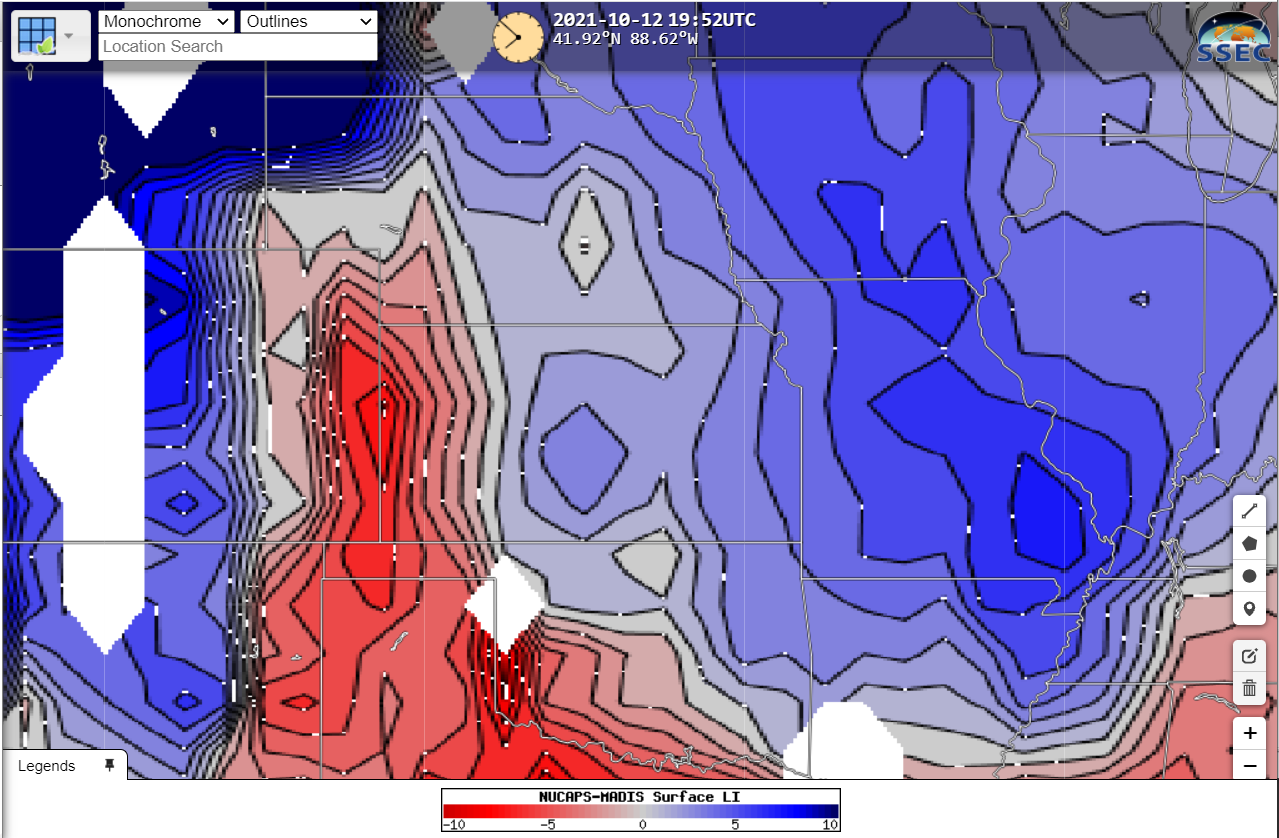
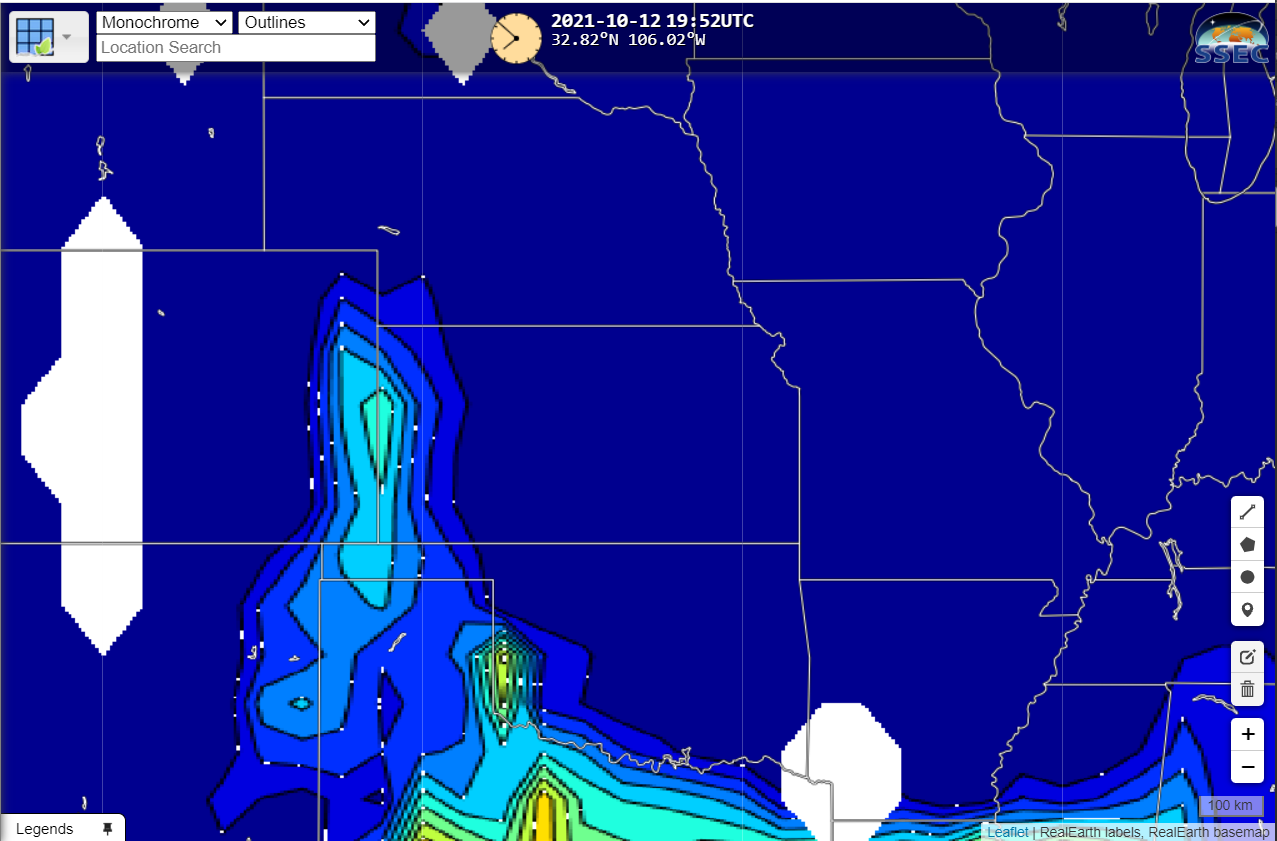
The plot below, taken from RealEarth, shows the Lifted Index computed from NUCAPS soundings blended with MADIS surface observations. The greatest instability, shaded in red, lies along the Kansas/Colorado border, and it extends to the southeast along the western Oklahoma/north Texas border. (Click here to see surface-based CAPE at the same time).
NUCAPS/MADIS Surface-based Lifted Index, 1952 UTC on 12 October 2021 (Click to enlarge)
What do individual profiles show? 20 different profiles over southwestern Kansas are in the stepped animation below. Steep mid-level lapse rates (greater than 8 K/km) are indicated in the soundings, and Most Unstable Convective Available Potential Energy (MUCAPE) values persist in the lower troposphere. It also appears that moisture is pooling along the Kansas/Colorado border: precipitable water values from two soundings (at 38.42 N/102.60 N and 38.04 N /101.89 W) and are greater than surrounding values. So: instability is present, and moisture is available. Model-independent information like this can help a forecaster during the wait for initiation.
GOES-16 Day Cloud Phase Distinction image at 1931 UTC, along with NUCAPS Sounding Availability plots. Individual profiles as indicated are shown in the inset; values from those soundings are shown in the grey box in upper left (Click to enlarge)
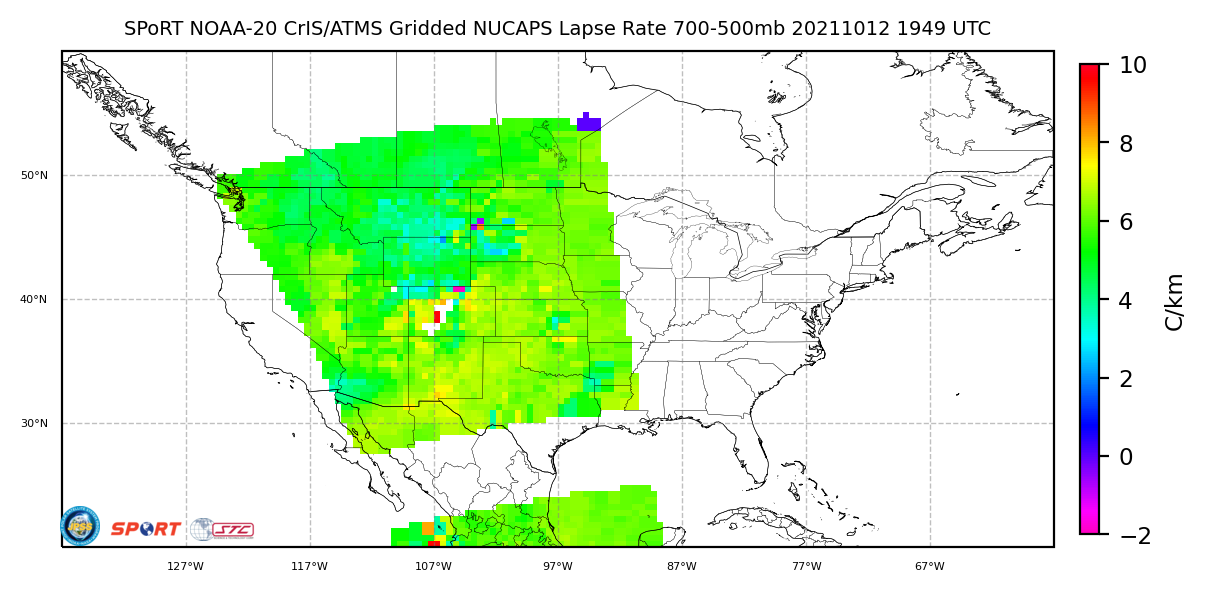
It can be time-consuming in AWIPS to look through multiple soundings (the Pop-up SkewT functionality can be helpful, but for subtle changes in precipitable water, or in lapse rate, that use is limited). Gridded NUCAPS fields are available in AWIPS, and also online. The 700-500 mb lapse rate, shown below, from this website, diagnoses the steep lapse rates that were present (perhaps to be expected given the suggestion of an elevated mixed layer in the water vapor imagery at the top of this blog post!)
Lapse Rate (700-500 mb) diagnosed from NOAA-20 NUCAPS, 1949 UTC on 12 October 2021 (Click to enlarge)
So what happened with this event? Convection developed along the Colorado/Kansas border, and spawned severe weather over western Kansas, western Oklahoma, and western Texas. GOES-16 clean window infrared imagery (10.3 µm), below, shown on top of the Level 2 stability Lifted index product, shows the instability and the development of the convection (Click here for a Band 13 animation only).
GOES-16 clean window infrared imagery (Band 13, 10.3 µm) and Level 2 Derived Stability Index (Lifted Index, clear sky only) from 2201 UTC on 12 October 2021 through 0646 UTC on 13 October 2021 (Click to enlarge).


