Multi-day eruptions of the La Soufrière volcano in the West Indies
![GOES-16 Ash RGB images [click to play animation | MP4]](https://cimss.ssec.wisc.edu/satellite-blog/images/2021/04/210409_goes16_ashRGB_so2RGB_La_Soufrere_volcano_anim.gif)
GOES-16 Ash RGB and SO2 RGB images [click to play animation | MP4]
The corresponding GOES-16 “Clean” Infrared Window (10.35 µm) images (below) showed that coldest cloud-top infrared brightness temperatures associated with the first eruption (which began shortly before 1250 UTC) were -62ºC, while the second and more explosive eruption (which began shortly after 1900 UTC) exhibited temperatures as cold as -78ºC.
![GOES-16 "Clean" Infrared Window (10.35 µm) images [click to play animation | MP4]](https://cimss.ssec.wisc.edu/satellite-blog/images/2021/04/210409_goes16_infrared_La_Soufrere_volcano_anim.gif)
GOES-16 “Clean” Infrared Window (10.35 µm) images [click to play animation | MP4]
![GOES-16 True Color RGB images [click to play animation | MP4]](https://cimss.ssec.wisc.edu/satellite-blog/images/2021/04/GOES-16_RadF_true_color_2021099_123000_2021099_213000.gif)
GOES-16 True Color RGB images (credit: Tm Schmit, NOAA/NESDIS/ASPT) [click to play animation | MP4]
![Ash Height product [click to play animation | MP4]](https://cimss.ssec.wisc.edu/satellite-blog/images/2021/04/210409_ash_height_anim.gif)
Ash Height product [click to play animation | MP4]
![Ash Probability product [click to play animation | MP4]](https://cimss.ssec.wisc.edu/satellite-blog/images/2021/04/210409_ash_probability_anim.gif)
Ash Probability product [click to play animation | MP4]
![Ash Loading product [click to play animation | MP4]](https://cimss.ssec.wisc.edu/satellite-blog/images/2021/04/210409_ash_loading_anim.gif)
Ash Loading product [click to play animation | MP4]
![Ash Effective Radius product [click to play animation | MP4]](https://cimss.ssec.wisc.edu/satellite-blog/images/2021/04/210409_ash_effective_radius_anim.gif)
Ash Effective Radius product [click to play animation | MP4]
===== 10 April Update =====
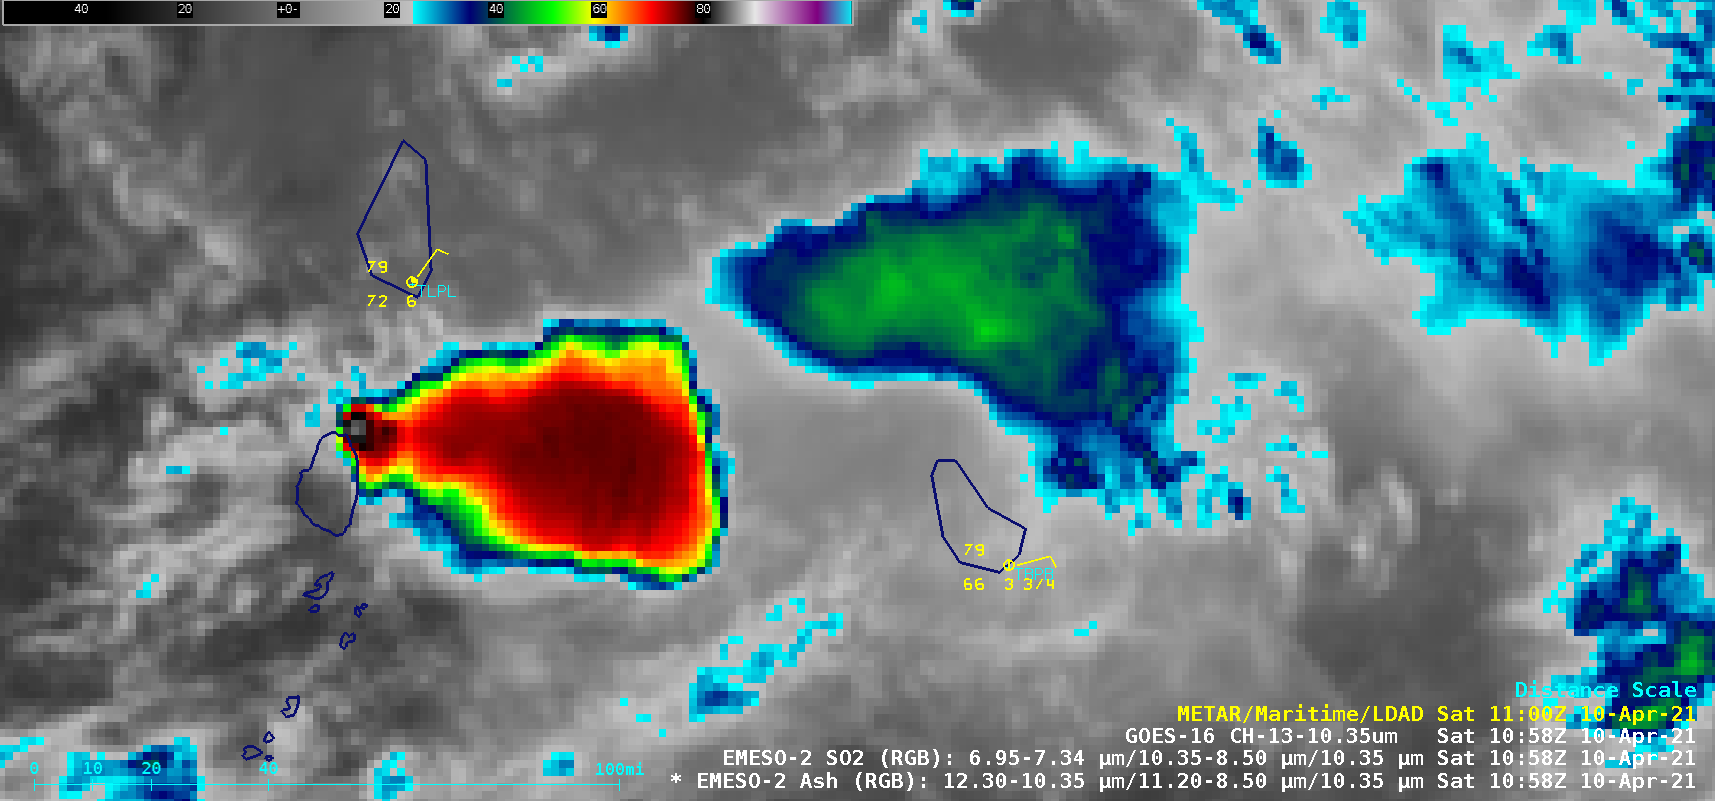
![GOES-16 “Clean” Infrared Window (10.35 µm) images [click to play animation | MP4]](https://cimss.ssec.wisc.edu/satellite-blog/images/2021/04/210410_goes16_infrared_La_Soufrere_volcano_2_anim.gif)
GOES-16 “Clean” Infrared Window (10.35 µm) images [click to play animation | MP4]
![Plot of 12 UTC rawinsonde data from Grantley Adams, Barbados [click to enlarge]](https://cimss.ssec.wisc.edu/satellite-blog/images/2021/04/210410_12UC_TBPB_RAOB.GIF)
Plot of 12 UTC rawinsonde data from Grantley Adams, Barbados [click to enlarge]
![GOES-16 True Color RGB images [click to play animation MP4]](https://cimss.ssec.wisc.edu/satellite-blog/images/2021/04/210410_1030utc_1130utc_goes16_trueColorRGB_La_Soufrere_volcano_anim.gif)
GOES-16 True Color RGB images [click to play animation | MP4]
![GOES-16 Ash RGB images [click to play animation | MP4]](https://cimss.ssec.wisc.edu/satellite-blog/images/2021/04/210410_goes16_ashRGB_La_Soufrere_volcano_2_anim.gif)
GOES-16 Ash RGB images [click to play animation | MP4]
![GOES-16 SO2 RGB images [click to play animation | MP4]](https://cimss.ssec.wisc.edu/satellite-blog/images/2021/04/210410_goes16_so2RGB_La_Soufrere_volcano_2_anim.gif)
GOES-16 SO2 RGB images [click to play animation | MP4]
“Red” Visible (0.64 µm) images from GOES-17 (left) and GOES-16 (right) [click to play animation | MP4]
![True Color RGB images from GOES-16 and GOES-17, at 1930 UTC (credit: Tim Schmit, NOAA/NESDIS/ASPB) [click to enlarge]](https://cimss.ssec.wisc.edu/satellite-blog/images/2021/04/extreme_parallax_g16_g17_2021099_1930Z.gif)
True Color RGB images from GOES-16 and GOES-17, at 1930 UTC (credit: Tim Schmit, NOAA/NESDIS/ASPB) [click to enlarge]
===== 11 April Update =====
![NOAA-20 VIIRS Day/Night Band (0.7 µm) image (credit: William Straka, CIMSS) [click to enlarge]](https://cimss.ssec.wisc.edu/satellite-blog/images/2021/04/210411_0606utc_noaa20_dayNightBand_volcanic_airglow_waves.jpeg)
NOAA-20 VIIRS Day/Night Band (0.7 µm) image (credit: William Straka, CIMSS) [click to enlarge]
The periodic violent eruptions continued into the daytime hours on 11 April — and GOES-16 Mid-level Water Vapor (6.9 µm) images (below) showed shock waves emanating radially outward from the initial volcanic cloud location following each eruption.
![GOES-16 Mid-level (6.9 µm) Water Vapor images [click to play animation | MP4]](https://cimss.ssec.wisc.edu/satellite-blog/images/2021/04/210411_goes16_waterVapor_La_Soufrere_volcano_anim.gif)
GOES-16 Mid-level (6.9 µm) Water Vapor images [click to play animation | MP4]
===== 13 April Update =====
![GOES-16 "Clean" Infrared Window (10.35 µm) and Ash RGB images [click to play animation | MP4]](https://cimss.ssec.wisc.edu/satellite-blog/images/2021/04/210413_goes16_infrared_ashRGB_La_Soufrere_volcano_anim.gif)
GOES-16 “Clean” Infrared Window (10.35 µm) and Ash RGB images [click to play animation | MP4]
A 4-day animation of GOES-16 Ash RGB images — covering the period from 1230 UTC on 09 April to 1230 UTC on 13 April — is shown below.
![GOES-16 Ash RGB images, 09-13 April [click to play MP4 animation]](https://cimss.ssec.wisc.edu/satellite-blog/images/2021/04/GOES-16_ABI_RadF_ash_2021102_100019Z.png)
GOES-16 Ash RGB images, 09-13 April (credit Tim Schmit, NOAA/NESDIS/ASPB) [click to play MP4 animation]