
GOES-16 Day Cloud Phase Distinction RGB images [click to play animated GIF | MP4]
1-minute Mesoscale Domain Sector GOES-16 (GOES-East) Day Cloud Phase Distinction RGB images (above) displayed a narrow band of glaciated (brighter shades of green) clouds that produced snow squalls as it moved rapidly eastward across Pennsylvania on 19 February 2022. Due to the fast motion of the snow squall band, resultant snowfall amounts were generally 1 inch or less at most locations — but the visibility often quickly dropped to near zero due to intense snowfall rates and gusty winds. For example, as the snow squall moved through State College just after 16 UTC, the surface visibility went from 10 miles to less than 1/4 mile and then back to 10 miles within 30 minutes (below).
Time series of surface observation data at State College, Pennsylvania [click to enlarge]
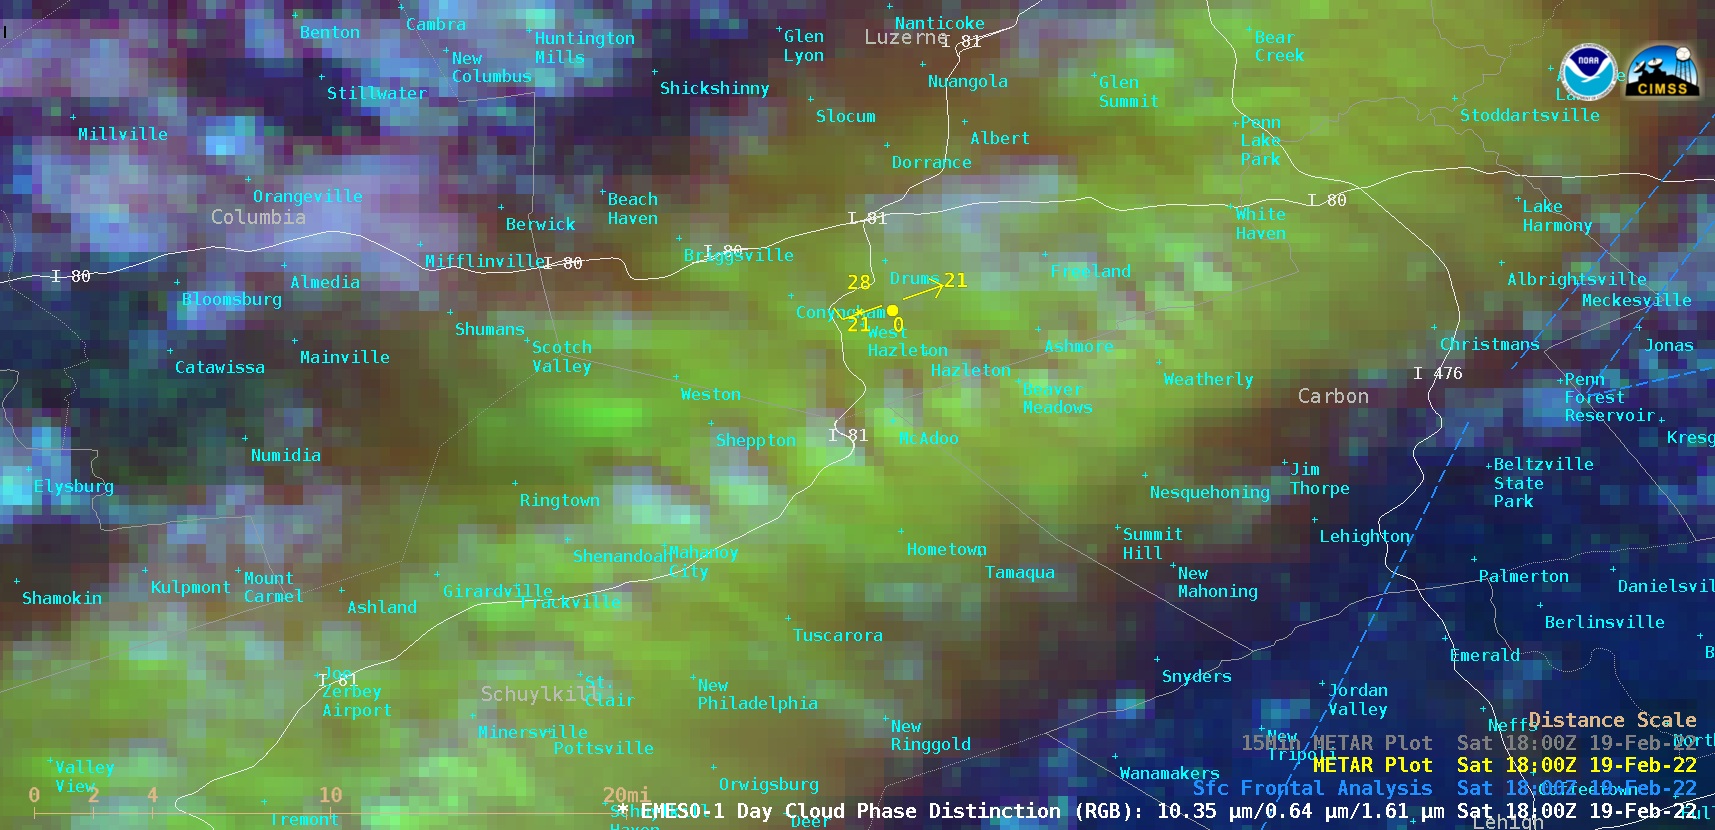
In far eastern Pennsylvania, snow squalls caused a 50-vehicle pileup on Interstate 81, closing the section between the McAdoo and Hazelton exits for about 6 hours (media report) — the accident occurred as the snow squall band was moving through that area around 18 UTC, as seen in a closer view of GOES-16 Day Cloud Phase Distinction RGB images (below) .

GOES-16 Day Cloud Phase Distinction RGB images [click to play animated GIF | MP4]
In a before/after toggle between GOES-16 Day Cloud Phase Distinction RGB images at 1724 UTC and 1900 UTC below), the dark blue signature of bare ground in the Hazelton area prior to the arrival of the snow squall was replaced by a darker green signature of snow-covered ground.
GOES-16 Day Cloud Phase Distinction RGB images at 1724 UTC and 1900 UTC [click to enlarge]
As was seen with the snow squall passage at State College, a brief but rapid drop in surface visibility occurred at Hazelton (below) as the squall passed through around 18 UTC.
Time series of surface weather data at Hazelton, Pennsylvania [click to enlarge]
View only this post Read Less

