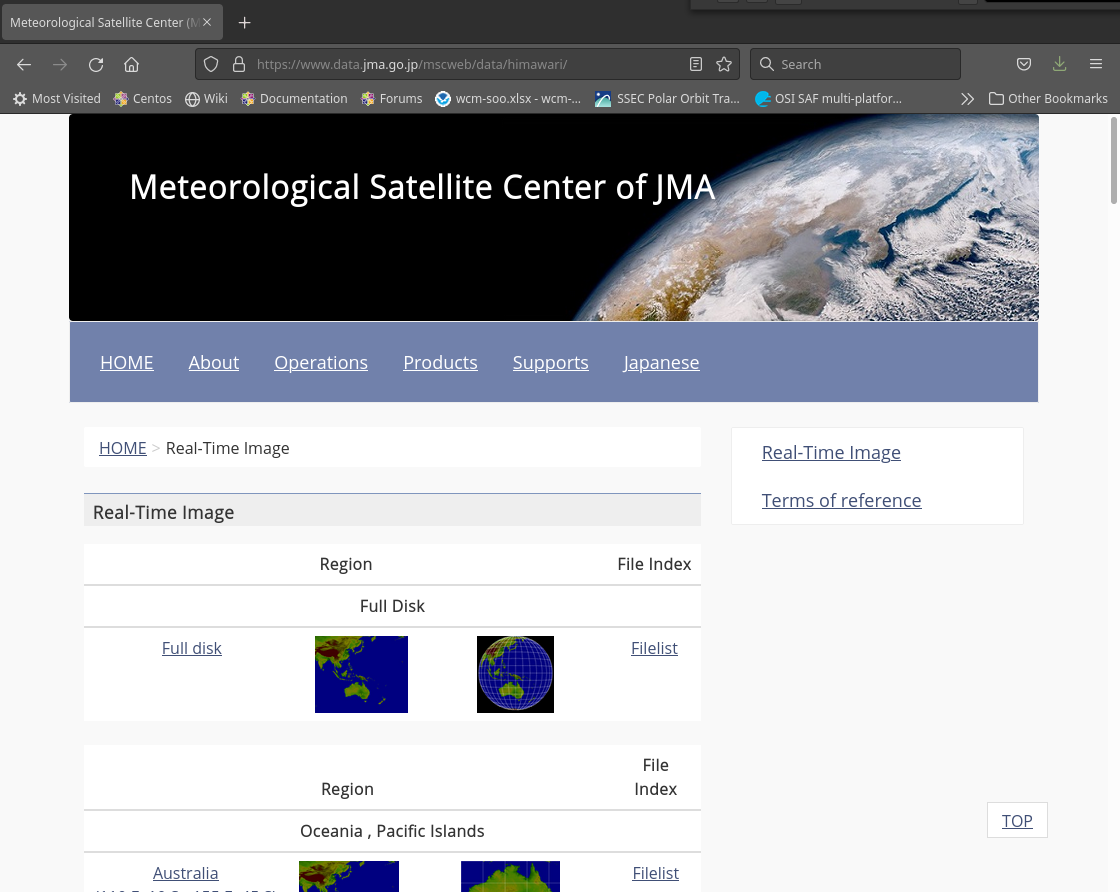
The Japan Meteorological Agency (JMA) maintains a website that has imagery in various sectors under Himawari-8’s gaze. This blog post will describe how to automatically access those data. This is useful if you want to create and maintain a long archive of imagery. The front page of the website is shown here. At the top of the image you’ll see Full Disk thumbnails that you can click on, and if you scroll down, you’ll see subsected regions, such as Australia, various Pacific Island groups, regions of southeast Asia, etc. Note especially that each sector has a Filelist link you can click — more on that later.
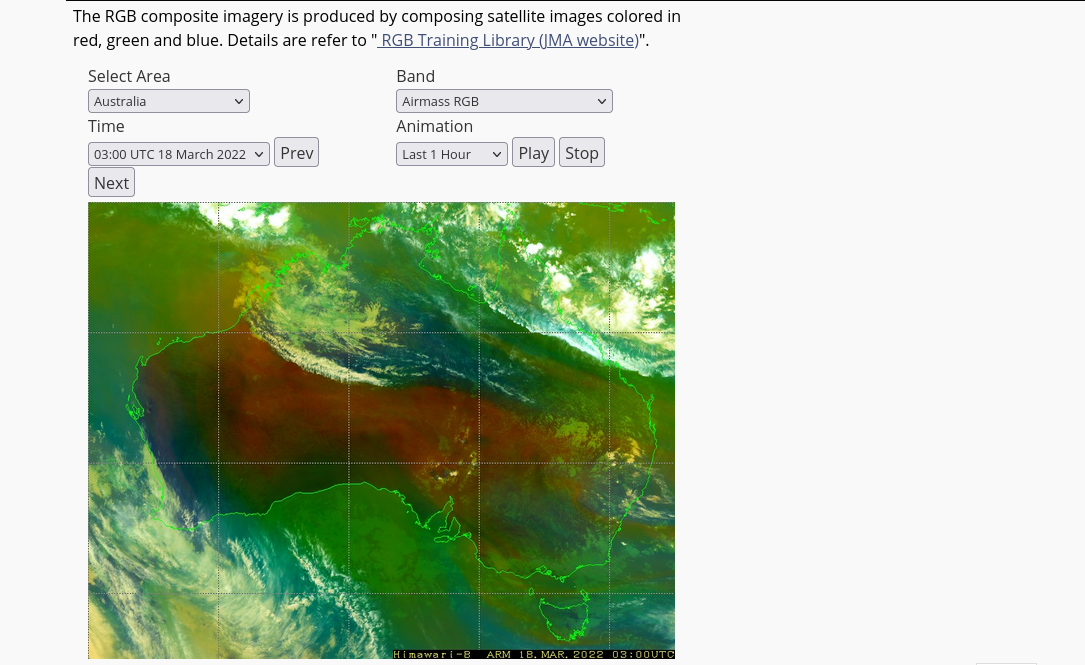
If you click (for example) on Southeast Asia 1, you will see a website (below) that includes drop-down menus, and an imagery window, as shown below, with and without annotations. You can choose a different area, a different time (within the past 24 hours) to display, control animation length (1, 3, 6, 12, 18 or 23 hours), and choose which Band to display.
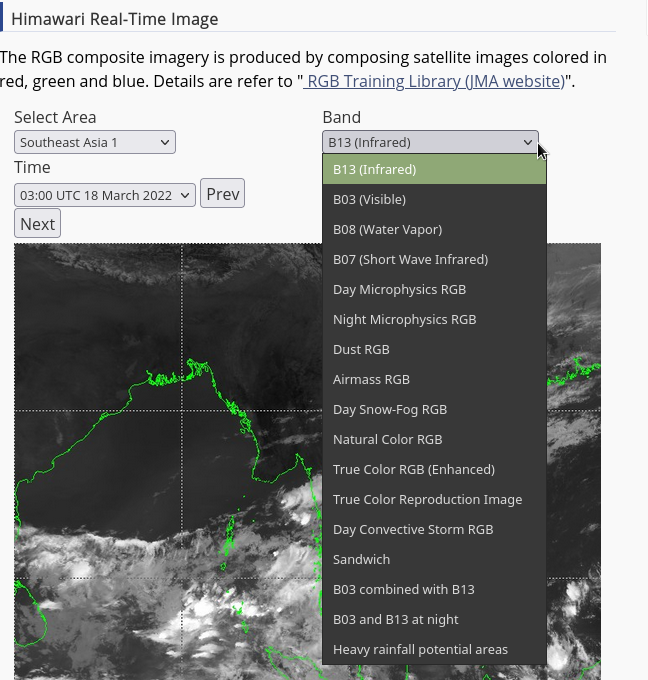
The Bands to display are shown below. The individual bands are grey-scaled. The RGBs available are discussed at this JMA site — this is also the link shown right above the Band Drop-down Menu (“RGB Training Library (JMA Website)“)
The Filelist link will take you to the directory (here is the one for Southeast Asia 1, here’s the one for Pacific Islands 1) where the images that are displayed on the website are stored. This is a 24-hour archive of subsected imagery. The imagery is not generally full-resolution, although there are small sectors that do show full-resolution: over the Solomon Islands, over Vanuatu, and over Fiji. In general, resolution is sacrificed for ease of access.
Because the files for each sectors are always in the same place (the same url), it is straightforward to write up a unix cron job to access the imagery and save it. A shell script to use is shown below. wget calls access the data — in this case Pacific Island Group 1 (pi1) — and move it to your local machine for images separated by 10 minutes. Then a directory is created into which the data are then moved. I have a shell script like this that runs every day just before 0000 UTC to gather the 142 files created over the course of the day. The animation created from the imagery (Sandwich Product — the snd in the file name! — over Pacific Island Region 1, which region includes Guam) for 17 March 2022 is shown at the top of this blog post. (Here’s a similar animation for 16 March 2022). One could accumulate data over a small region every day and create a very long animation.
#!/bin/sh/
cd /home/scottl/JMA/
wget -r https://www.data.jma.go.jp/mscweb/data/himawari/img/pi1/pi1_snd_0000.jpg .
wget -r https://www.data.jma.go.jp/mscweb/data/himawari/img/pi1/pi1_snd_0010.jpg .
.
.
.
wget -r https://www.data.jma.go.jp/mscweb/data/himawari/img/pi1/pi1_snd_2350.jpg .
DIRNAME=`date '+PI1SND%m%d%y'`
mkdir $DIRNAME
FILENAME=`date '+pil_snd_0000_%m%d%y'.gif`
out=`mv /home/scottl/JMA/www.data.jma.go.jp/mscweb/data/himawari/img/pi1/pi1_snd_0000.jpg /home/scottl/JMA/$DIRNAME/$FILENAME`
FILENAME=`date '+pil_snd_0010_%m%d%y'.gif`
out=`mv /home/scottl/JMA/www.data.jma.go.jp/mscweb/data/himawari/img/pi1/pi1_snd_0010.jpg /home/scottl/JMA/$DIRNAME/$FILENAME`
.
.
.
FILENAME=`date '+pil_snd_2350_%m%d%y'.gif`
out=`mv /home/scottl/JMA/www.data.jma.go.jp/mscweb/data/himawari/img/pi1/pi1_snd_2350.jpg /home/scottl/JMA/$DIRNAME/$FILENAME`
rm -rf www.data.jma.go.jp/
Be mindful that you are using an image created by someone else! It’s always a good idea to include attribution, in this case back to JMA, when you show the imagery.
View only this post Read Less


