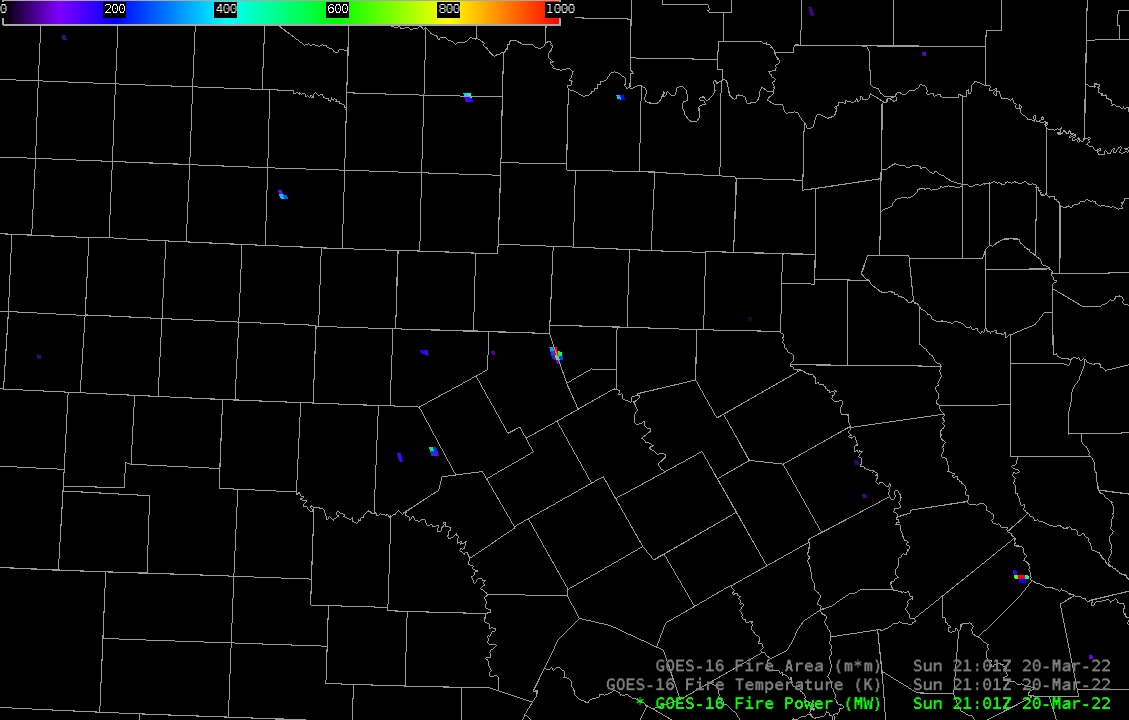
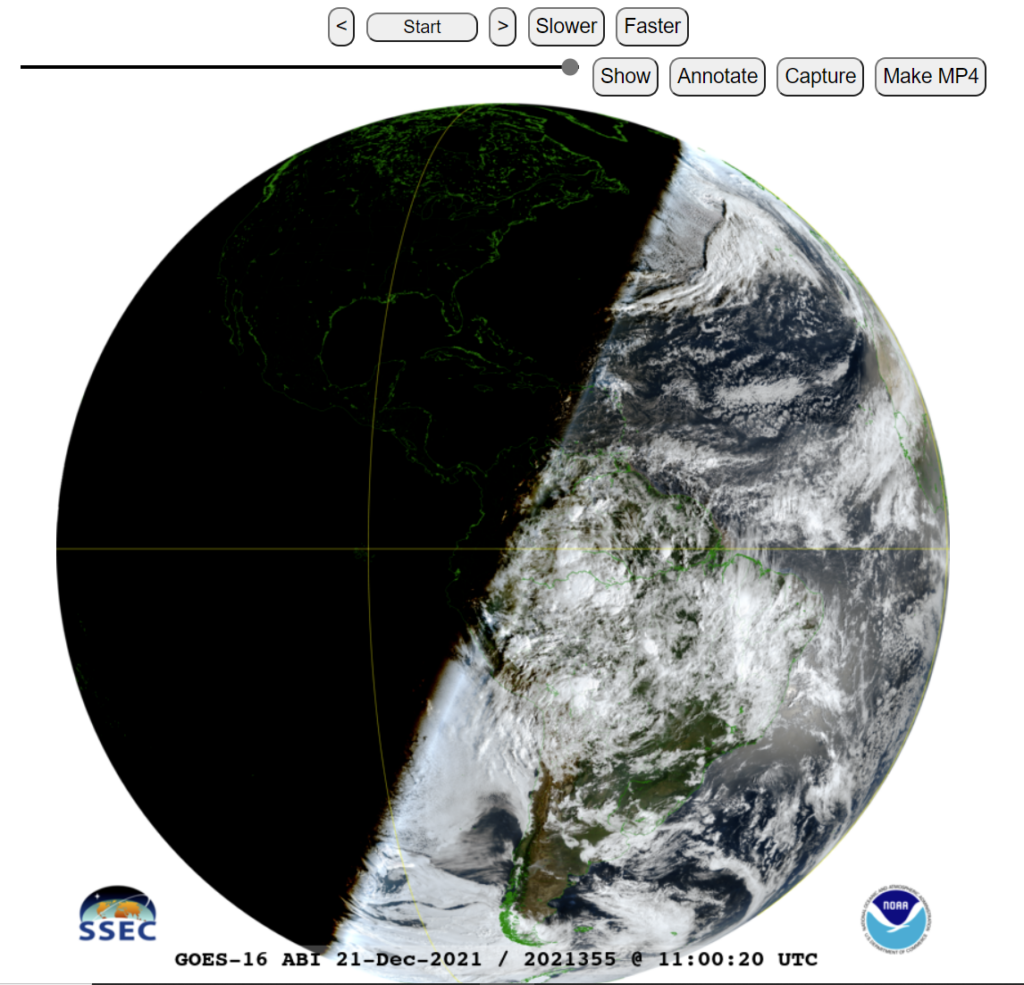
The image below shows GOES-16 Fire Power, a Fire Detection/Characterization Algorithm (FDCA) output field (along with Fire Temperature and Fire Area), on a day when strong southerly winds helped support multiple fires over Texas (as shown in this animation, from this blog post). If you do not have access to AWIPS, as below (or in the linked-to animation), are there other ways to access and display FDCA output? This blog post shows how to do that with McIDAS-V.
Where can you get the FDCA data to display? The NOAA CLASS data respository is one place. The toggle below outlines the products to choose in the drop-down menu (“GOES-R Series ABI Products (GRABIPRD) partially restricted L1b and L2+ Data Products”) near the top of the CLASS home page (then click on the >>GO), and then shows how to select the data wanted. In the example below, I’ve chosen the ABI L2+ GOES-16 CONUS files of Fire/Hot Spot Characterization on 20 March 2022 between 21:00 and 21:04. After making those selections, click on ‘Search’ and then order. When the files are queued up for retrieval, you’ll receive an email with instructions.
You can also access GOES-R data through this website below hosted at the University of Utah. (Kudos to Brian Blaylock, its developer!) Note in the animation below how you choose the satellite, the product and the time, and then receive a list of downloadable files.
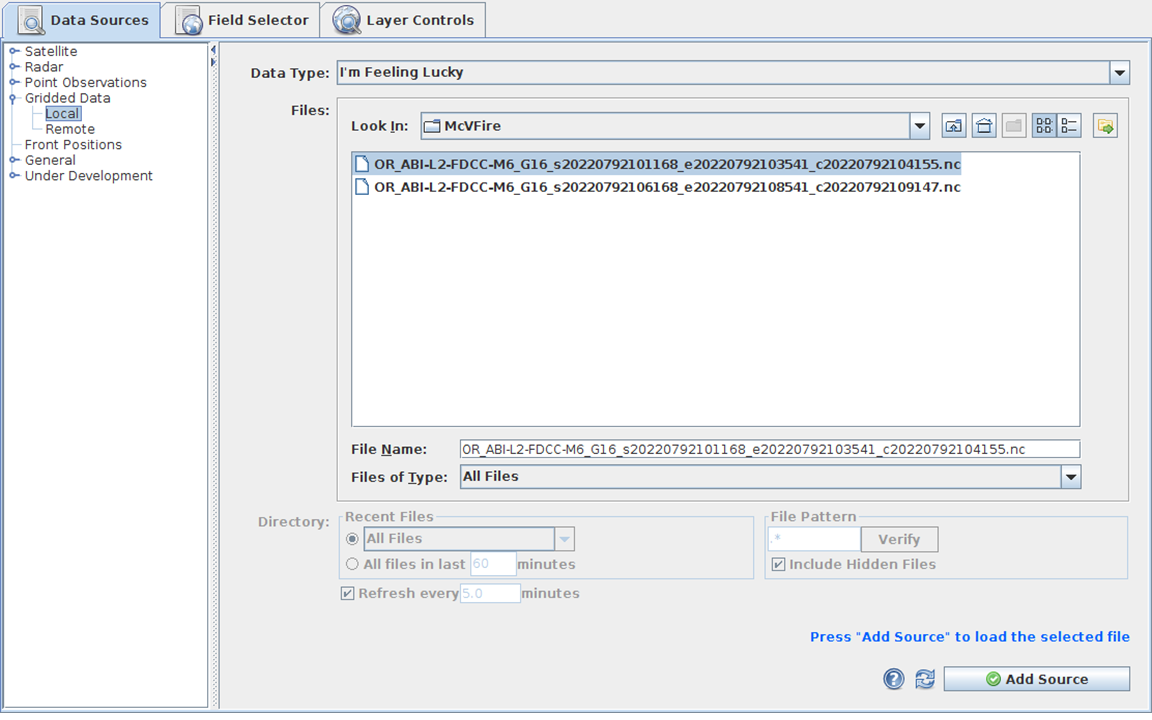
You can start up McIDAS-V to view the data once you have downloaded to your machine the data file:
OR_ABI-L2-FDCC-M6_G16_s20220792101168_e20220792103541_c20220792104155.ncFDCC in the filename signifies Fire Detection Characterization in the CONUS domain, created with Mode 6 scanning (M6) and GOES-16 data (G16). The data starts at 21:01:16.8 on 20 March (Julian Day 79) in 2022, i.e., 20220792101168 and ends at 21:03:54.1 on the same day. It was created at 21:04:15.5. Once you start McIDAS-V, you must input the data, via the Data Sources tab within the Data Explorer. The satellite data we’re using are gridded data, and they’re local. Select the file needed for display and click ‘Add Source’. When you do that, you’ll see a different window (‘Field Selector’) brought to the front.
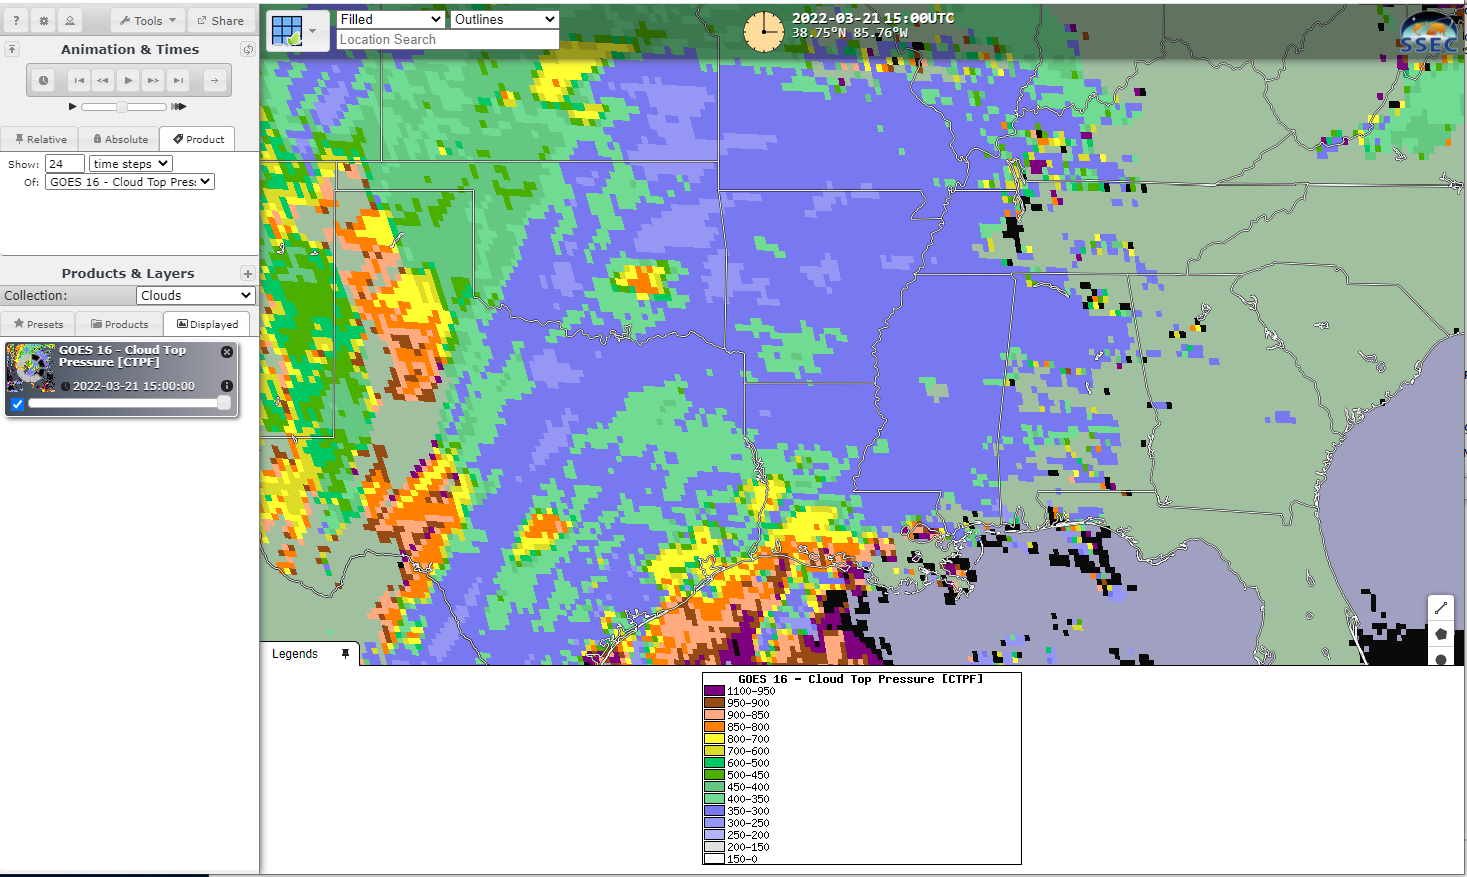
Note in this example that 5 different fields are present in the file: Fire + Hot Spot Characterization Fire Area, Fire Temperatures, Fire Mask, Fire Radiative Power and Data Quality Flags. In this example, I’ve selected ‘Data Quality Flags’ — to be presented as ‘Value Plots’; those are shown below in a region zoomed in over Texas and annotated.
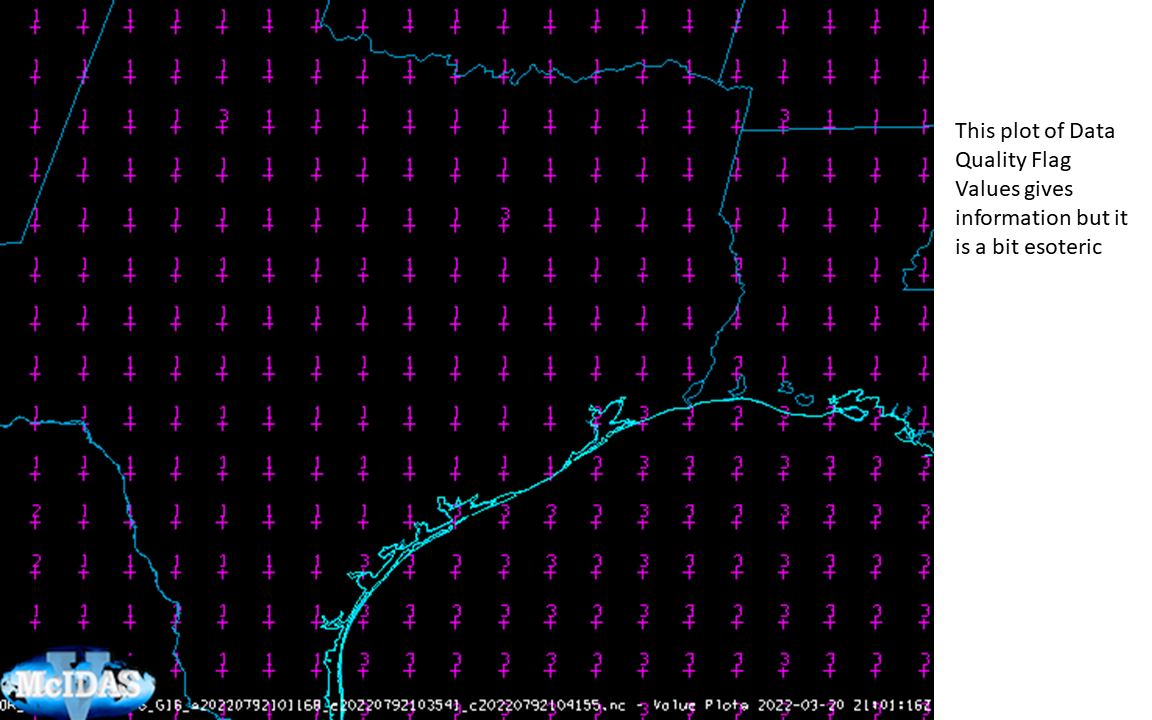
Rather than Data Quality Flags, one can show ‘Fire Mask’ — these data values are available in AWIPS files, but aren’t generally shown. So, I recreated the ‘Value Plots’ but selected ‘Fire Mask’ rather than ‘data quality Flags’; Next, I created a ‘Color-Shaded Plan View’ (the Data Explorer for that is shown here, created with ‘Match Display Region’ chosen). The animation below steps through the plotted values, the color-shaded plan view with default enhancement, and the color-shaded plan view with a McIDAS Enhancement Table appropriate to the Fire Mask (clouds, for example, are grey, and fires stand out against the background). (This pdf describes what the file mask values mean).
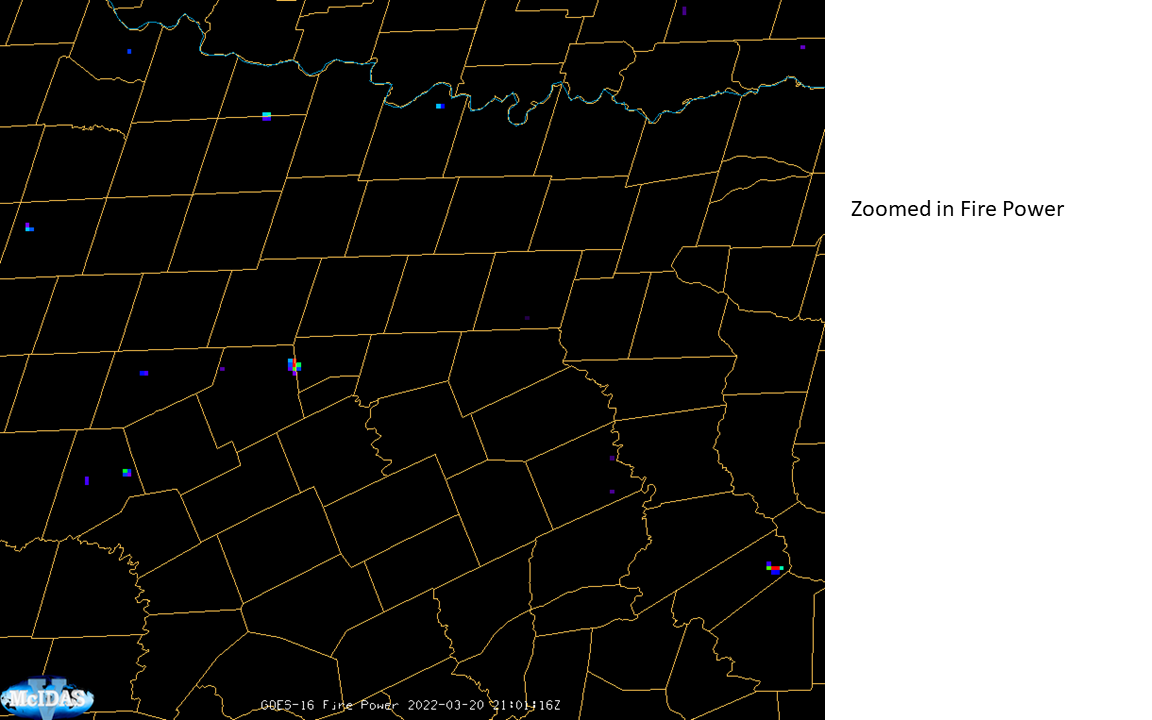
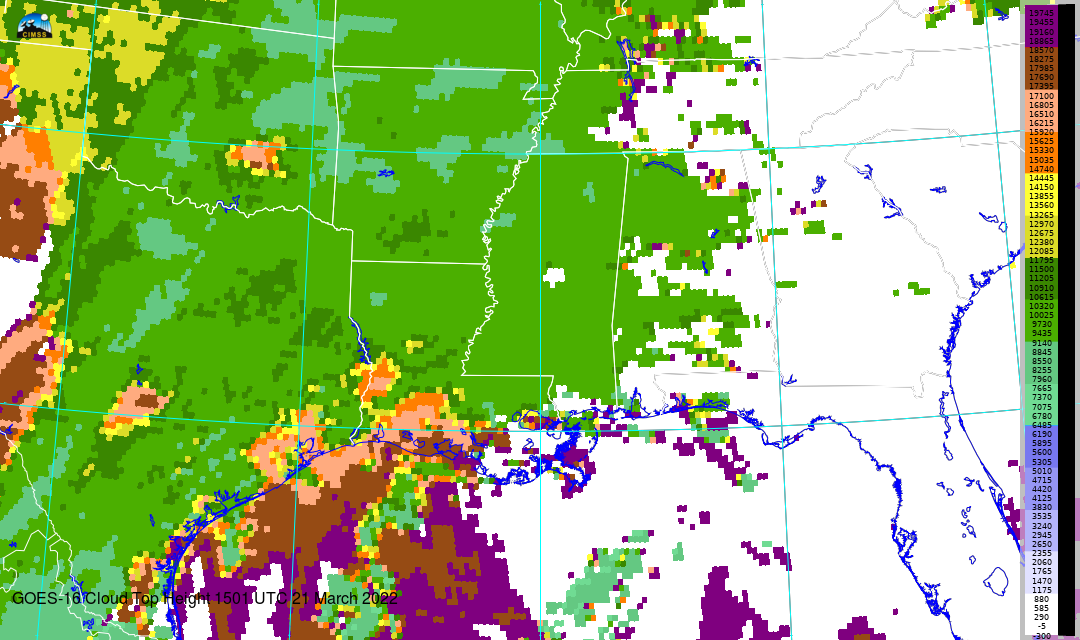
This toggle compares Fire Mask, and Fire Power. A zoom in on Fire Power to north Texas, below, shows the same data as the AWIPS screen grab at the top of this blog post. They are nearly identical.
Use McIDAS-V to display Level 2 products if it is difficult to find them online.
View only this post Read Less


