
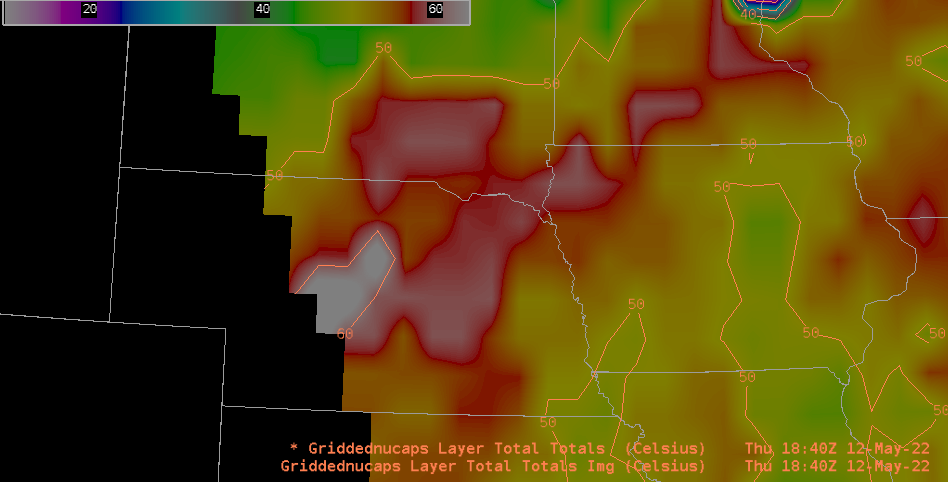
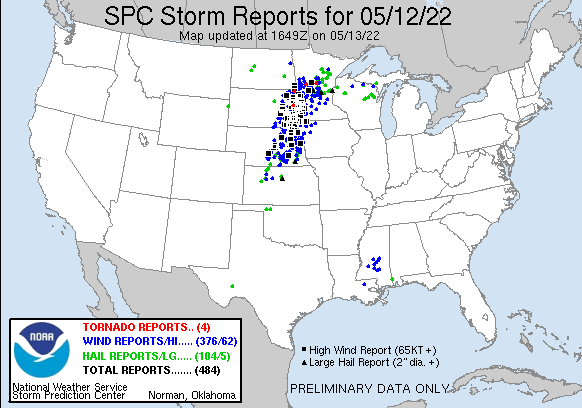
A narrow ribbon of Slight RIsk was forecast for parts of the midwest on 13 Friday 2022, as shown below, and a few severe weather events occurred (SPC Storm Reports); they were well forecast. How did the Polar Hyperspectral Sounding forecast system perform on this day? The toggle above shows a 7-h forecast of CAPE (initialized at 1600 UTC and valid at 2300 UTC). It’s noteworthy that the forecast also shows a narrow corridor of instability. A similar toggle, but starting with the 0-h initial field of PHSnABI derived CAPE from the model at 2200 UTC, is here.
The toggle below shows the 7-h forecast compared to the GOES-16 ABI Derived CAPE. A similar toggle, here, compares the 1-h forecast (initialized at 2200 UTC, valid at 2300 UTC) with the 2300 UTC Derived CAPE observed from GOES. The 7-h forecast below might be too far to the east; however, the developing convection associated with ribbon of instability is removed from the leading edge of the CAPE.
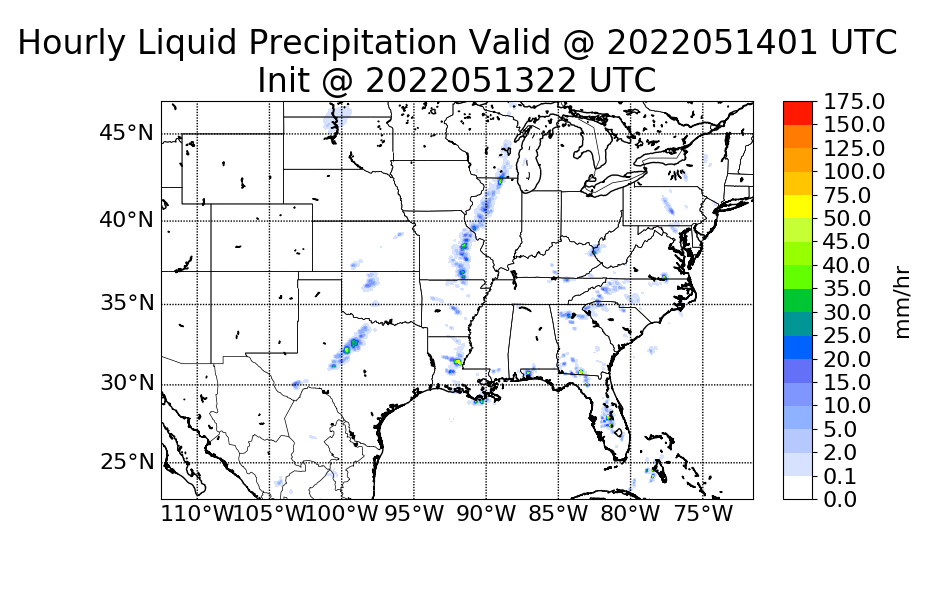
Precipitation forecasts from this event (available at this website) are shown below, starting with two forecasts valid at 2300 UTC: a 3-h forecast from 2000 UTC and a 1-h forecast from 2200 UTC. They both show strongest convection over western IL, as observed. The 2000 UTC forecast also shows the break in convection over southern WI, also as observed.

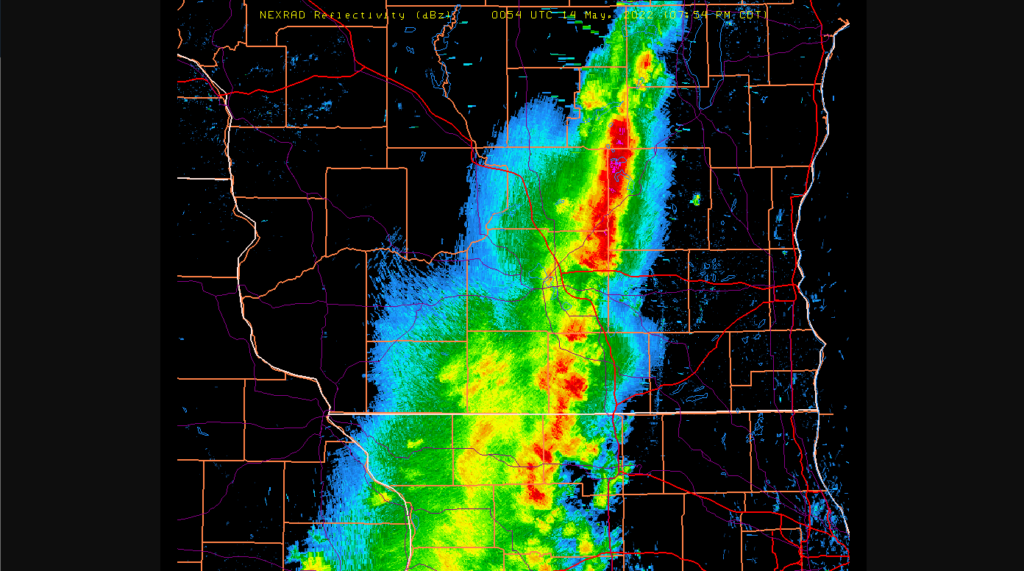
The PHSnABI modeling system accurately showed the corridor of instability over the Great Lakes, and convection did develop with this instability as observed. (Note: forecasts initialized before 1700 UTC did not produce precipitation; observations from the afternoon overpasses of NOAA-20 and Suomi-NPP perhaps supplied the necessary information leading to a better prediction of precipitation). Radar imagery over WI at 0054 UTC on 14 May 2022 is shown below. The initial (very narrow) line of convection did produce precipitation over Madison, but precipitation moved over Madison from the south after 0100 UTC.
View only this post Read Less


