This website works best with a newer web browser such as Chrome, Firefox, Safari or Microsoft
Edge. Internet Explorer is not supported by this website.
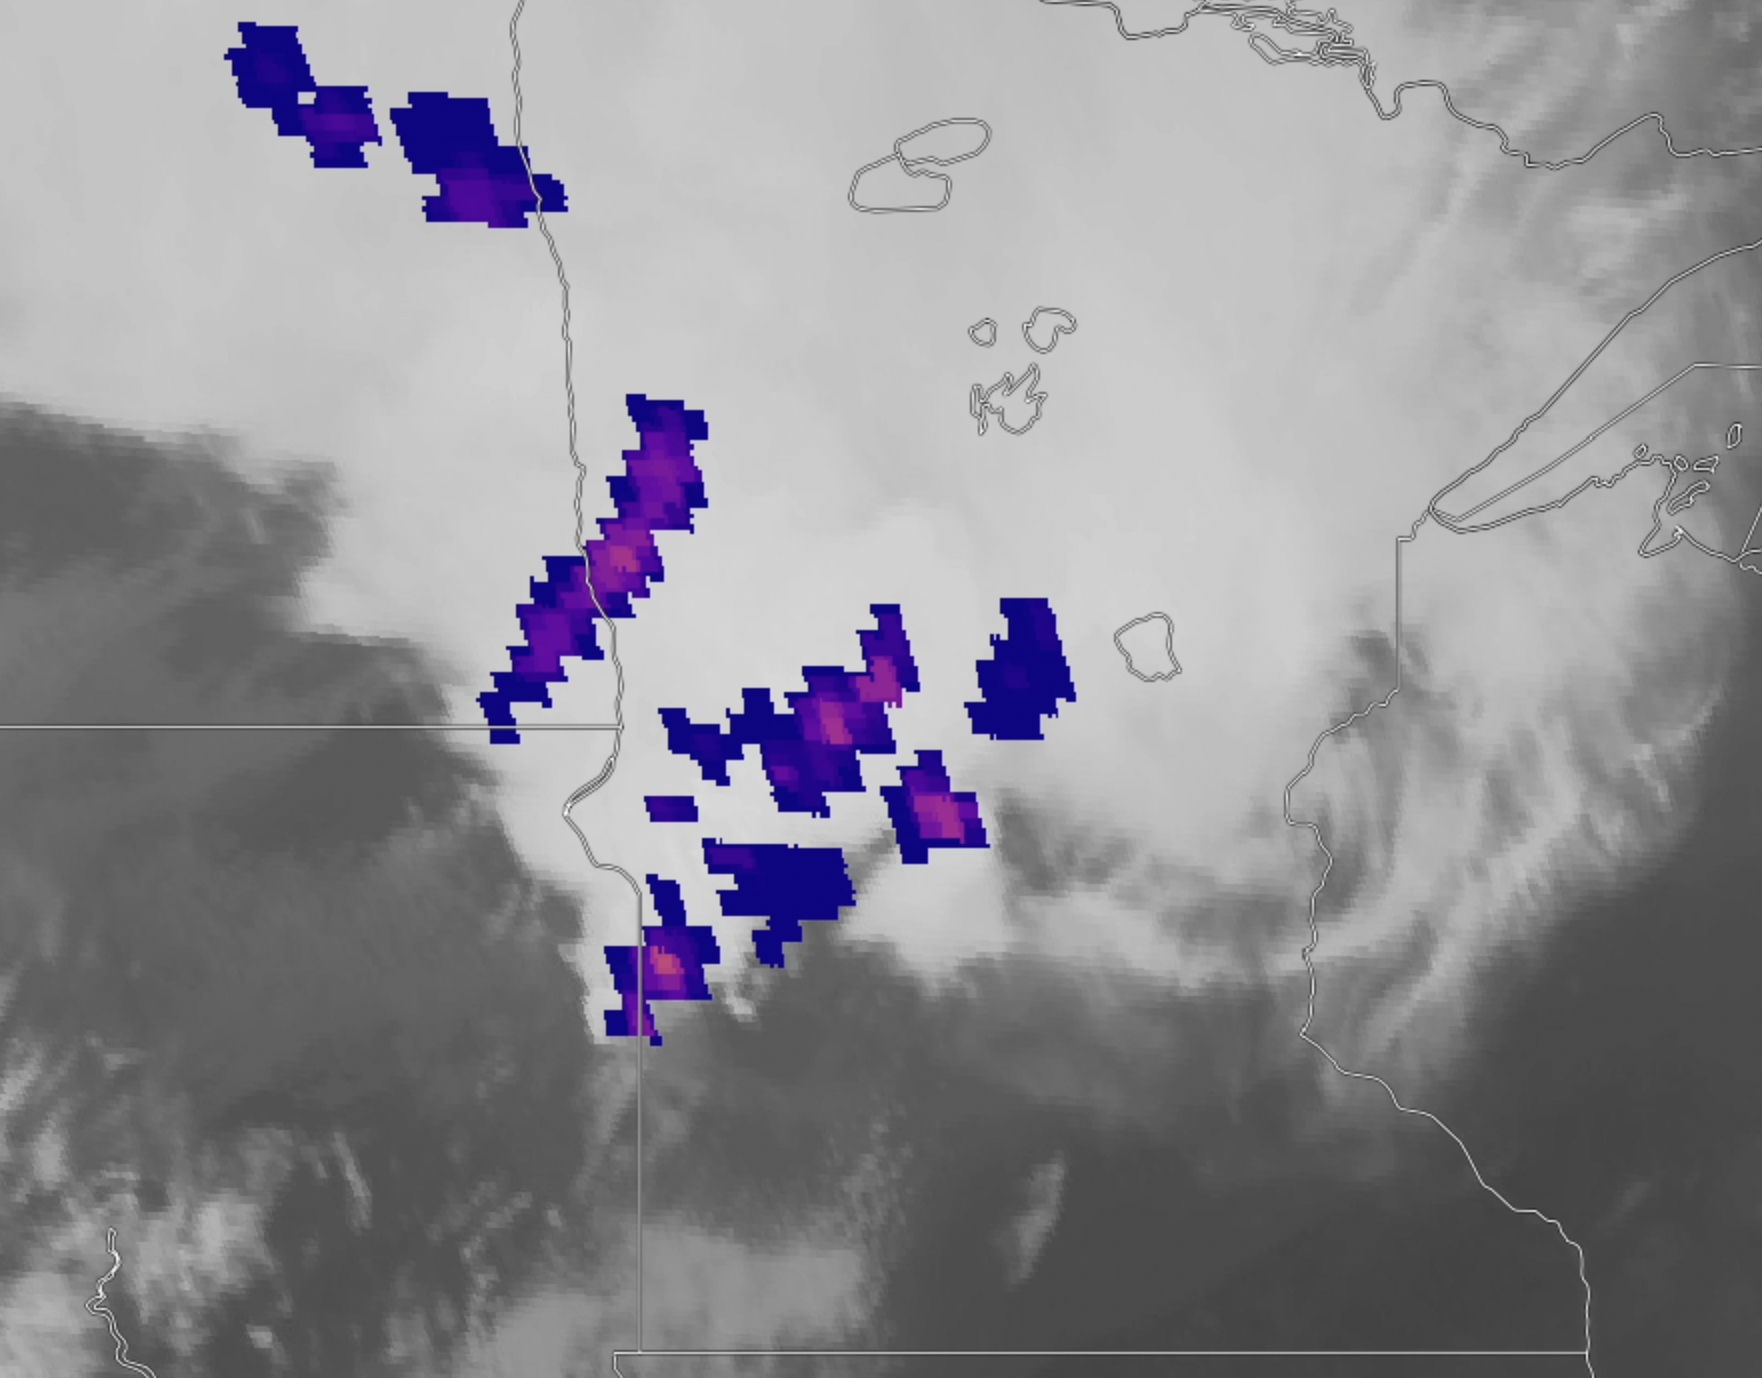
Wednesday, 05-11-2022, brought storm damage and copious amounts of lightning over Minnesota and parts of South Dakota, Iowa, and Wisconsin. The GOES-16 Geostationary Lightning Mapper (GLM) detected the flash extent density over these areas. A NEXRAD radar composite shows a large bow echo signature around 05-12-2022 01:25Z that spanned the... Read More
Wednesday, 05-11-2022, brought storm damage and copious amounts of lightning over Minnesota and parts of South Dakota, Iowa, and Wisconsin. The GOES-16 Geostationary Lightning Mapper (GLM) detected the flash extent density over these areas. A NEXRAD radar composite shows a large bow echo signature around 05-12-2022 01:25Z that spanned the entire lower half of Minnesota. Storms are still currently pushing through eastern Minnesota and northern Wisconsin and forecast to bring severe thunderstorms throughout the afternoon. There are also continuing threats of flooding in the Twin Cities and surrounding areas.
GOES-16 GLM Flash Extent Density and Band 13 reflectance on 05-12-2022 from 00:03 UTC to 16:43 UTC.GOES-16 Band 13 reflectance with NEXRAD Reflectivity on 05-12-2022 from 00:05 UTC to 16:45 UTC.
The GOES-16 GLM Flash Extent Density product is available on RealEarth here. Near-real-time GLM visualizations are available as well as archived visualizations of GLM going back 3-4 days.
NOAA and NASA recently released the first ABI (Advanced Baseline Imager) imagery from GOES-18 (including this 2-min video). GOES-T was launched on March 1st. In fact, both GOES-16 and GOES-17 monitored the rocket signature. GOES-18 is the third in the GOES-R series and is currently located above approximately 90W. Soon GOES-18 will move to a “near West”... Read More
NOAA and NASA recently released the first ABI (Advanced Baseline Imager) imagery from GOES-18 (including this 2-min video). GOES-T was launched on March 1st. In fact, both GOES-16 and GOES-17 monitored the rocket signature. GOES-18 is the third in the GOES-R series and is currently located above approximately 90W. Soon GOES-18 will move to a “near West” position. GOES-18 is slated to become NOAA’s operational GOES-West in early 2023 after going through many tests. Before that, the ABI on GOES-18 will become the operational imager during two GOES-17 Loop Heat Pipe times. Also see this satellite liaison post.
Spectral Loop of 16 bands (from the Full Disk sector)
A true color composite image, along with all 16 spectral bands of the preliminary, non-operational GOES-18 ABI on May 5, 2022.
The above loop as an mp4 and animated gif. The ABI has 16 spectral bands, 2 in the visible, 4 in the near-infrared (or “near-visible”) and 10 in the infrared part of the electromagnetic spectrum. There are also ABI band “fact sheets” in Spanish and French.
Another view of the 16 spectral bands of the ABI, both as an mp4 and animated gif. Or see this loop of the true color imagery during the day and an infrared window at night.
The 16 spectral bands of the ABI on May 5, 2022 at 18 UTC.
The “low-level” water vapor band (10) is very important. A loop showing 2 low’s over North America.
GOES-18 ABI “water vapor” band 10 (7.3 micrometers) loop from May 5 and 6, 2022. (click to play)
Of course the ABI Full Disk sectors also views over much of the disk, including of Hudson Bay with a day snow fog RGB (mp4) and South America (fog and suspended sediment).
Ice and clouds over Hudson Bay from GOES-18 RGB on May 5, 2022. (click to play)Fog along the west coast of South America on May 5, 2022 as seen by the GOES-18 ABI day snow fog RGB. (click to play)True color imagery showing the suspended sediment of the South American coast on May 5, 2022. (click to play)A combined full disk GOES-18 loop over a day (true color and longwave window) from May 6 and 7, 2022.
ABI 16-Panel (CONUS region)
The 16 spectral bands of the (Preliminary/Non-operational) GOES-18 ABI from May 5, 2022. (Click to play)The 16 spectral bands of the (Preliminary/Non-operational) GOES-18 ABI from May 6, 06 UTC to May 7, 06 UTC. (Click to play)
The ABI has 16 spectral bands, 2 in the visible, 4 in the near-infrared (or “near-visible”) and 10 in the infrared part of the electromagnetic spectrum. GOES-18 image covering the contiguous United States collected by the Advanced Baseline Imager (ABI) in 16 spectral bands on May 5, 2022. This 16-panel image shows the two visible, four near-infrared and 10 infrared channels on the ABI. The visible near-IR bands are gray-colored, while the infrared bands have the warmer brightness temperatures mapped to warmer colors. The different appearance of each band is due to how each band reflects or absorbs radiation. Each spectral band was scanned at approximately the same time, starting at approximately 18 UTC. The above mp4 loop and one of the frames.
Meso-scale sectors
The ABI scans two smaller meso-scale regions every 60 seconds, which provides 30-sec imagery if the regions overlap. These channels help forecasters and others distinguish phenomena such as clouds, water vapor, fires, smoke, dust, ice, land/sea surface temperatures and volcanic ash.
A combined visible and infrared “sandwich” view over Minnesota and Wisconsin early on May 11, 2022. Images every one minute. (Click to play)
Recent meso-scale coverage from the GOES-18 ABI include: Texas, New Mexico and Minnesota (mp4 and animated gif). A similar loop, but just showing the ABI “red” visible band.
1-min meso “sandwich” imagery over Texas on May 5, 2022 as seen by GOES-18 ABI. (click to play)
H/T
Thanks to the many (thousands) who made the GOES-18 ABI possible. These GOES-18 ABI are early images (preliminary and non-operational, calibration improvements are possible. Both McIDAS-X and geo2grid software was used in generating these images. More about GOES-16 and GOES-17.
1-minute Mesoscale Domain Sector GOES-16 (GOES-East) “Red” Visible (0.64 µm) images (above) include time-matched SPC Storm Reports — and showed some of the widespread severe weather that occurred across the Upper Midwest during the afternoon and early evening hours on 11 May 2022. Numerous pulsing overshooting tops were apparent in the vicinity of most storm reportsThe corresponding 1-minute GOES-16 “Clean”... Read More
GOES-16 “Red” Visible (0.64 µm) images, with time-matched SPC Storm Reports plotted in red [click to play animated GIF | MP4]
1-minute Mesoscale Domain Sector GOES-16 (GOES-East) “Red” Visible (0.64 µm) images (above) include time-matched SPC Storm Reports — and showed some of the widespread severe weather that occurred across the Upper Midwest during the afternoon and early evening hours on 11 May 2022. Numerous pulsing overshooting tops were apparent in the vicinity of most storm reports
The corresponding 1-minute GOES-16 “Clean” Infrared Window (10.35 µm) images are shown below.
GOES-16 “Clean” Infrared Window (10.35 µm) images, with time-matched SPC Storm Reports plotted in cyan [click to play animated GIF | MP4]
A 3-panel comparison of 1-minute Mesoscale Domain Sector Shortwave Infrared (3.9 µm) images from GOES-17 (GOES-West), GOES-18 (*preliminary, non-operational*) and GOES-16 (GOES-East) (above) showed the hot thermal anomaly (darker black to red pixels) of the Calf Canyon Fire/Hermits Peak Fire in northern New Mexico on 11 May 2022. The images are displayed in the native projection... Read More
Shortwave Infrared (3.9 µm) images from GOES-17 (left), GOES-18 (center) and GOES-16 (right) [click to play animated GIF | MP4]
A 3-panel comparison of 1-minute Mesoscale Domain Sector Shortwave Infrared (3.9 µm) images from GOES-17 (GOES-West), GOES-18 (*preliminary, non-operational*) and GOES-16 (GOES-East)(above) showed the hot thermal anomaly (darker black to red pixels) of the Calf Canyon Fire/Hermits Peak Fire in northern New Mexico on 11 May 2022. The images are displayed in the native projection of each satellite.
Farther to the west, a similar comparison of Shortwave Infrared images from GOES-17 / GOES-18 / GOES-16 — with a different color enhancement applied — is shown for the Coastal Fire in Southern California.
Shortwave Infrared (3.9 µm) images from GOES-17 (left), GOES-18 (center) and GOES-16 (right) [click to play animated GIF | MP4]
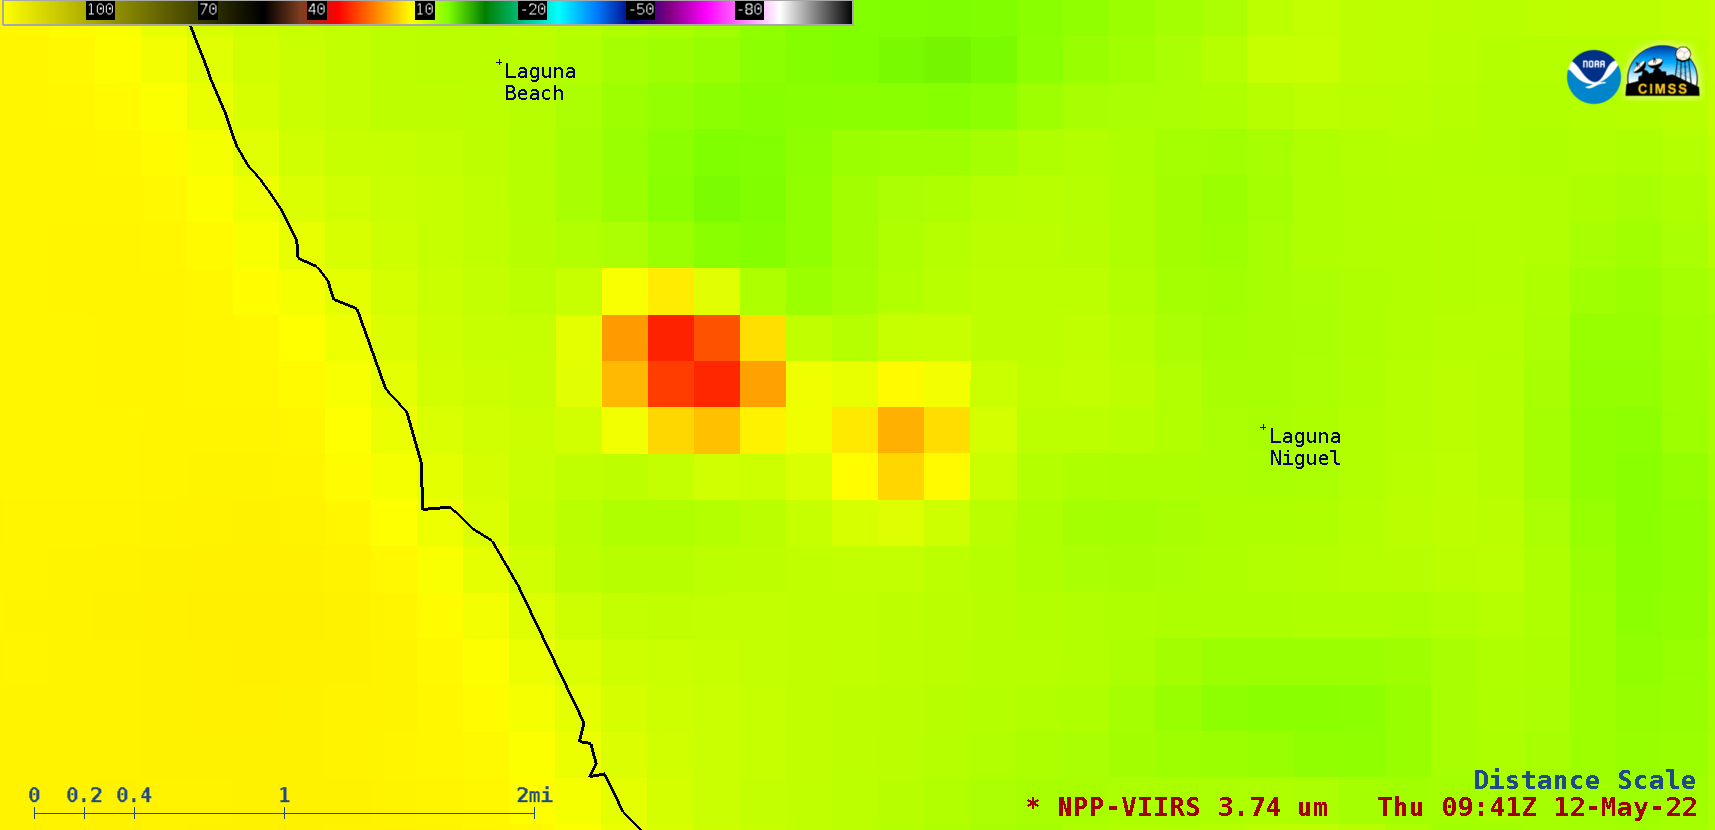
The fire’s thermal signature began to rapidly diminish in GOES imagery by 03 UTC — but a distinct signature was still evident on a 375-meter resolution Suomi-NPP VIIRS Shortwave Infrared (3.74 µm) image at 0941 UTC (below).
Suomi-NPP VIIRS Shortwave Infrared (3.74 µm) image at 0941 UTC [click to enlarge]


