This website works best with a newer web browser such as Chrome, Firefox, Safari or Microsoft
Edge. Internet Explorer is not supported by this website.
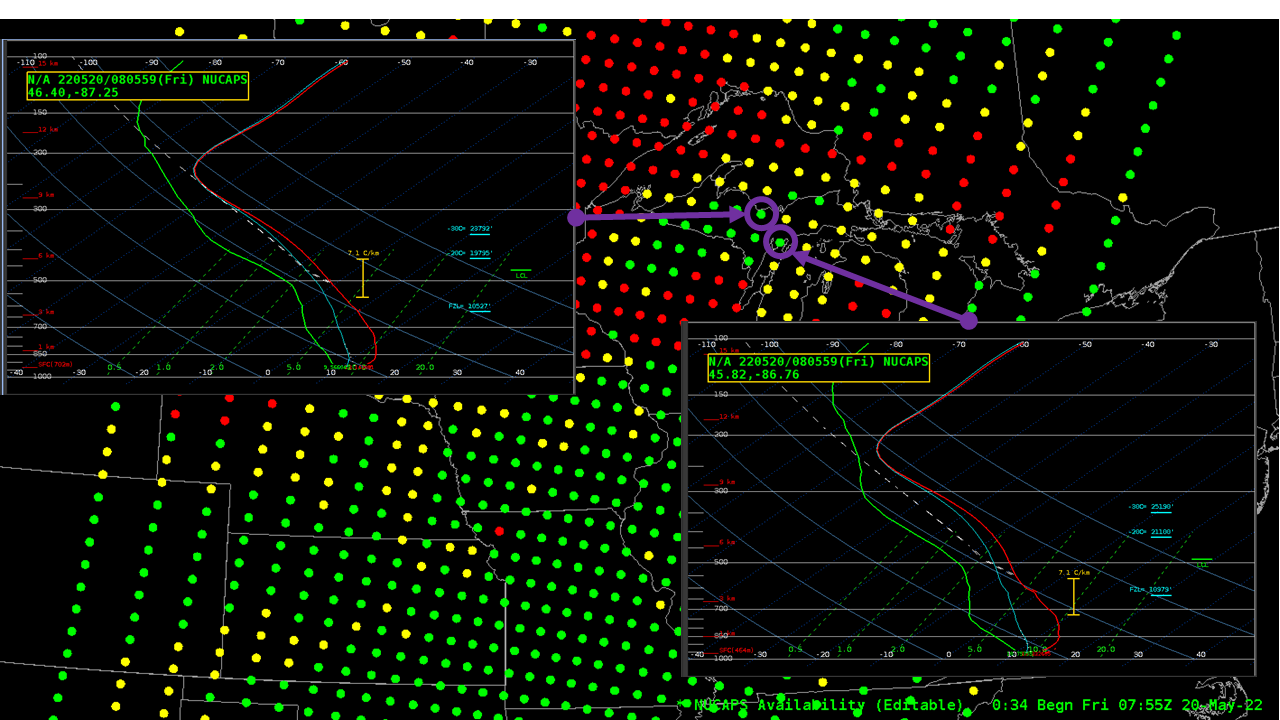
The true-color animation above, produced from the CSPP Geosphere site, shows bore-like cloud features over northern Lake Michigan shortly after sunrise on 20 May 2022. These parallel lines of clouds are mostly likely to persist in regions where a low-level inversion is present. NUCAPS profiles from the 0800 UTC overpass of... Read More
GOES-16 True Color Imagery from the CSPP Geosphere site, 1111 – 1421 UTC on 20 May 2022
The true-color animation above, produced from the CSPP Geosphere site, shows bore-like cloud features over northern Lake Michigan shortly after sunrise on 20 May 2022. These parallel lines of clouds are mostly likely to persist in regions where a low-level inversion is present. NUCAPS profiles from the 0800 UTC overpass of NOAA-20, shown below, show an inversion below 850 mb over the central parts of the Upper Peninsula of Michigan. The cold waters over the lake would likely amplify the strength of this inversion. The Green Bay soundings from 1200 UTC (here, from this site), also shows a low-level stable layer.
NUCAPS Profiles over Upper Michigan as indicated, ca. 0800 UTC on 20 May 2022. NUCAPS Sounding Availability points also shown (click to enlarge).
Thanks to Rick Mamrosh, WFO GRB, for bringing these cloud features to our attention! Check out the link on their Facebook page.
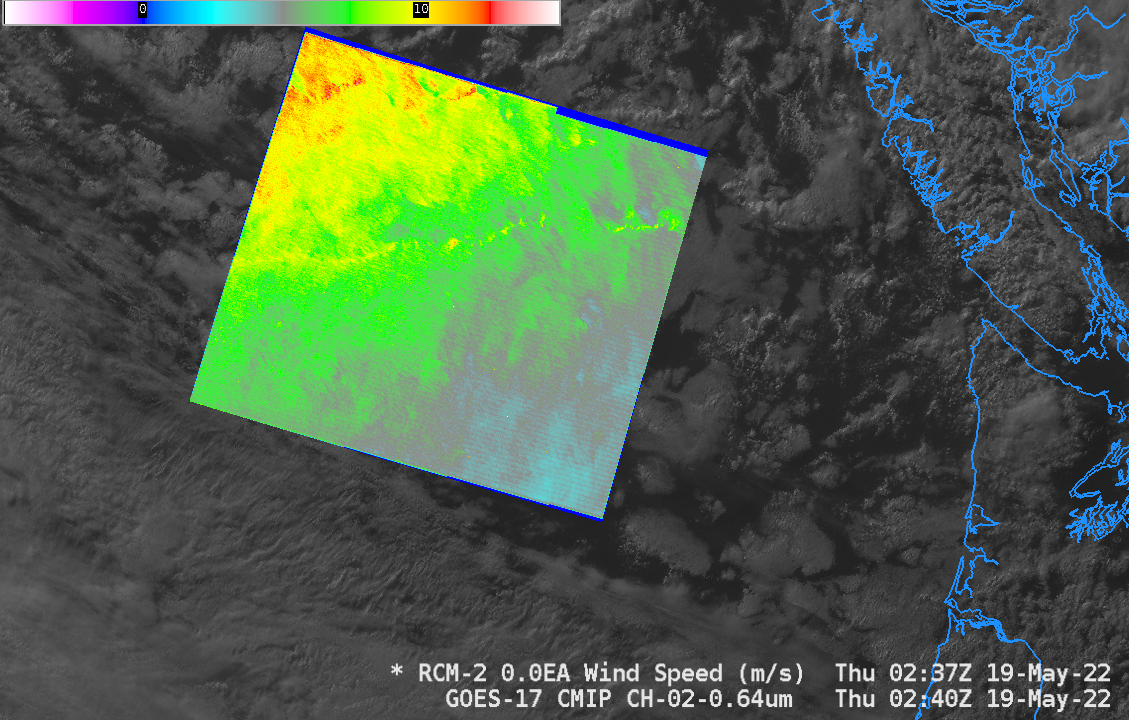
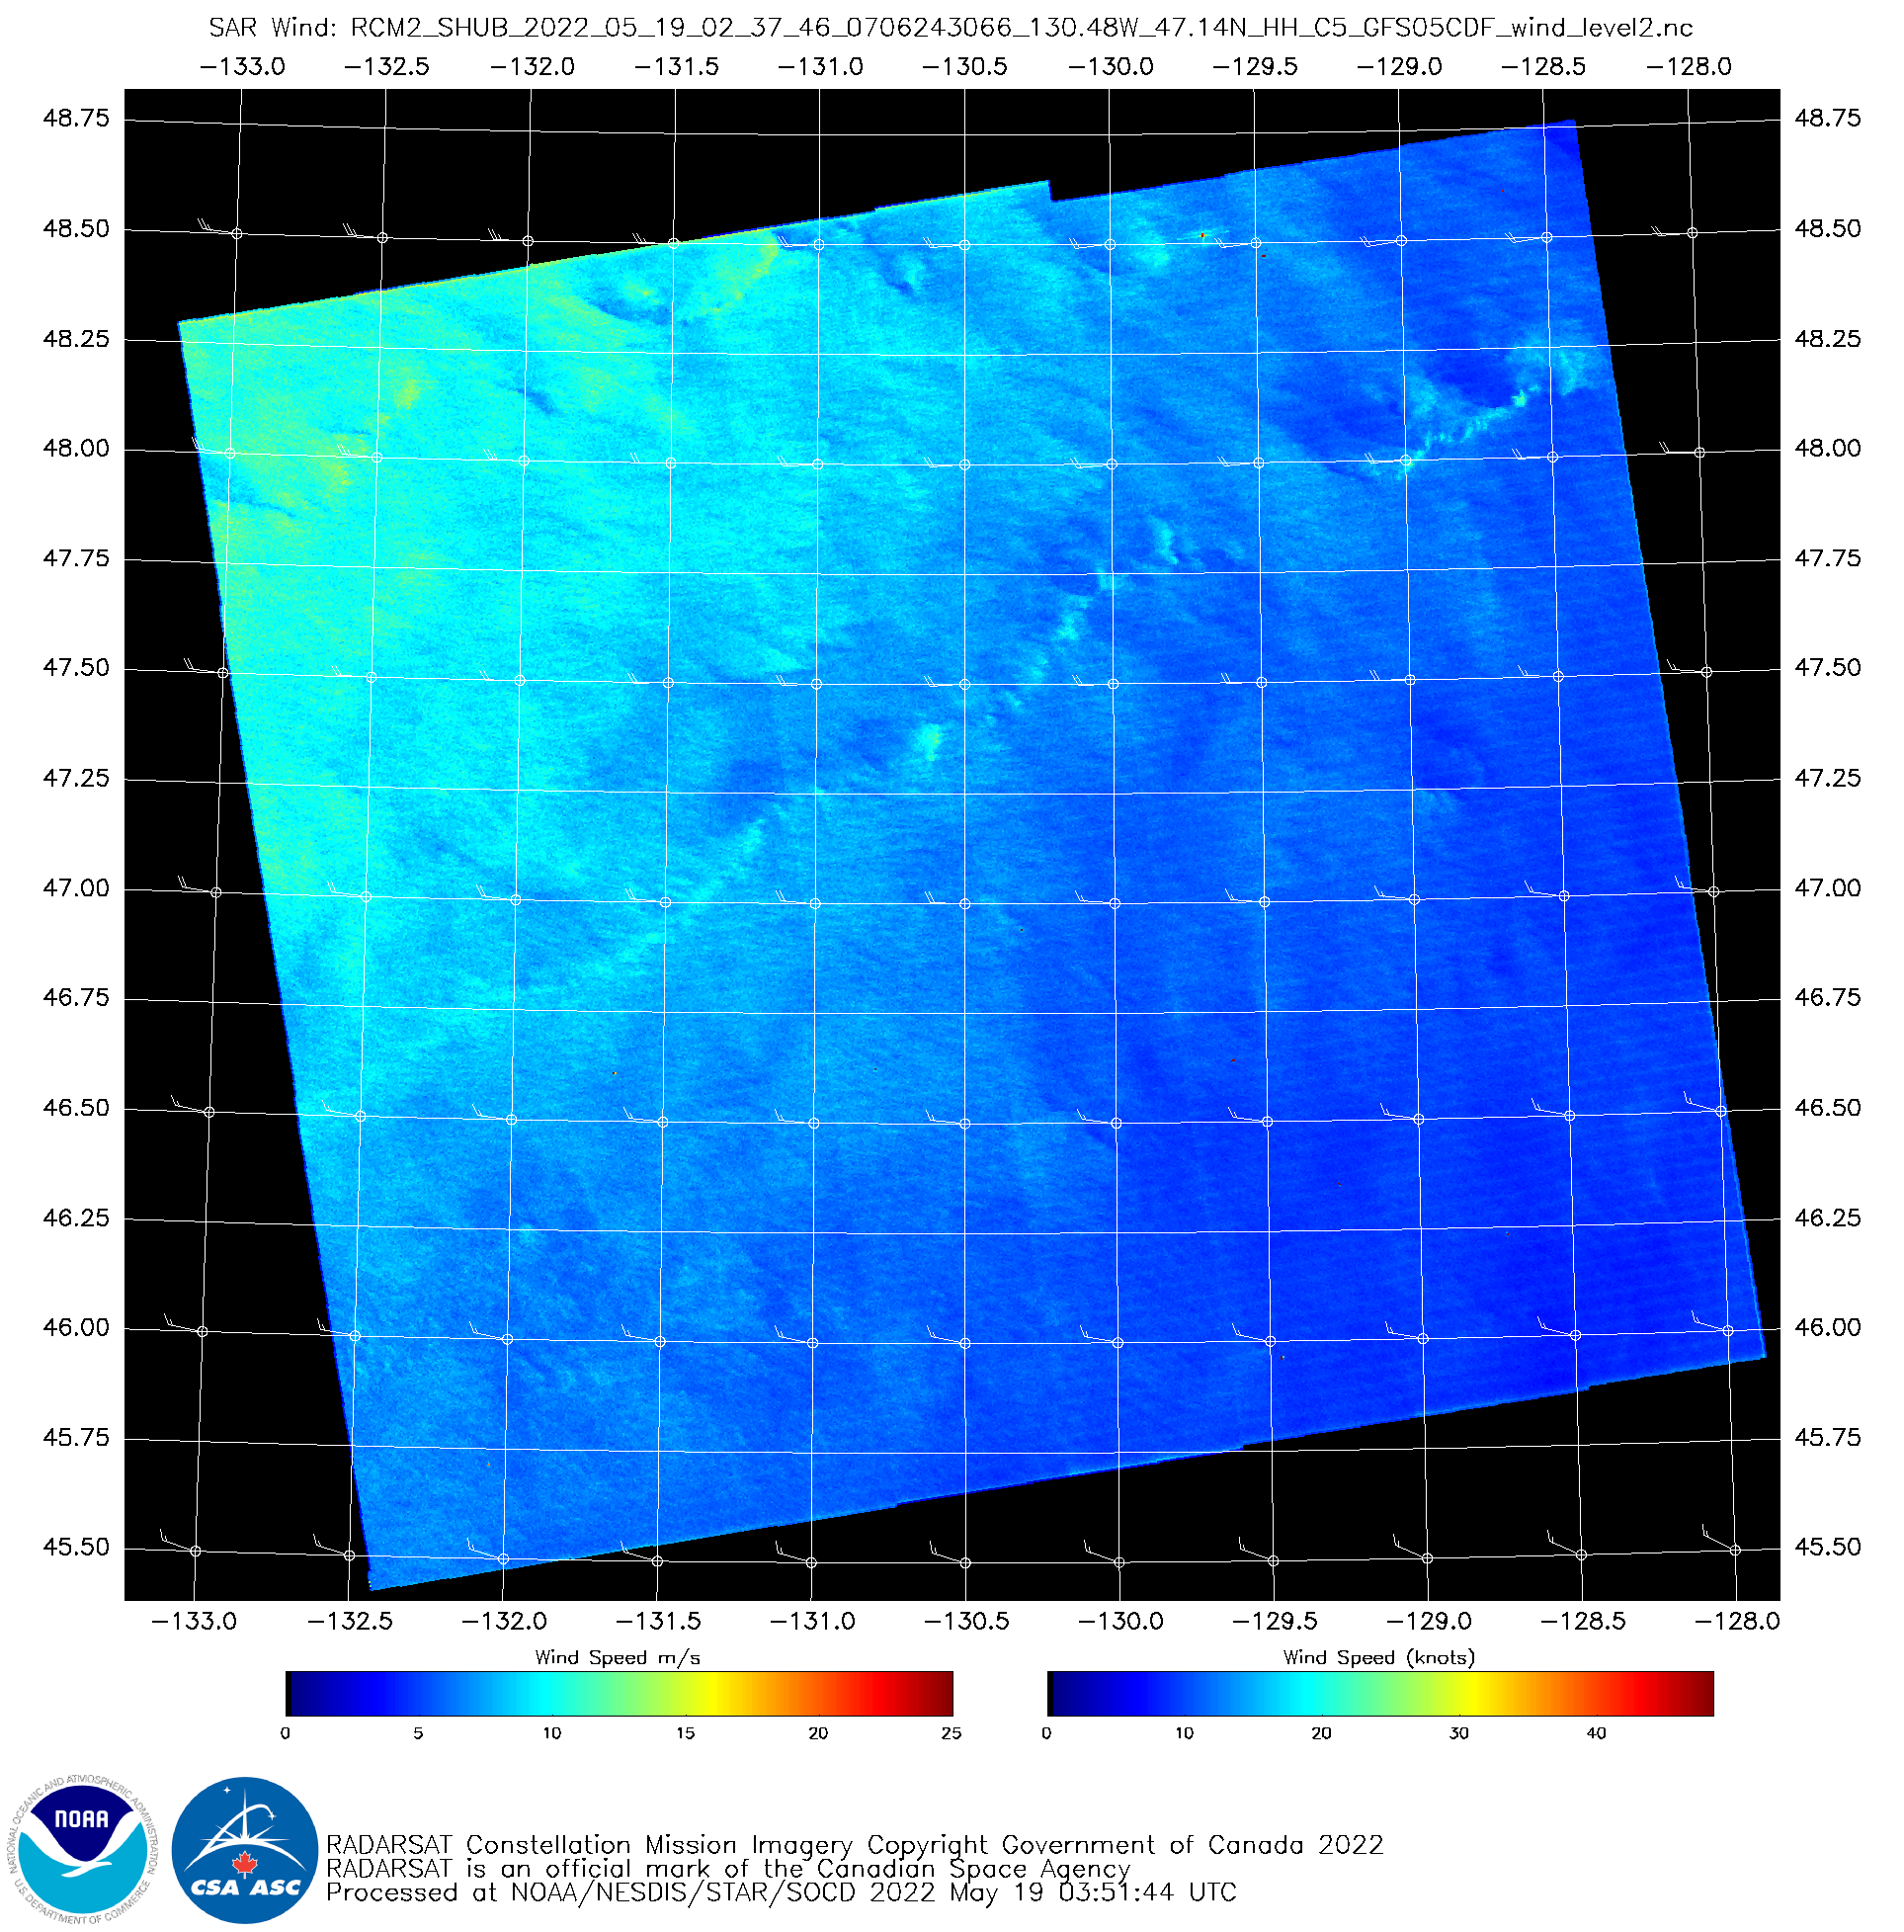
Synthetic Aperture Radar imagery can give very high-resolution observations of winds in regions where wind observations are otherwise sparse (or non-existent). The image above and below show data from an ascending pass of Canada’s RADARSAT Constellation Mission 2 (RCM2) satellite. These data are available online (click here for the image... Read More
SAR Winds over the Pacific Ocean, 0237 UTC on 19 May 2022, and GOES-17 Visible Imagery, 0240 UTC (Click to enlarge)
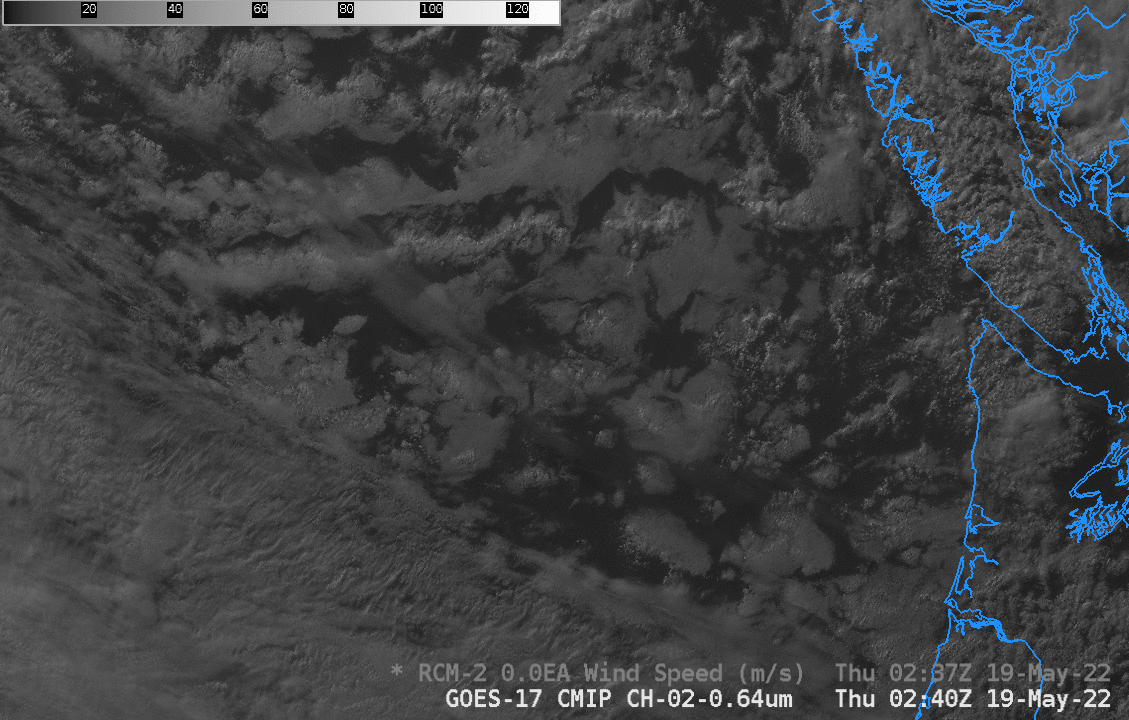
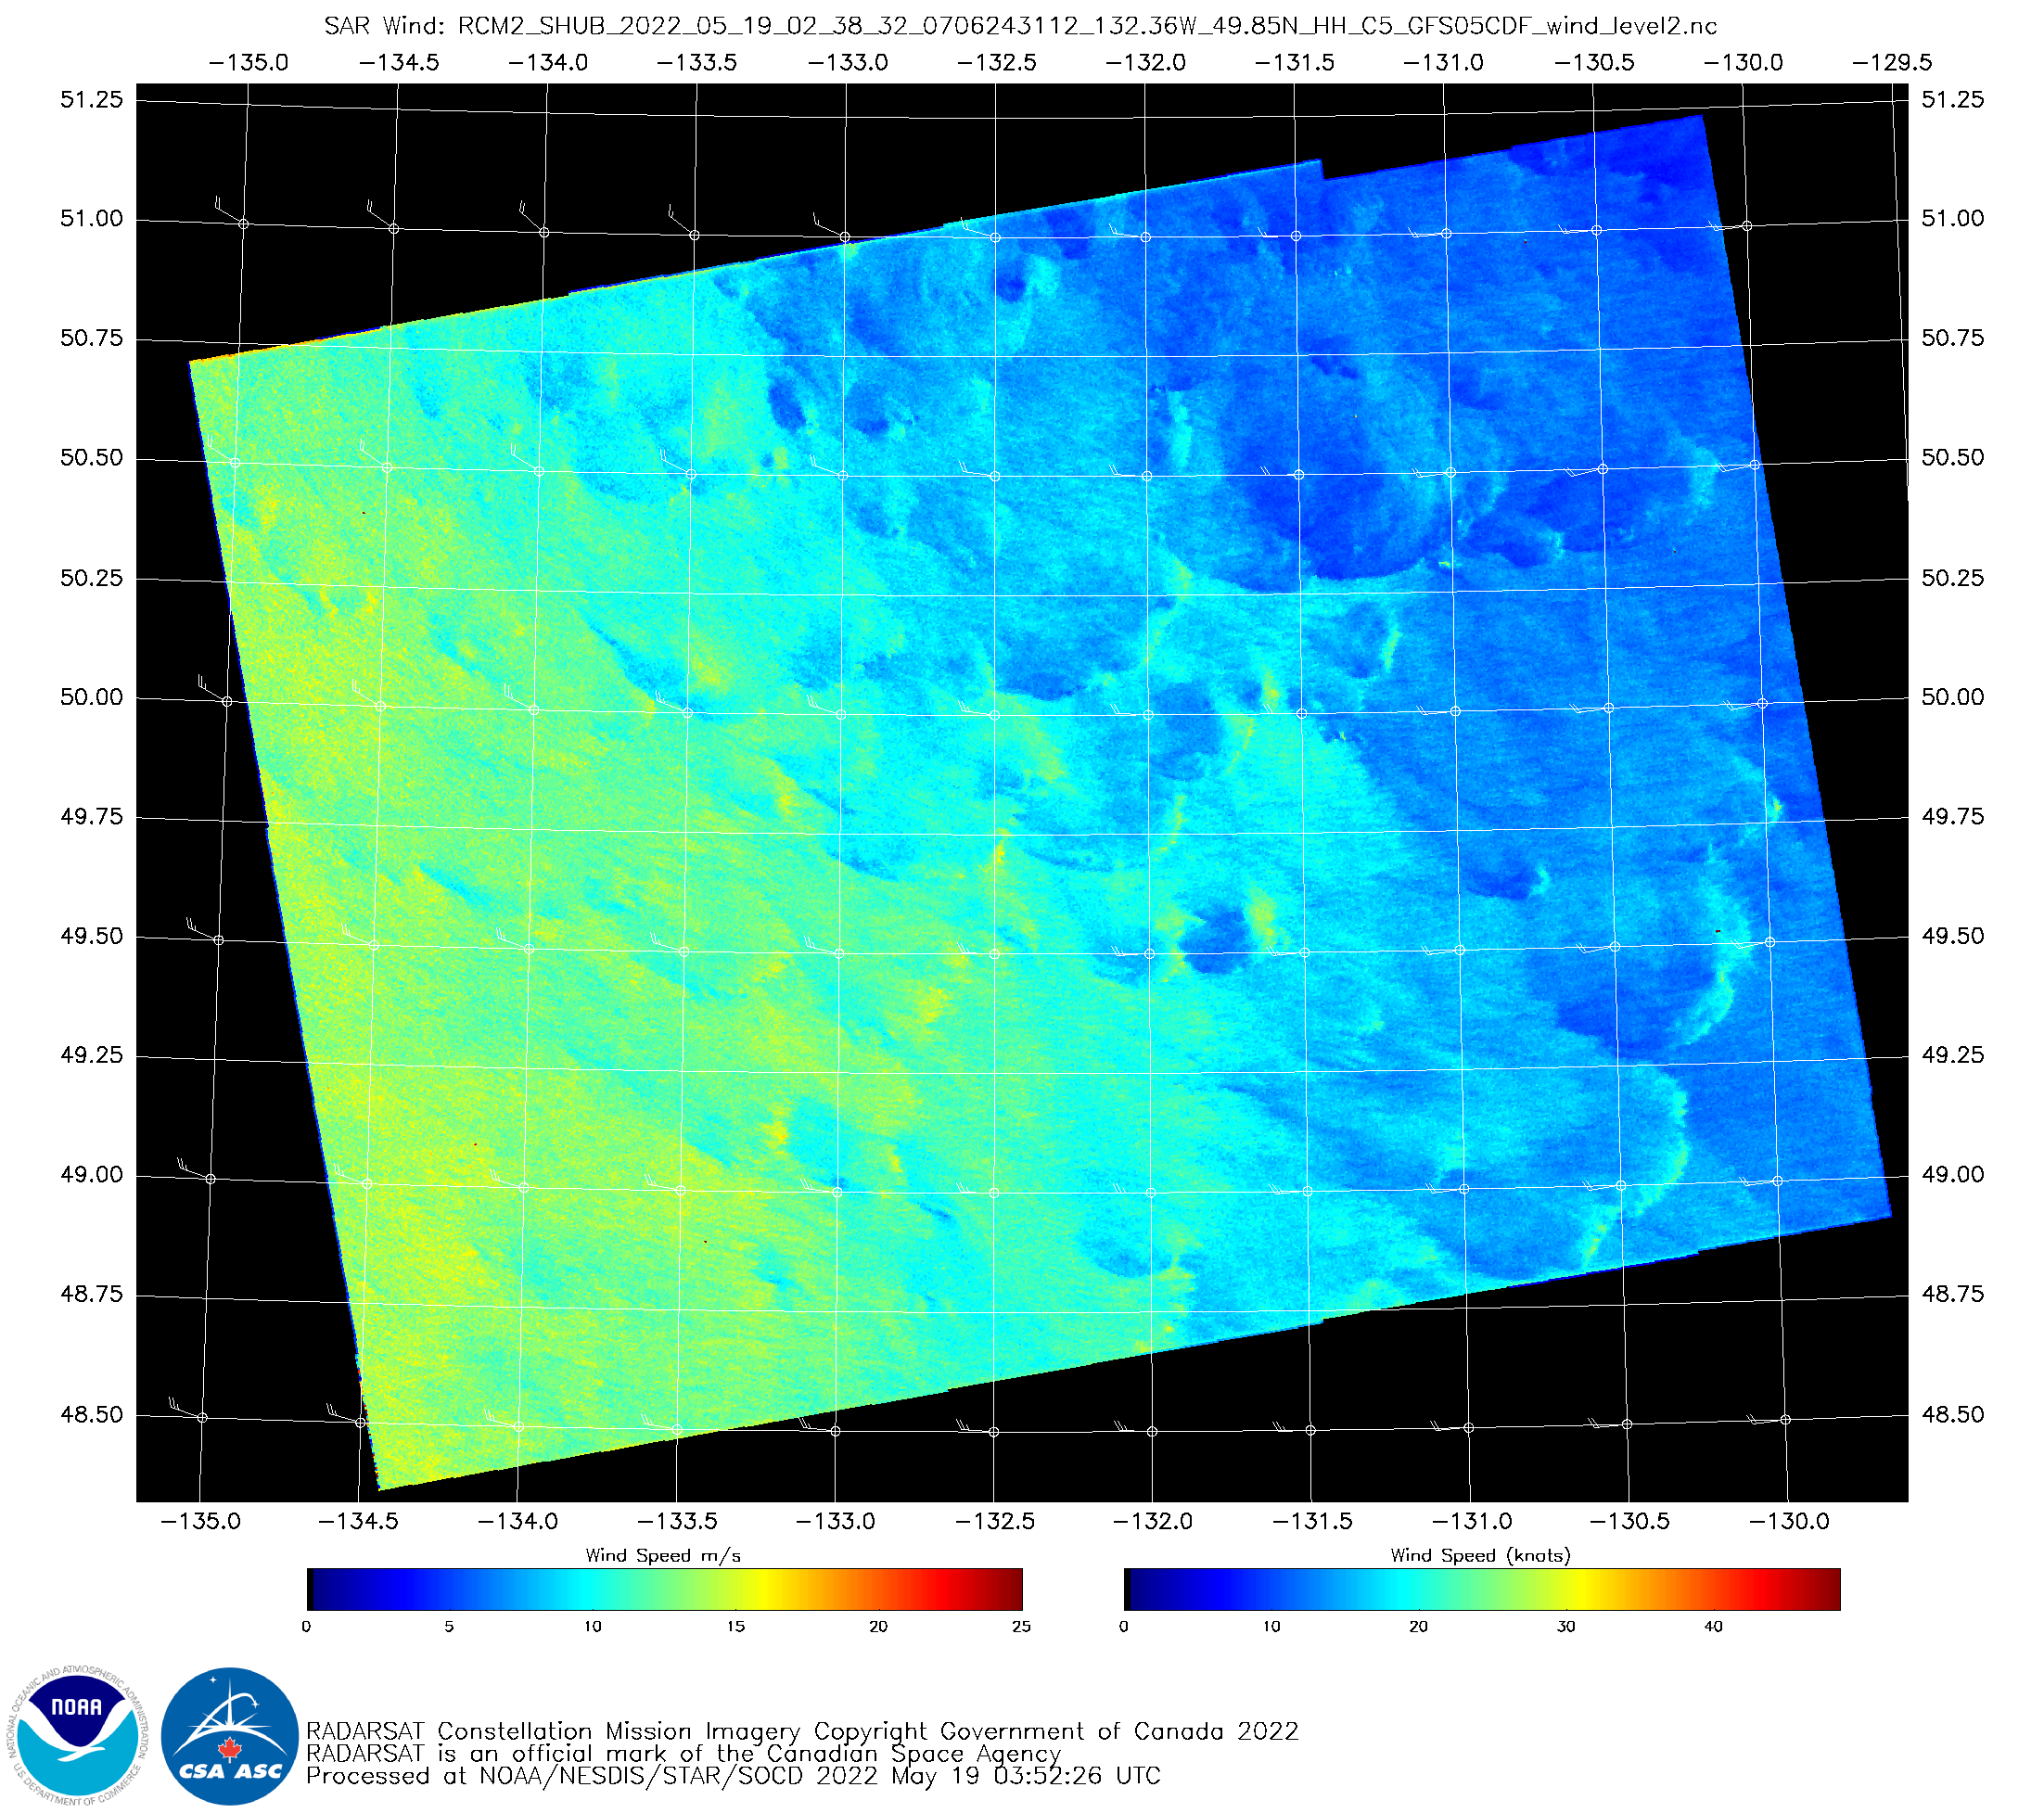
Synthetic Aperture Radar imagery can give very high-resolution observations of winds in regions where wind observations are otherwise sparse (or non-existent). The image above and below show data from an ascending pass of Canada’s RADARSAT Constellation Mission 2 (RCM2) satellite. These data are available online (click here for the image above, and here for the image below), but netcdf files can also be inserted into AWIPS for a direct comparison to other satellite imagery. The image above shows the increase in wind speeds (about 11 m/s) associated with a broken line of cumulus clouds, with stronger winds over the northwest part of the SAR domain. The later image, below, farther north, shows generally stronger winds, and it also shows local wind maxima out in front of cloud formations (in the southeast corner of the SAR domain).
SAR Winds over the Pacific Ocean, 0238 UTC on 19 May 2022, and GOES-17 Visible Imagery, 0240 UTC (Click to enlarge)
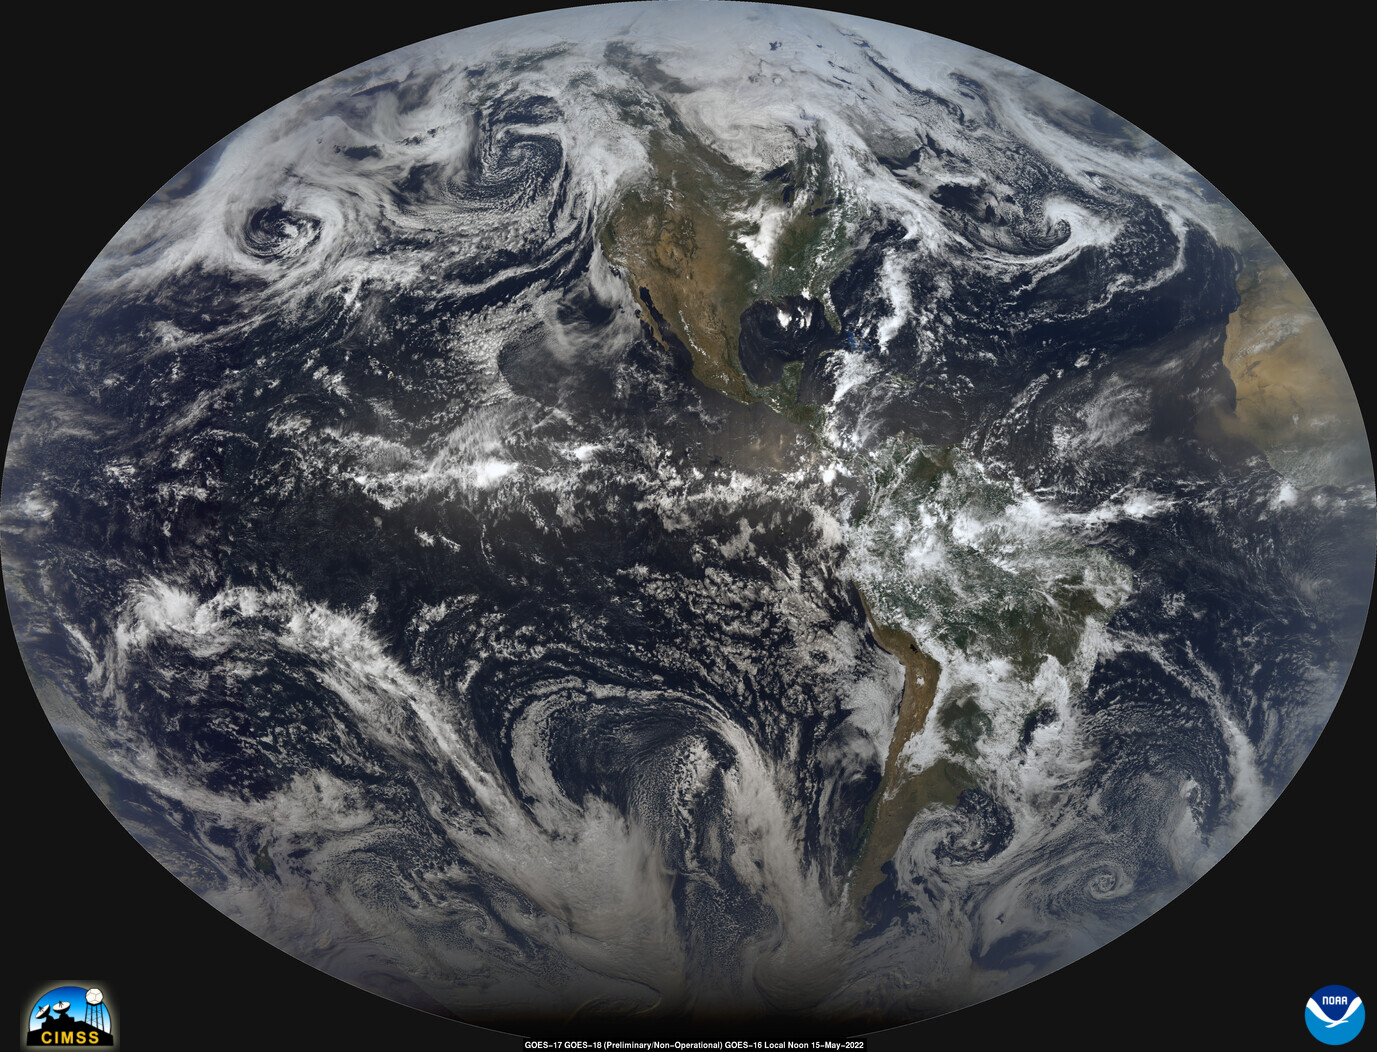
The image above (credit to Rick Kohrs from SSEC/CIMSS) shows Advanced Baseline Imager (ABI) data from GOES-17 (West), GOES-18 (Central, Preliminary/Non-Operational), and GOES-16 (East) on 15 May 2022. This “Local Noon CIMSS Natural Color” image is created by blending vertical strips of true-color imagery at local noon, starting in the... Read More
GOES-17, -18, -16 (West-to-Central-to-East) CIMSS Natural Color imagery at local noon, 15 May 2022. GOES-18 is Preliminary/Non-Operational (click to enlarge)
The image above (credit to Rick Kohrs from SSEC/CIMSS) shows Advanced Baseline Imager (ABI) data from GOES-17 (West), GOES-18 (Central, Preliminary/Non-Operational), and GOES-16 (East) on 15 May 2022. This “Local Noon CIMSS Natural Color” image is created by blending vertical strips of true-color imagery at local noon, starting in the east and proceeding westward. This was a rare opportunity for the GOES-R Series as GOES-18 was only at the central location (89.5W) for a limited time. A larger (5509×4207) version of this image is also available.
Other CIMSS Blog entries have introduced GOES-18, the latest in the GOES-R series. NOAA and NASA recently released the first ABI (Advanced Baseline Imager) imagery from GOES-18 (including this 2-min video). GOES-T was launched on 1 March 2022. Currently GOES-18 is “drifting” out west to be near the “West” position. GOES-18 is slated to become NOAA’s operational GOES-West in early 2023 (GOES-18 Post Launch Test and Transition Plan) after a thorough post-launch test period.
SSEC/CIMSS scientists (notably Rick Kohrs) create daily imagery that blends vertical strips of true-color imagery at local Noon, starting near the dateline and proceeding westward. Recent images are available at this website and include data from 5 geostationary satellites: Himawari, GOES-West, GOES-East, Meteosat-Prime, and Meteosat-IODC. There are multiple other blog posts featuring and explaining the local-noon composite.
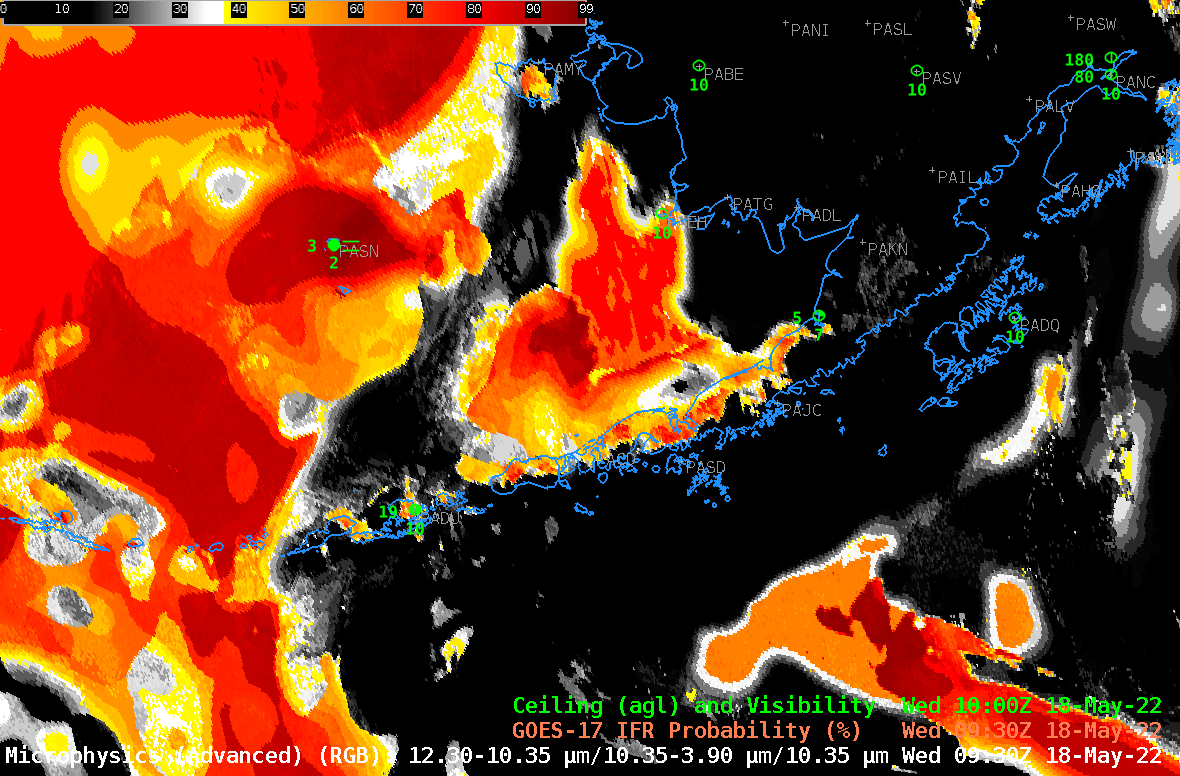
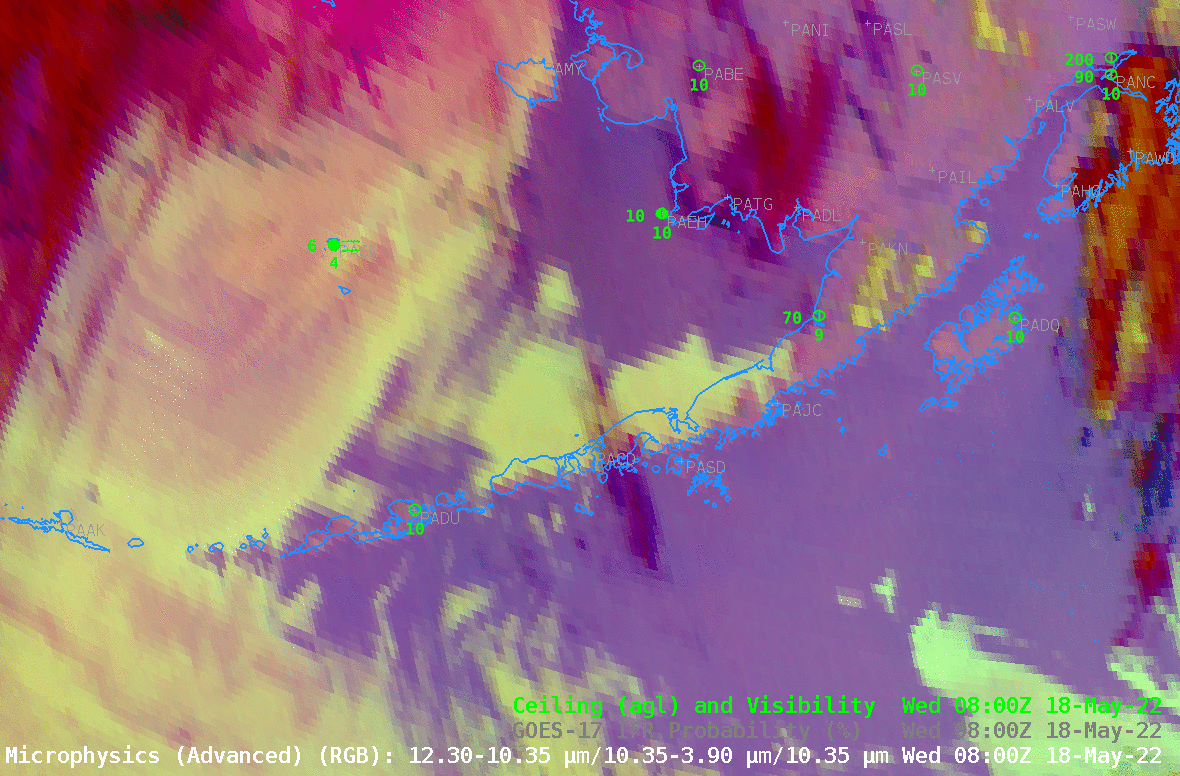
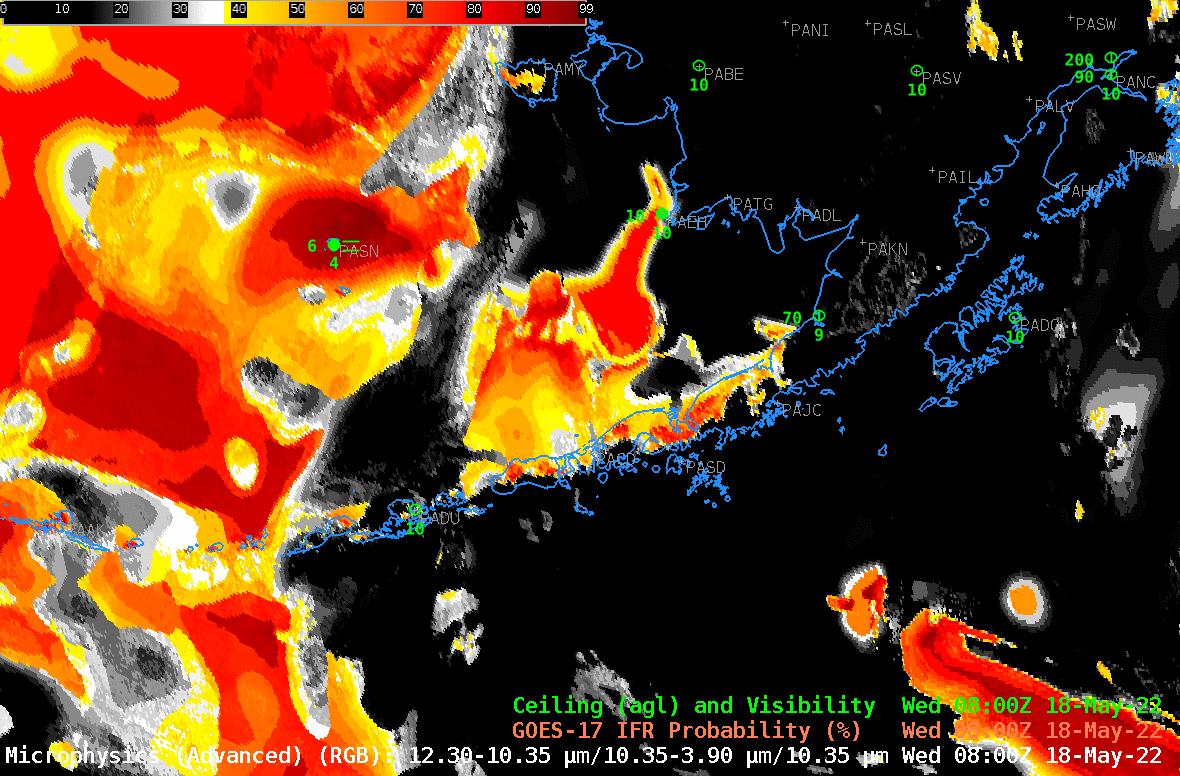
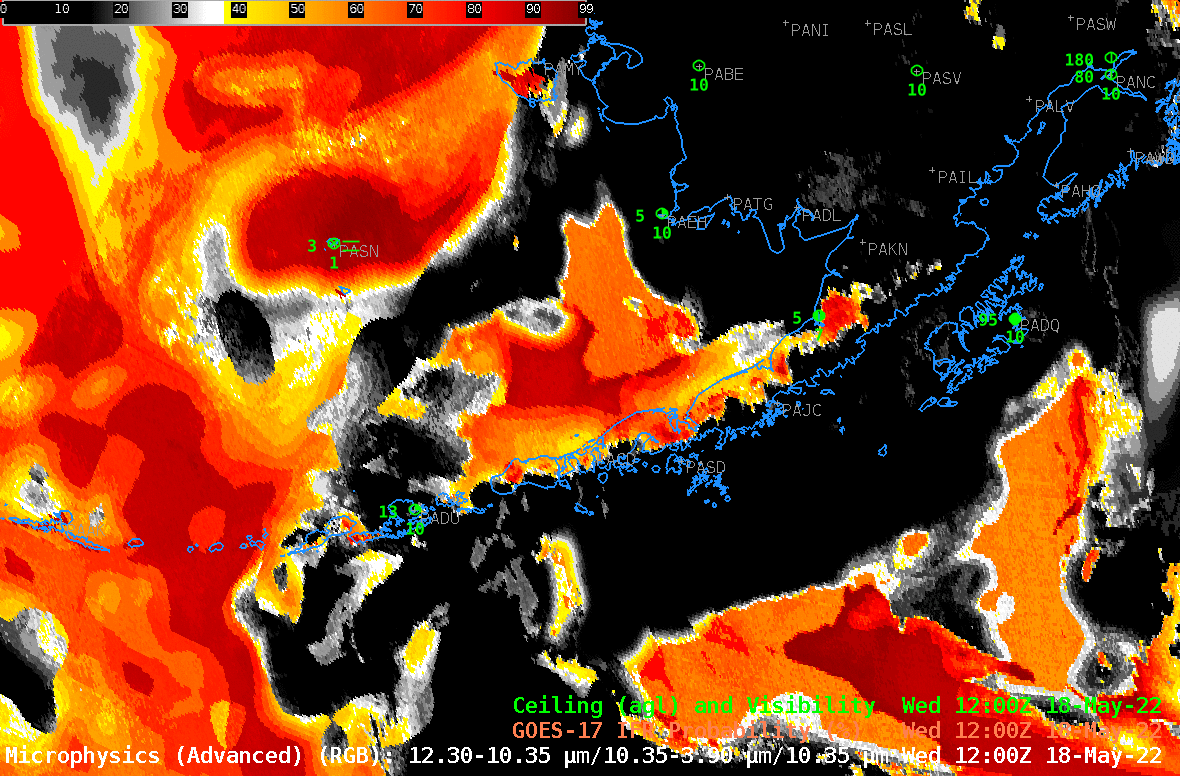
The hourly animation above shows the GOES-17 Night time Microsphysics RGB over and surrounding the Aleutian Islands, from 0800 – 1300 UTC on 18 May 2022. Yellowish features are low clouds in this RGB; low clouds at warmer temperatures have a blue/cyan tint because the inclusion of Band 13 infrared... Read More
GOES-17 Night time Microphysics RGB over the Aleutian Islands and surrounding waters, hourly from 0800 -1300 UTC on 18 May 2022 (Click to enlarge)
The hourly animation above shows the GOES-17 Night time Microsphysics RGB over and surrounding the Aleutian Islands, from 0800 – 1300 UTC on 18 May 2022. Yellowish features are low clouds in this RGB; low clouds at warmer temperatures have a blue/cyan tint because the inclusion of Band 13 infrared (10.3 µm) brightness temperatures in the ‘blue’ part of the RGB will change the color representation of low clouds. High clouds — red in the RGB — are also present along the western edge of the domain, over the Bering Sea — and are apparent as thin clouds over the low clouds over the Aleutians, visible as purple streaks.
Are the low clouds shown above fog — that is, are the clouds touching the surface? That’s hard to tell with certainty over Marine Environments. The single surface observation — at St Paul Island (PASN) in the Bering Sea, does show fog/low stratus present, and IFR conditions. An inference from that observation might be extended into the entire region. Real-time webcams and ship observations can also help with the determination of whether low clouds are actually banks of fog.
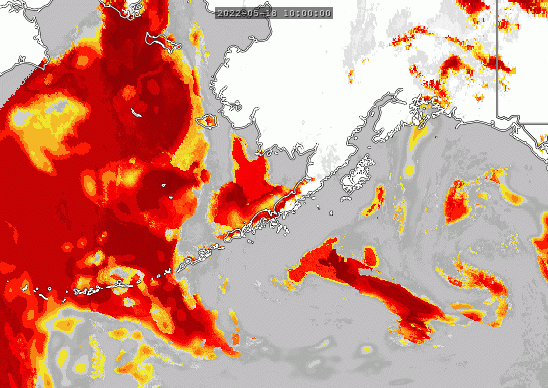
IFR Probability fields, below, for the same 6 observation times, incorporate model-derived estimates of low-level saturation, suggesting more low-level variability to the low clouds/fog over the Bering Sea (and in the Gulf of Alaska south of the Aleutians); that’s shown more clearly in this toggle between the two fields at 1200 UTC. Note also that a useful signal is produced underneath the high clouds at the western edge of the domain: even though the satellite gives no direct observations of the low-level clouds there, model estimates can nevertheless give information on low-level saturation.
GOES-17 IFR Probability fields, hourly from 0800 – 1300 UTC on 18 May 2022 (Click to enlarge)
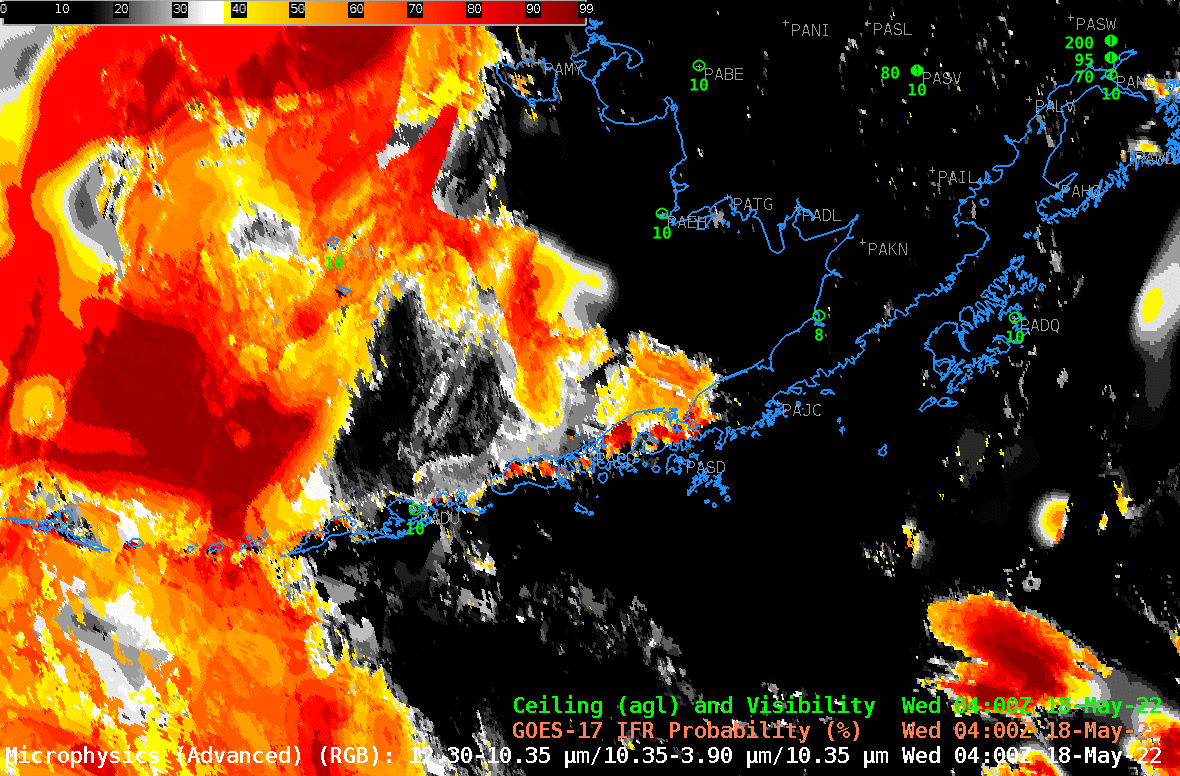
When the sun is above the horizon, the Night time Brightness temperature difference field (10.3 µm – 3.9 µm) signal flips sign because of the large amounts of 3.9 µm solar reflectance; thus the Nighttime Microphysics RGB is less useful in low-cloud detection. The toggle below compares the Night Time Microphysics RGB and the IFR Probability field at 0400 UTC. Note that the observation at St Paul Island at this time does not show IFR conditions — and IFR Probabilities there are not quite so large as later, as displayed in the animations above.
Nighttime Microphysics RGB and IFR Probability fields, 0400 UTC on 18 May 2022, along with surface observations (Click to enlarge)
The imagery above were all captured using a National Weather Service AWIPS machine, with dataflow over the Satellite Broadcast Network (SBN) that supplies data products to the offices. What if you don’t have that resource? RealEarth contains Full-Disk IFR and Low IFR Probability fields from GOES-16 and GOES-17 (search for IFR within the search box at the RealEarth website). An animation of IFR Probability from GOES-17, from 1000 UTC – 1250 UTC, at 10-minute steps (the scanning cadence of GOES-17 Full Disk imagery) is below.
IFR Probability fields, 1000 – 1250 UTC on 18 May 2022 (click to enlarge)
GOES-17 Full-Disk Nighttime microphysics RGB imagery is available from a variety of sources. For example, it’s at the NOAA/NESDIS Imagery viewer (link); at the CIRA Slider ; the mp4 animation below is taken from a coming upgrade to the CSPP Geosphere site that shows Night time Microphysics RGB imagery at night (and true color imagery during the day).
GOES-17 Nighttime Microphysics RGB, 1000 – 1300 UTC on 18 May 2022

