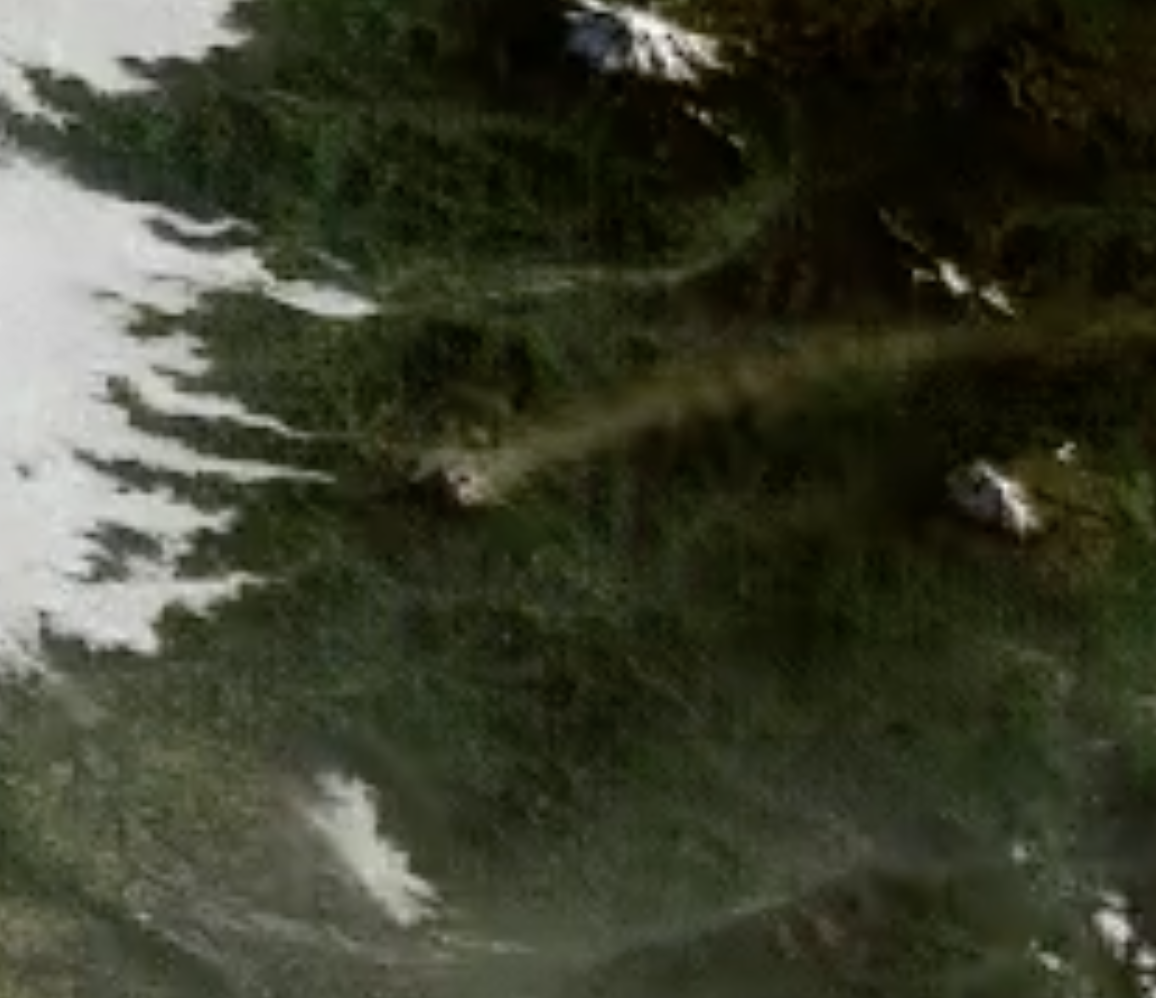
The CSPP Geosphere website has recently been upgraded. CSPP Geosphere uses data from the GOES Re-Broadcast (GRB) data stream Those data are processed on an on-site Kubernetes cluster that produces full-resolution GOES-East/GOES-West images that are quickly and fluidly zoomable and pannable. In addition, recent software and hardware upgrades mean that processing is faster. GOES-West data (either GOES-17 or GOES-18 during interleave periods such as the one occurring from early August until 6 September 2022) are now available. The default imagery shown remains Nighttime Microphysics RGB at night, as shown above, and sharpened, Rayleigh-corrected True-Color imagery during the day (as shown in the image below).
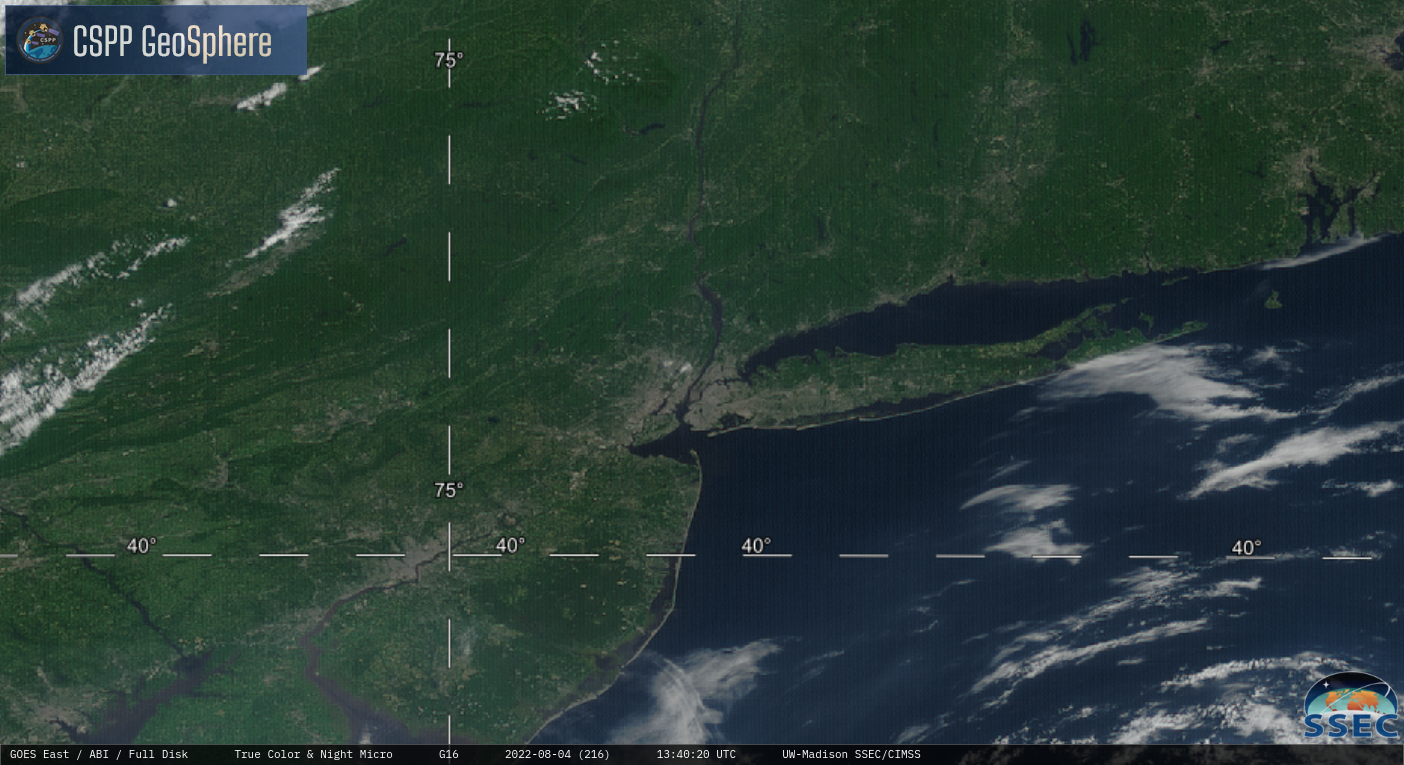
CSPP Geosphere allows users to save off mp4 videos of animations as shown above (with the default number of frames, 12, although any number of frames can be displayed in an animation), and also individual png frames, as shown below. The mp4 animations and individual png frames are created on the client machine; creation speed will depend on a user’s computer’s resources and resolution. In addition, the site now includes a default lat/lon readout that tracks the cursor, and a searchbox that will allow a user to center the image near a location at near-maximum zoom (‘Manhattan’, for example, as shown below — after zooming out one step). Latitude/Longitude and Coastlines/Borders can be turned on and off.
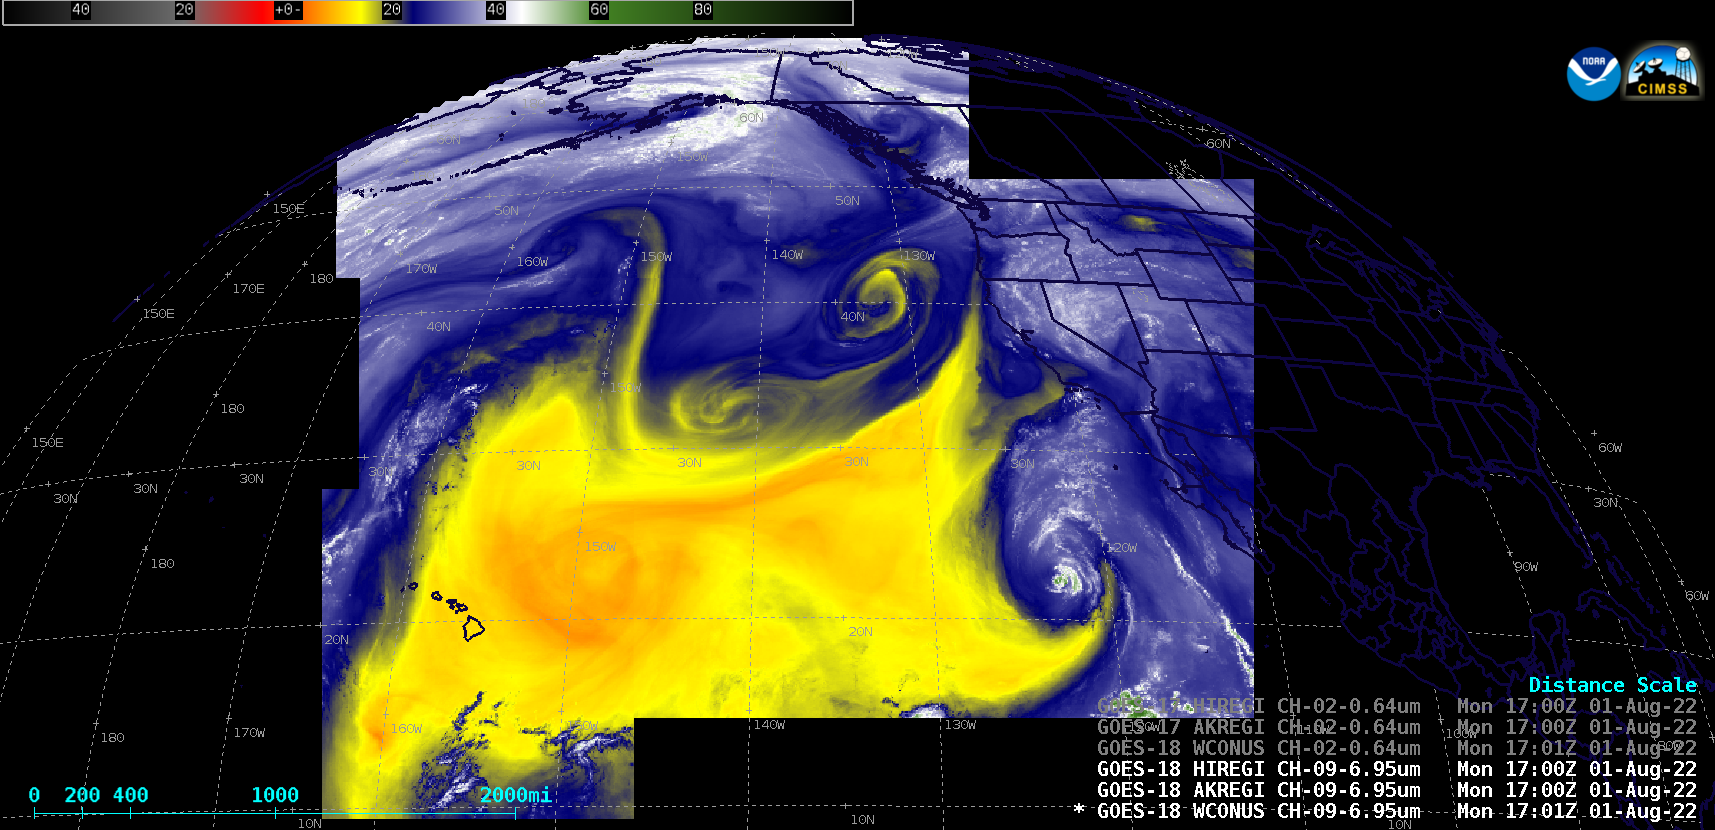
The example below shows 48 frames of GOES-18 data over the northern Pacific Ocean (link; CSPP Geosphere lets users easily share the url used to create the imagery). Note the abundant smoke over the central USA at the end of the animation, and the sun glint over Asia at the start. Barcode noise (also here) in Band 7 (a component of the Nighttime Microphysics RGB) is apparent, but faint.
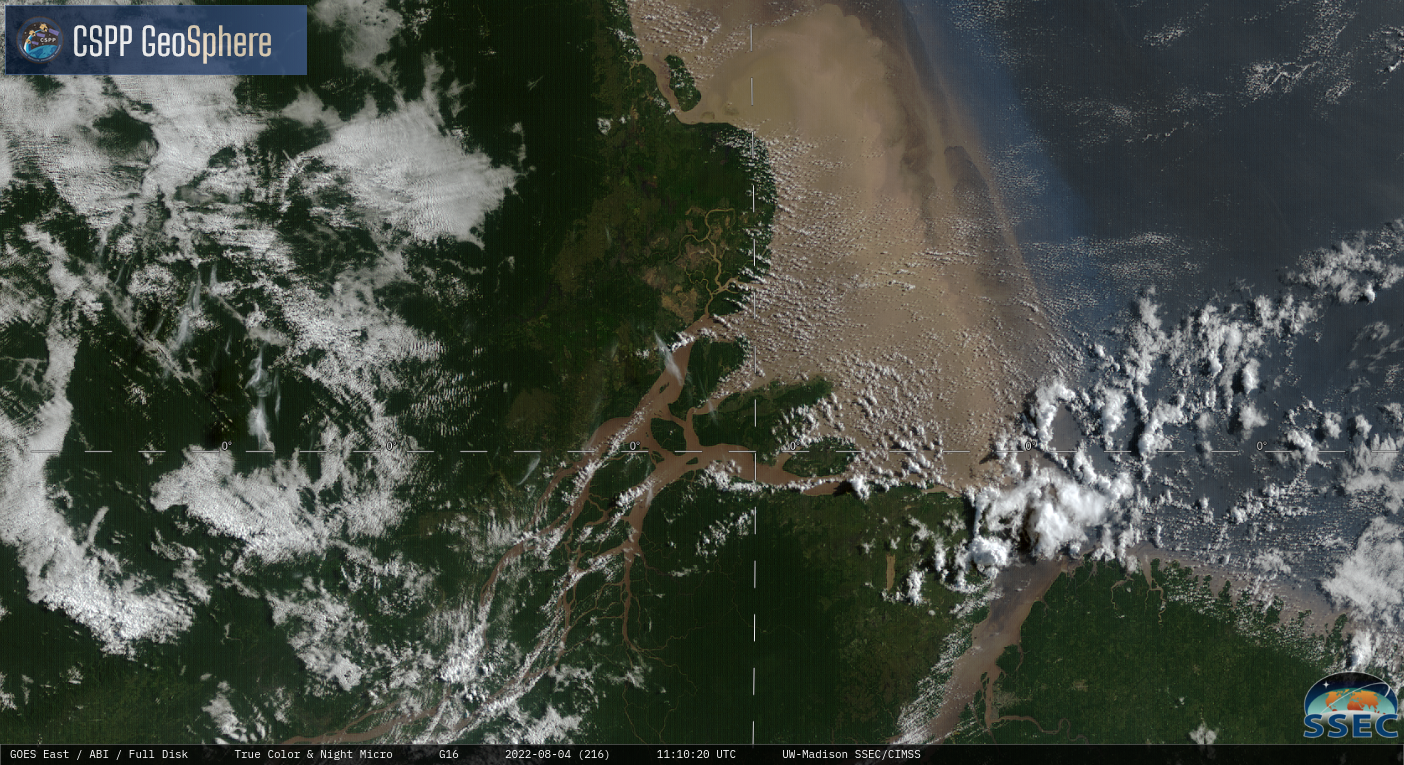
GOES-16 Imagery, below (from this CSPPGeosphere link) shows the turbid waters of the Amazon flowing northward into the tropical Atlantic.
The GeoSphere website and back end were created using SSEC-internal funds. The CSPPGeo GOES Re-Broadcast (GRB) processing software and CSPPGeo Geo2Grid software used in the back end were created with funding from NOAA.
View only this post Read Less


