GOES-18 images shown in this blog post are preliminary and non-operational During its Post-Launch Testing (PLT) period, once GOES-18 drifted to a position close to its final “Operational GOES-West” longitude of 137º W, a “Barcode Artifact” of vertical striping was occasionally seen in colder scenes of Band 07 Shortwave Infrared (3.9 µm)... Read More
GOES-18 Shortwave Infrared (3.9 µm) images [click to play animated GIF | MP4]
GOES-18 images shown in this blog post are preliminary and non-operational
During its Post-Launch Testing (PLT) period, once GOES-18 drifted to a position close to its final “Operational GOES-West” longitude of 137º W, a “Barcode Artifact” of vertical striping was occasionally seen in colder scenes of Band 07 Shortwave Infrared (3.9 µm) imagery — primarily centered around “spacecraft midnight” times, from 06-12 UTC . One example, using 1-minute Mesoscale Domain Sector images over the Alaska region on 20 July 2022, is shown above. Note that the vertical striping is more obvious over the colder (brighter white) clouds.
GOES-18 Shortwave Infrared (3.9 µm) images [click to play animated GIF | MP4]
Another example on the same date is shown above, centered over the East Pacific Ocean off the coast of California and Mexico. Using the default grayscale enhancement, the Barcode Artifact is rather subtle and more difficult to notice. However, once a special “stretched” enhancement is applied to the images below, the Barcode Artifact becomes very notable across the extensive stratocumulus cloud deck over the ocean.
GOES-18 Shortwave Infrared (3.9 µm) images [click to play animated GIF |
]
The vertical striping of the Barcode Artifact will also appear in many multispectral products that use 3.9 µm imagery — for example, GOES-18 Nighttime Microphysics RGB images (created using Geo2Grid) over that same region are shown below.
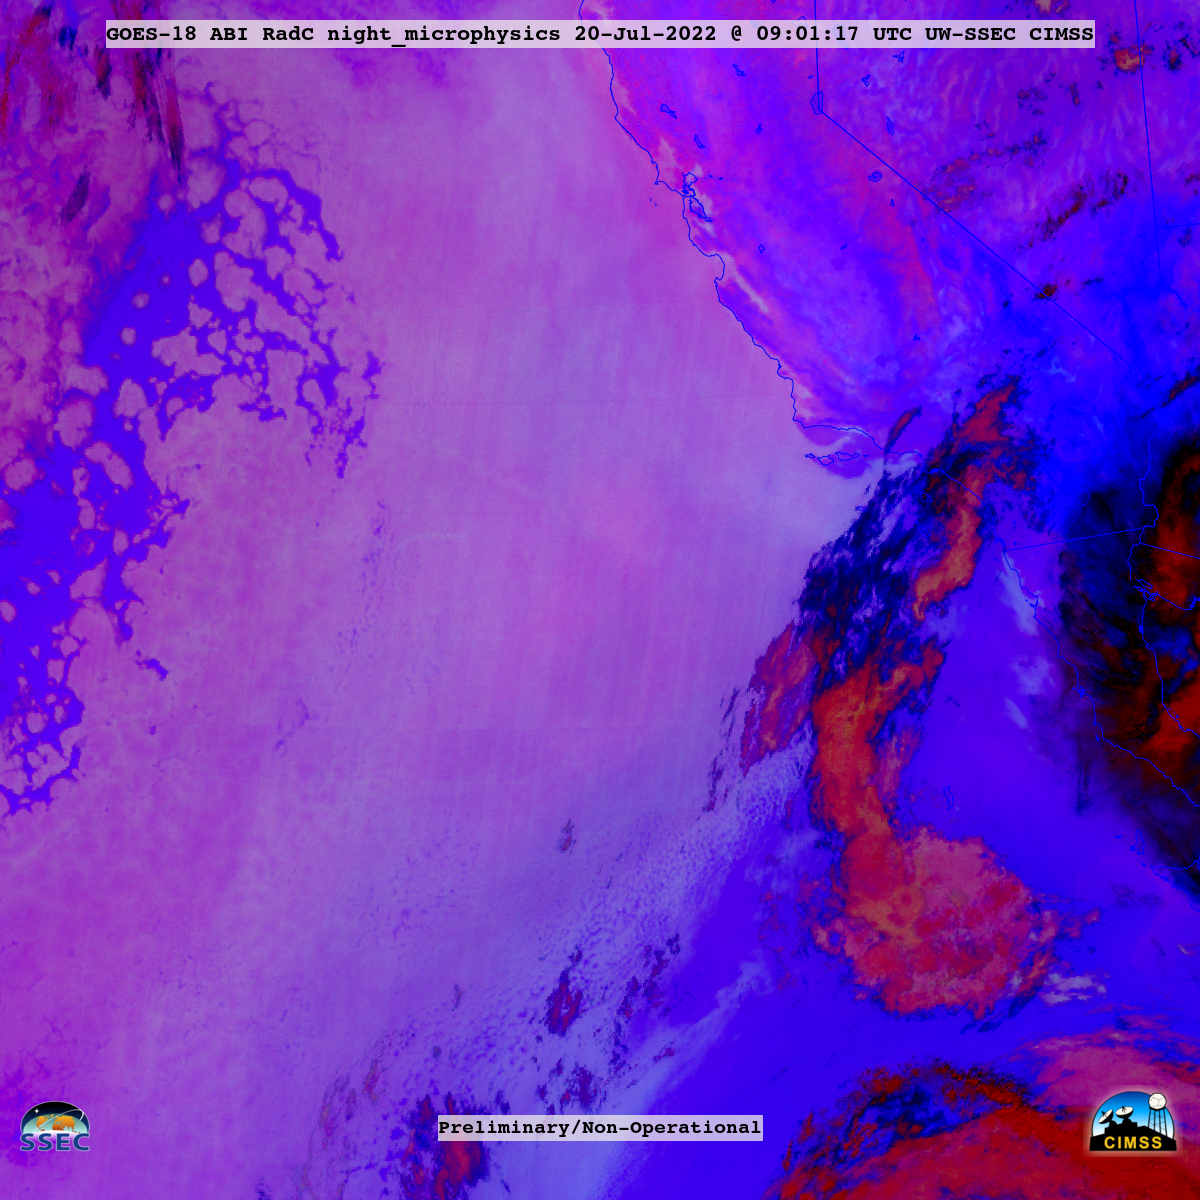
GOES-18 Nighttime Microphysics RGB images [click to play animated GIF | MP4]
It is important to note that the Barcode Artifact is not related to the
Loop Heat Pipe cooling issue that has affected GOES-17 — plots of 2-day and 10-day Focal Plane Module temperatures for GOES-17 and GOES-18 (ending on 26 July 2022) are displayed below.
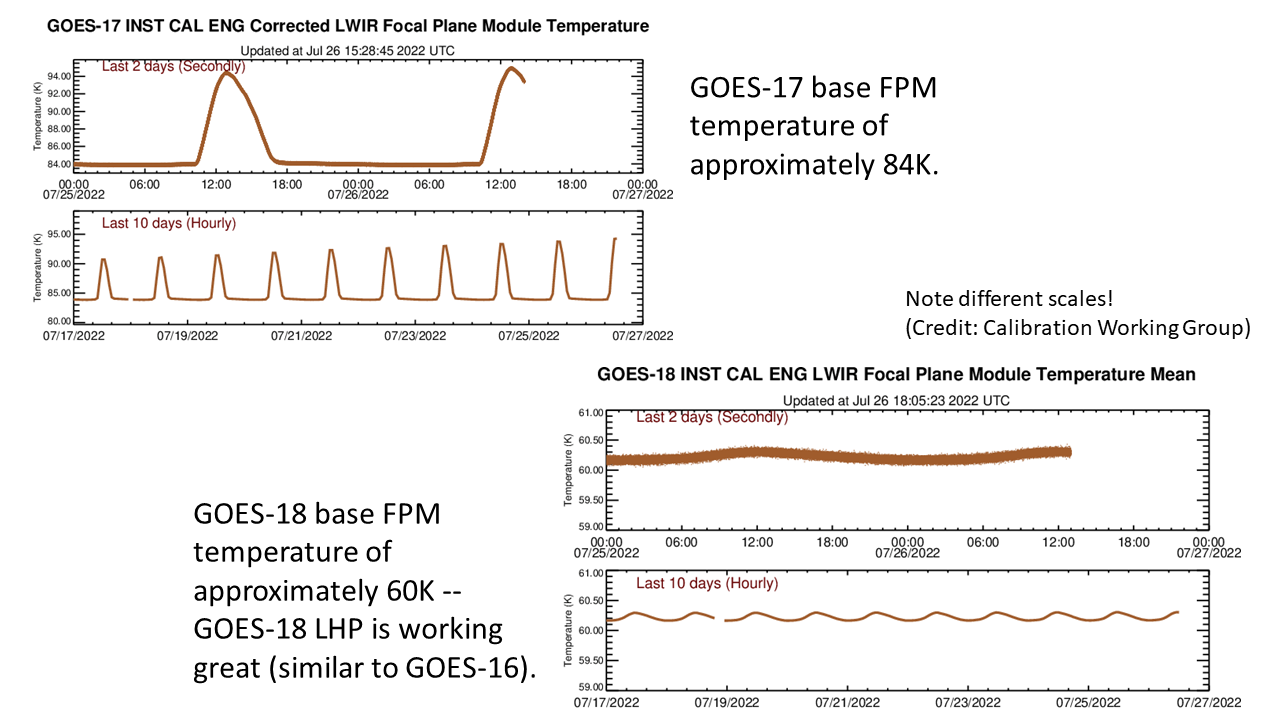
2-day and 10-day plots of Focal Plane Module temperatures for GOES-17 (top) and GOES-18 (bottom), ending on 26 July 2022 [click to enlarge]
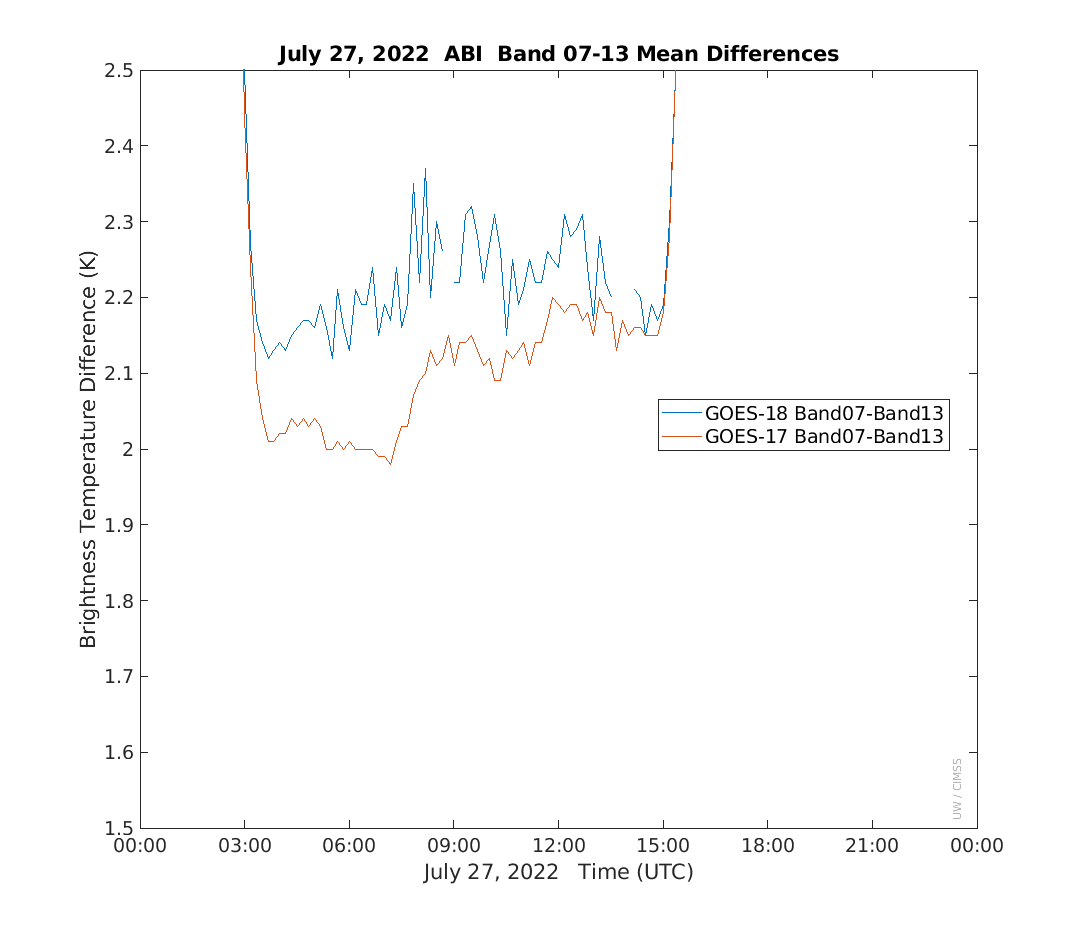
It also bears mentioning that this Barcode Artifact is also occurring with GOES-17
(GOES-West) imagery — but to a lesser extent compared to GOES-18. A plot of Band07-Band13 Difference values for GOES-17 vs. GOES-18 on 27 July 2022 is shown below.

Plot of Band07-Band13 Difference values for GOES-17 and GOES-18 on 27 July 2022 (credit: Mat Gunshor, CIMSS) [click to enlarge]
A subtle example of GOES-17 Barcode Artifact can be seen toward the end of an animation of
Night Fog BTD (11.2 µm – 3.9 µm) images on 26 July, shown below,
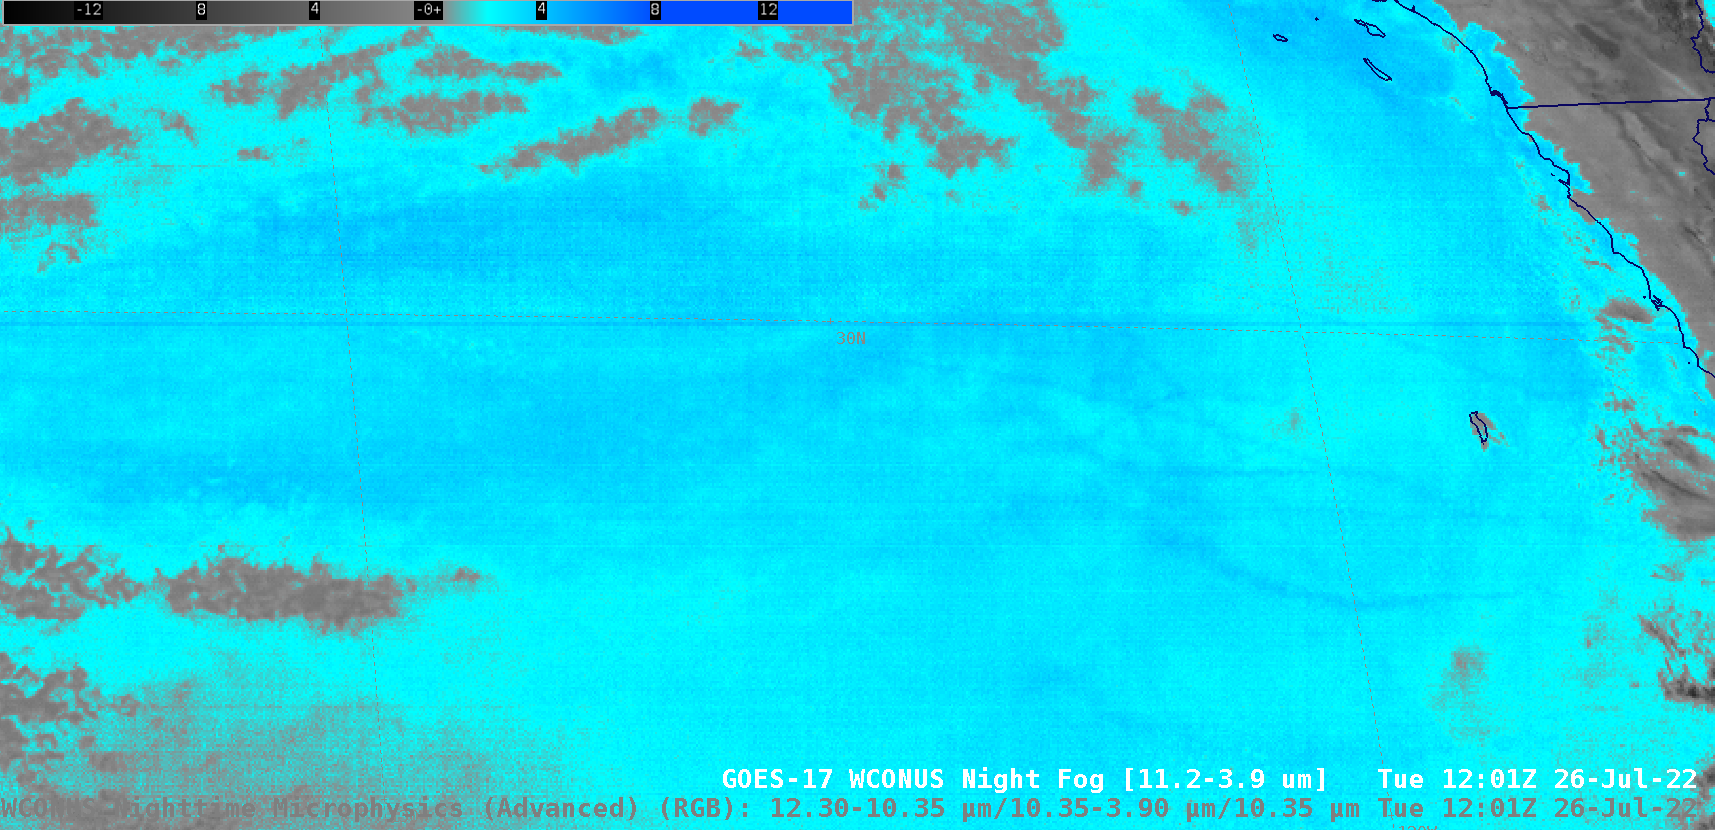
GOES-17 Night Fog BTD (11.2 µm – 3.9 µm) images [click to play animated GIF | MP4]
H/T to Jim Nelson (CIMSS) and Tim Schmit (NOAA/NESDIS/ASPB) for providing many of the GOES-18 animations. Additional information and examples of GOES-18 Barcode Artifact can be found at the
Satellite Liaison Blog.
View only this post
Read Less


