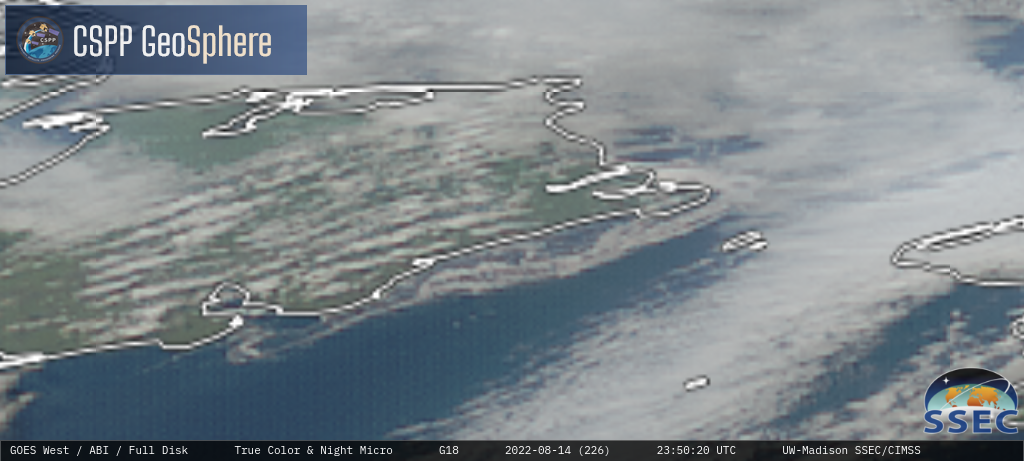
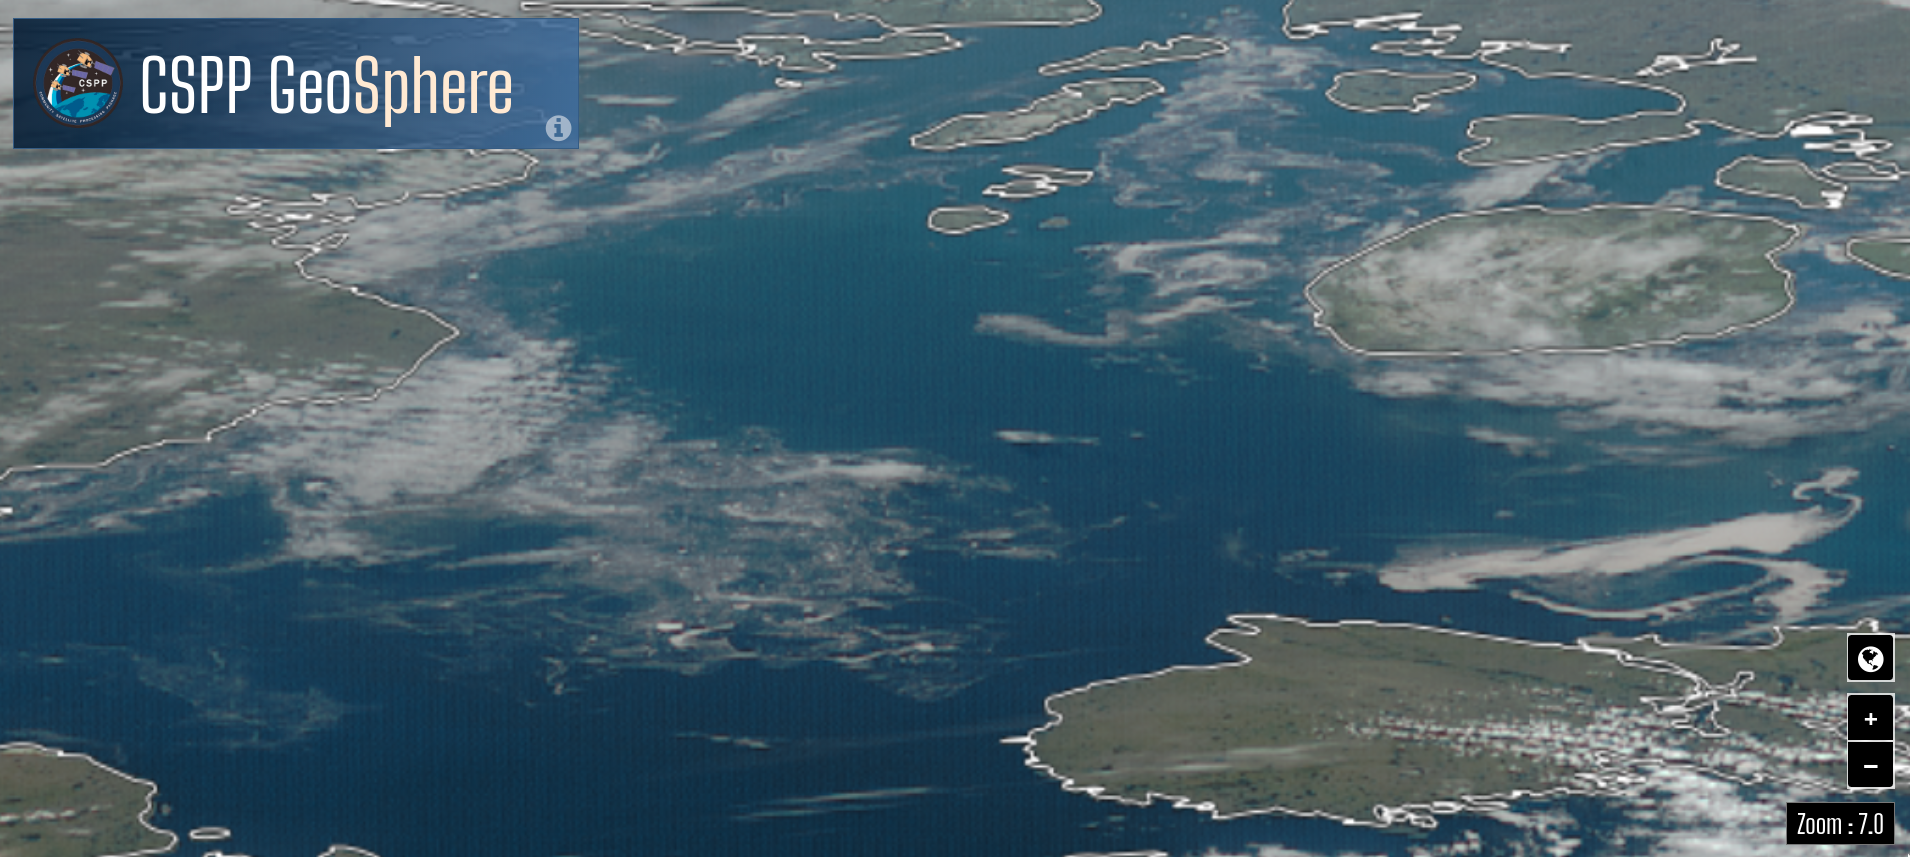
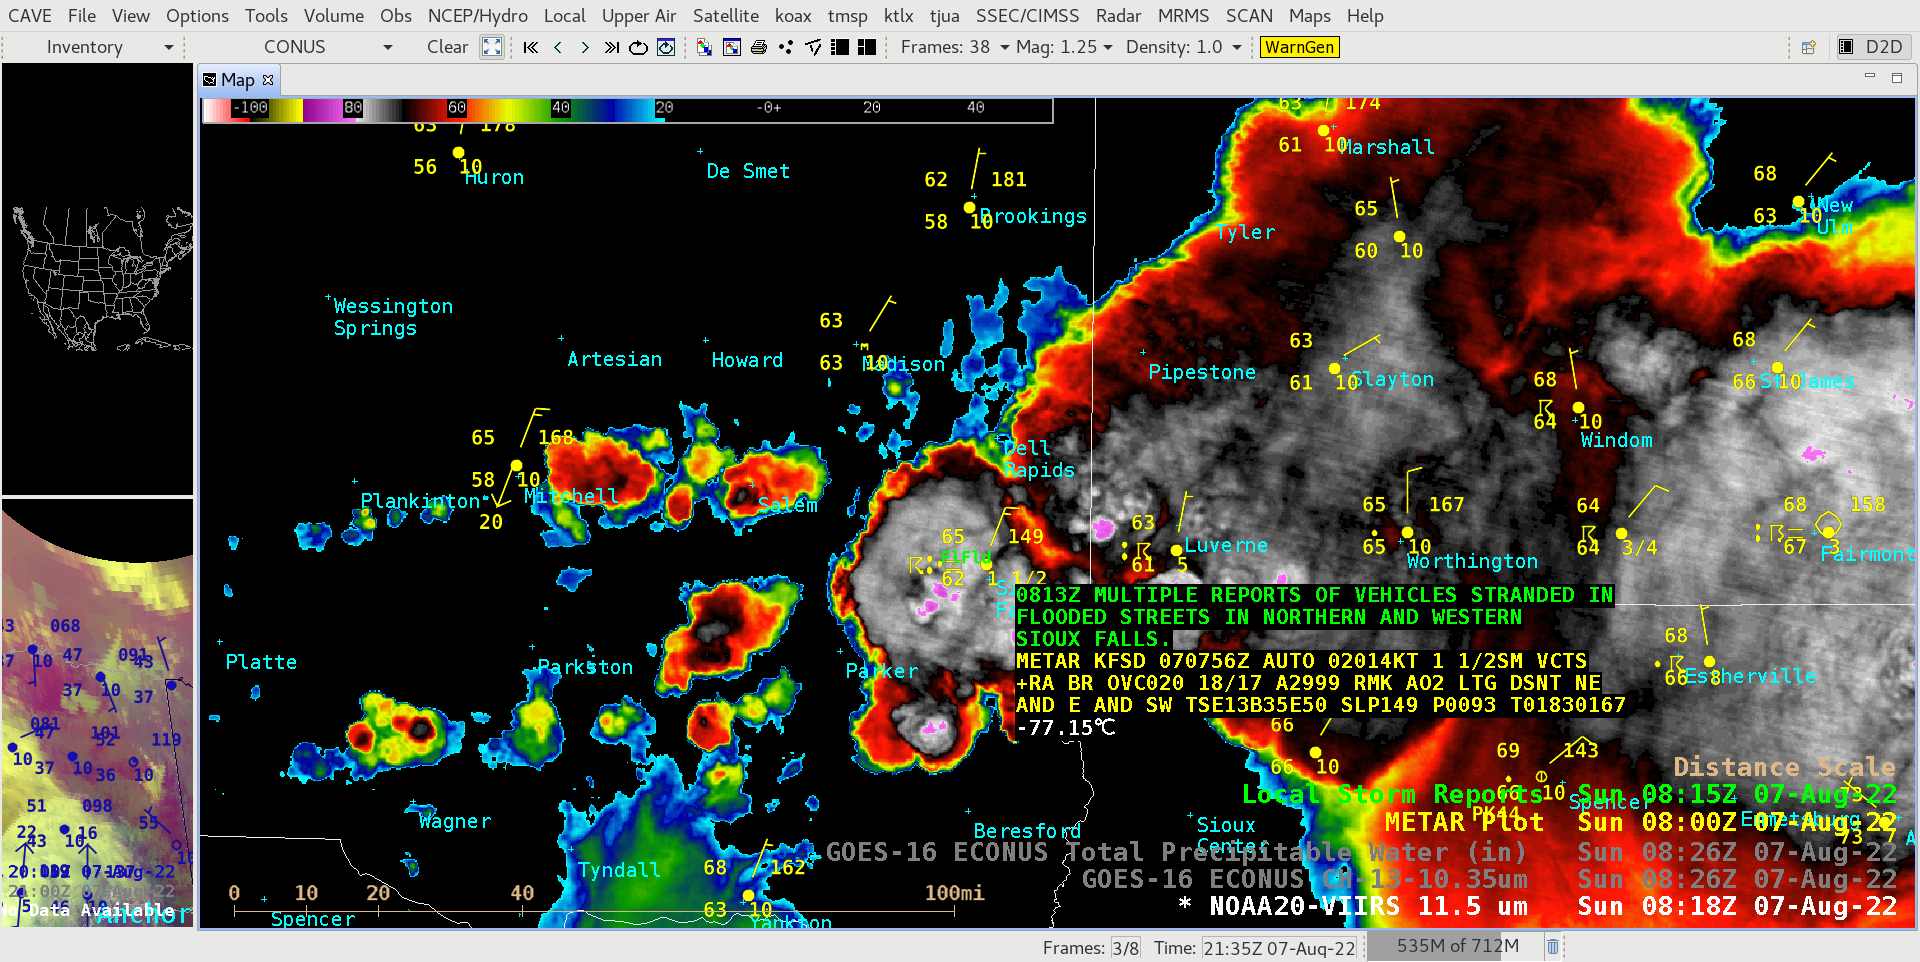
GOES-18 True Color RGB images [click to play MP4 animation]
GOES-18 (GOES-West) True Color RGB images viewed using CSPP GeoSphere (above) showed the motion of sea ice filaments that had moved southward through the Bering Strait and into the northwestern Bering Sea (just off the coast of Chokotka Okrug, Russia) on 14 August 2022.
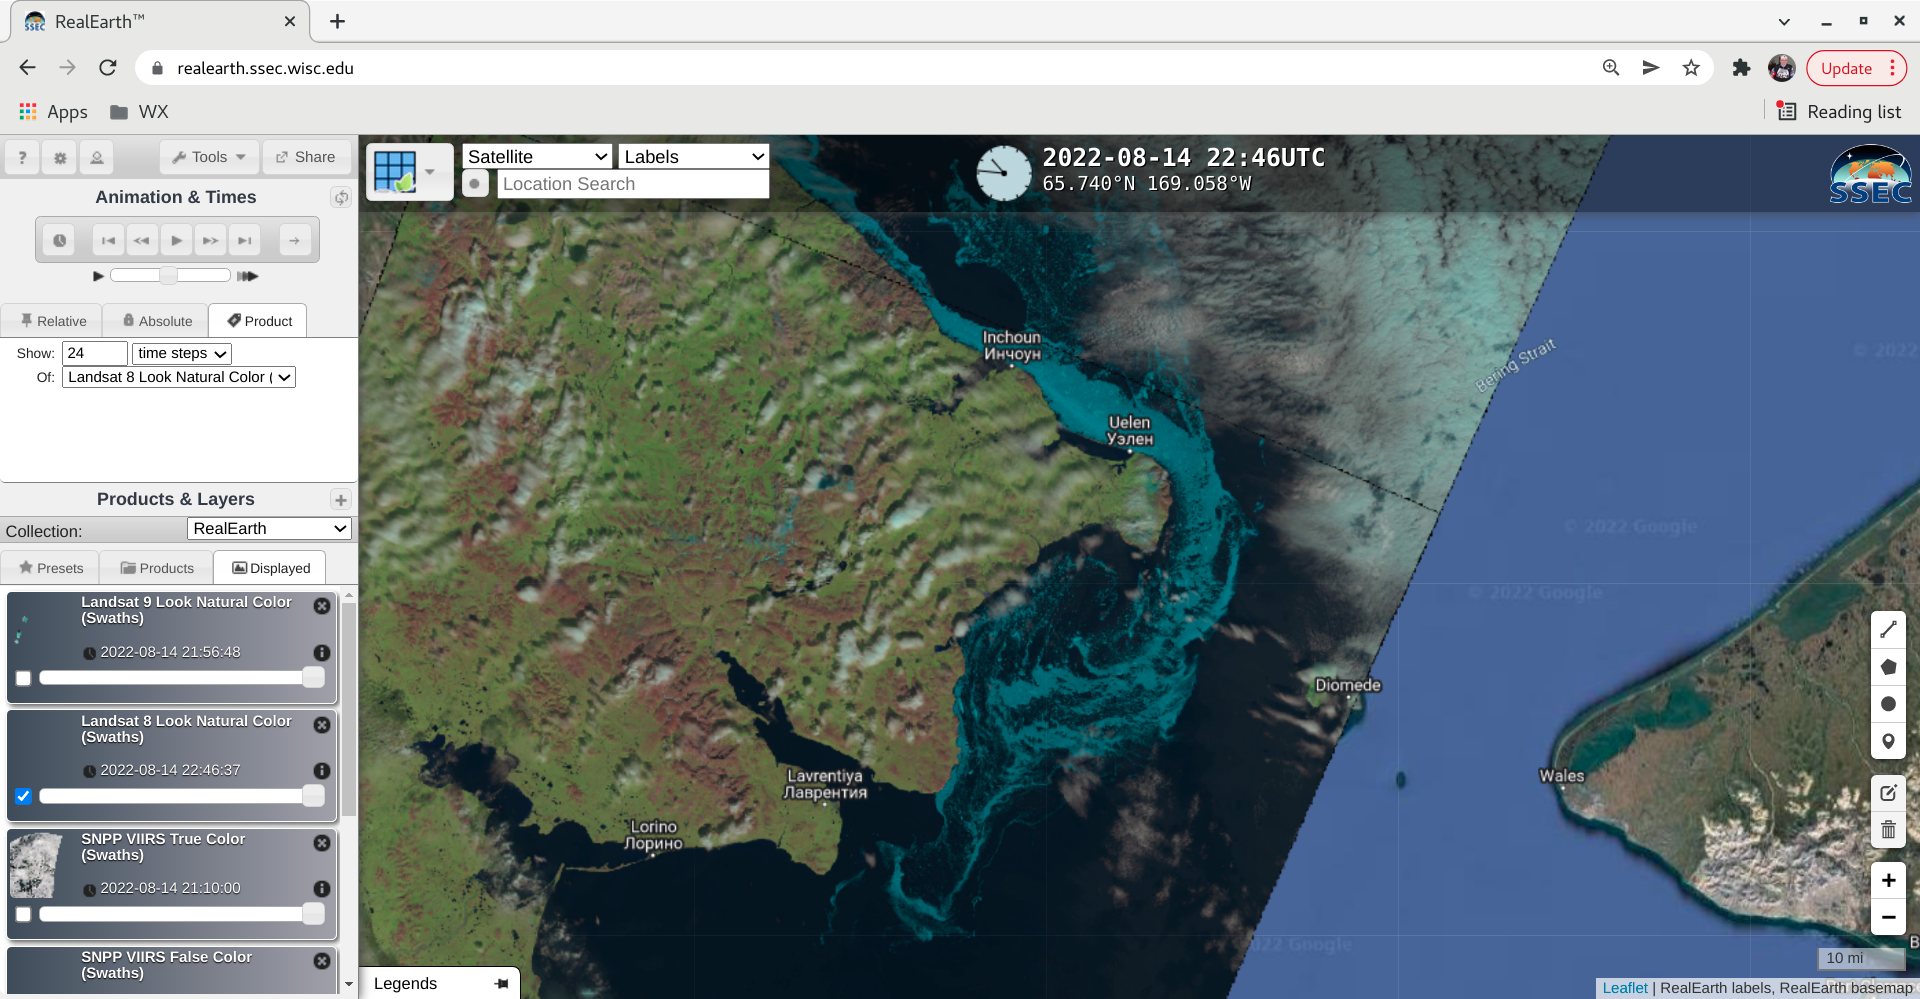
A sequence of 375-meter resolution VIIRS False Color RGB images from NOAA-20 and Suomi-NPP viewed using RealEarth (below) displayed a more detailed view of the sea ice (brighter shades of cyan).
VIIRS False Color RGB images from NOAA-20 and Suomi-NPP [click to enlarge]
A 30-meter resolution Landsat-8 False Color RGB image (below) provided an even more detailed depiction of the sea ice structure and coverage.

Landsat-8 False Color RGB image [click to enlarge]
H/T to Rick Thoman (University of Alaska, Fairbanks), who pointed out that this sea ice was evident in the Bering Sea on 09 August. More information on this unusual sea ice event is available on this NWS SeaIce Program storymap.
===== 21 August Update =====

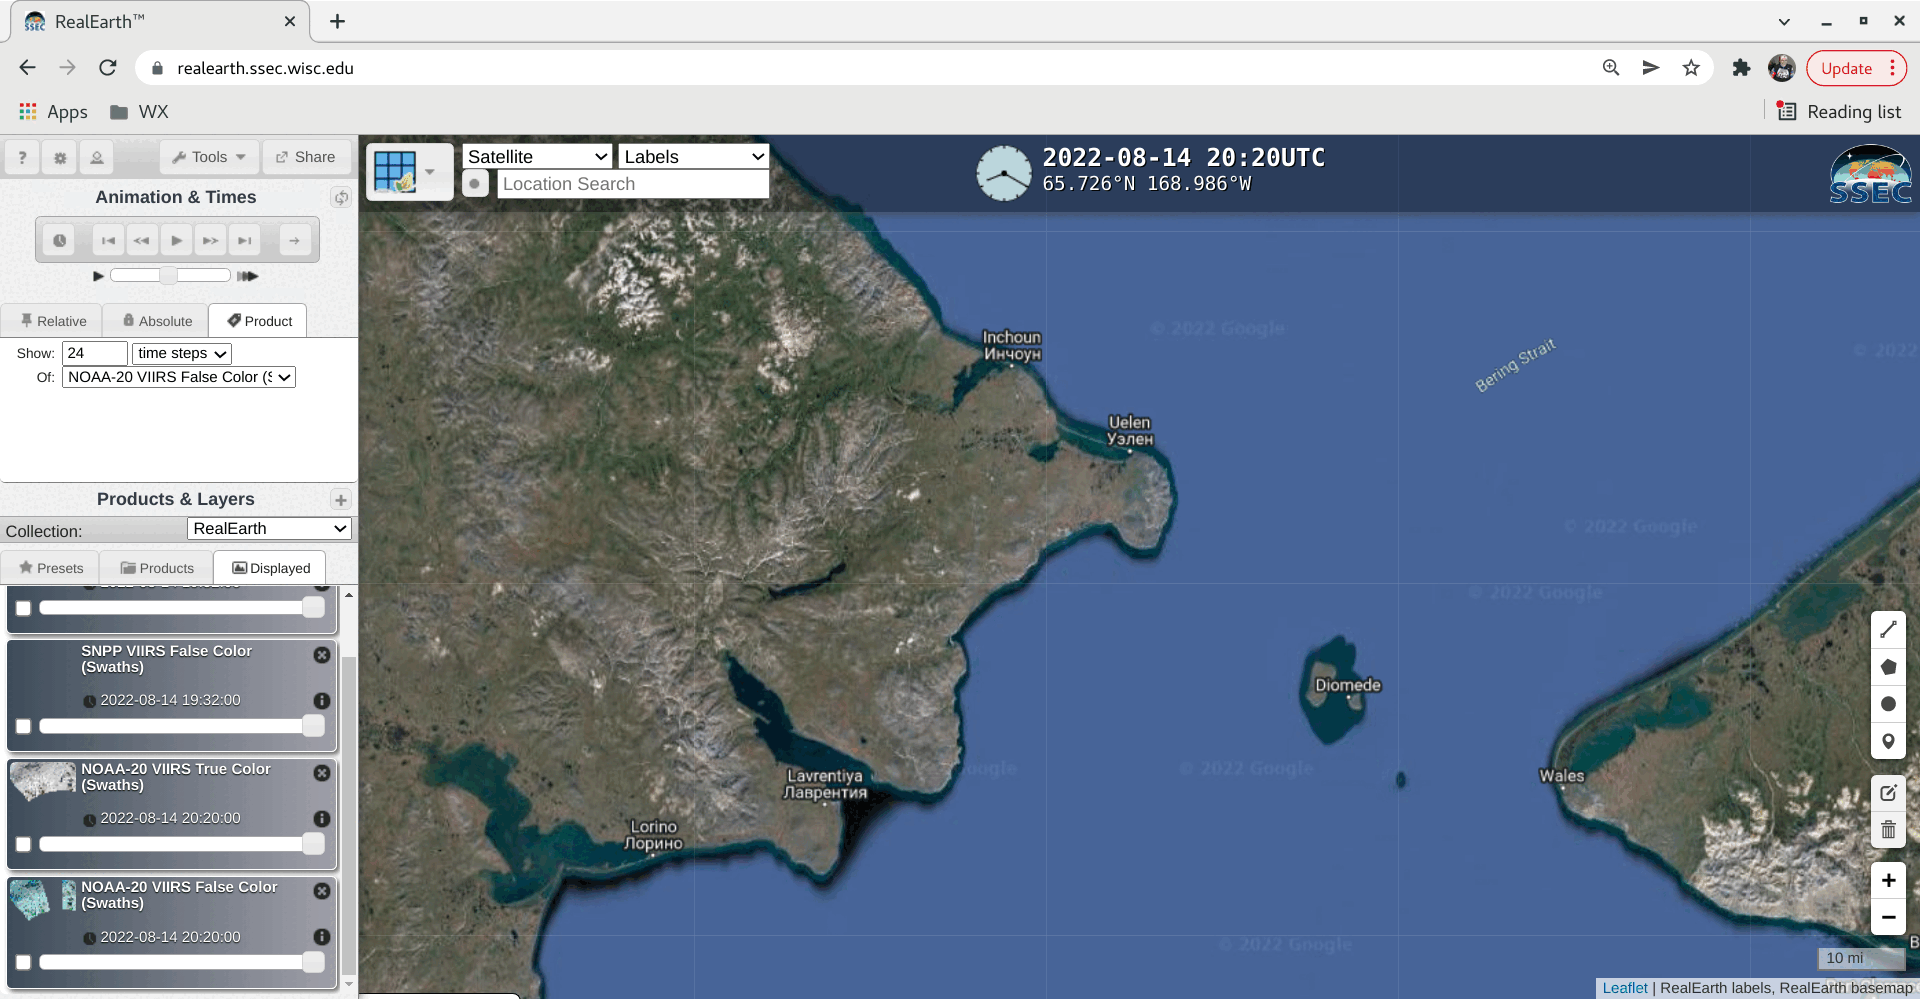
VIIRS False Color RGB images from Suomi-NPP and NOAA-20 [click to enlarge]
One week later, another sequence of VIIRS False Color RGB images from Suomi-NPP and NOAA-20 on 21 August (above) indicated that the sea ice had moved a bit farther to the southwest along the Chukotka coast, with much of it located within Mechigmenskiy Zaliv due south of Lorino.
GOES-18 True Color RGB images (below) showed the motion of this sea ice during the day.
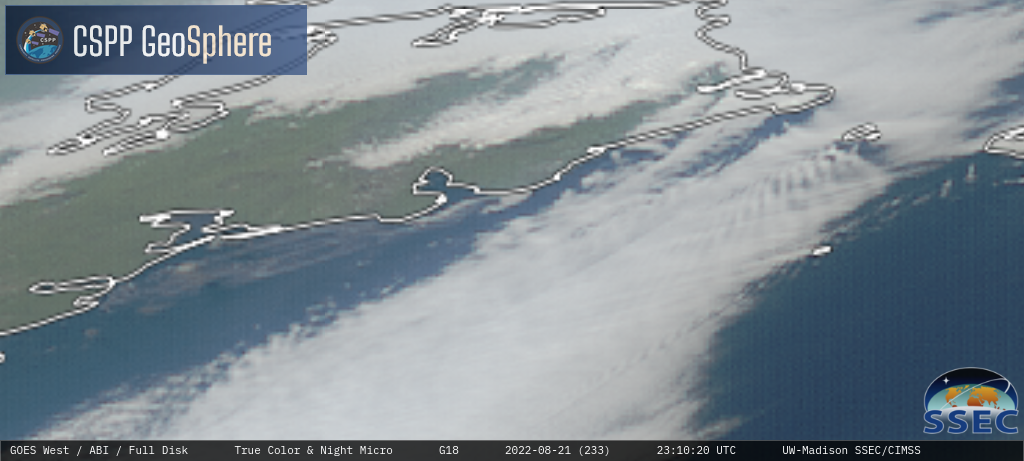
GOES-18 True Color RGB images [click to play MP4 animation]
View only this post Read Less


