Geo2grid includes a series of shell scripts that manipulate various satellite inputs to create (beautiful!) full-resolution high-qulality imagery. Geo2grid version 1.1 was released in late 2022 and this blog post shows how to create a new RGB definition and display the data. The Tropical Version of the Airmass RGB is useful because if has better contrast (than in the traditional airmass RGB) in mid/high-level clouds, giving a 24-hour view of cold cloud tops (that you might view in daytime with the Convection RGB, for example). The Pacific Tropical Air Mass RGB in use at the NWS in Guam, for example, has the same Red and Blue RGB components as the Air Mass RGB: Red is the Split Water Vapor Difference (Band 8 – Band 10, with values from -26.2 to 0.6oC; Blue is the Upper-Level water vapor brightness temperature, from -29.25 to -64.45oC). However, the Green Band values, Band 12 – Band 13, are changed from -43.2 to 6.7oC for the airmass RGB to -26.2 to 27.4oC for the Pacific Tropical Airmass RGB. How is this new definition implemented?
The images displayed below are from Himawari-9 AHI data. New RGB definitions must be input in two different files within geo2grid, in $GEO2GRID_HOME/etc/polar2grid/enhancements/ahi.yaml and $GEO2GRID_HOME/etc/polar2grid/composites/ahi.yaml ; if you were creating definitions for ABI data, then abi.yaml files would have to be changed. The addition to the ahi.yaml file in the composites directory is shown below. The name of the RGB is ‘pactropicalairmass’ and its three components are the B08 – B10 difference, the B12 – B13 difference, and Band 08.
  pactropicalairmass:
    compositor: !!python/name:satpy.composites.GenericCompositor
    prerequisites:
      - compositor: !!python/name:satpy.composites.DifferenceCompositor
        prerequisites:
        - name: B08
        - name: B10
      - compositor: !!python/name:satpy.composites.DifferenceCompositor
        prerequisites:
        - name: B12
        - name: B13
      - name: B08
    standard_name: pactropicalairmass
The ahi.yaml file in the enhancement directory must be amended, as shown below. This snippet of code describes a stretch of the data for the three RGB components: from -26.2 to 0.6, from -26.2 to 27.4, and from 243.9 to 208.5 for Red, Green and Blue, respectively. Note in this case that the blue stretch is actually inverted, from warm to cold. If brightness temperature difference fields are being described, use oC. If simple brightness temperatures are being described, use Kelvin.
  pactropicalairmass_ahi:
    standard_name: polartropicalairmass
    name: polartropicalairmass
    operations:
      - name: stretch
        method: !!python/name:satpy.enhancements.stretch
        kwargs:
          stretch: crude
          min_stretch: [-26.2, -26.2, 243.9]
          max_stretch: [0.6, 27.4, 208.5]
It’s always a good idea to test geo2grid with the –list-products-all flag, to see if the input definition is understood, and indeed, when that was done, the output (that has been edited) below was produced. The ‘pactropicalairmass’ RGB is understood.
../geo2grid.sh -r ahi_hsd -w geotiff --list-products-all  -f /path_to_data/himawari09/ahi/2023/2023_04_19_109/0000/*FLDK*
INFO     : Sorting and reading input files...
INFO     : Loading product metadata from files...

### Custom User Products
*pactropicalairmass
*true_color_night

### Non-standard Satpy Products
[long list snipped to save space]


### Standard Available Geo2Grid Products
B01 B02 B03 B04 B05 B06 B07 B08 B09 B10 B11 B12 B13 B14 B15 B16
airmass ash dust fog natural_color night_microphysics true_color
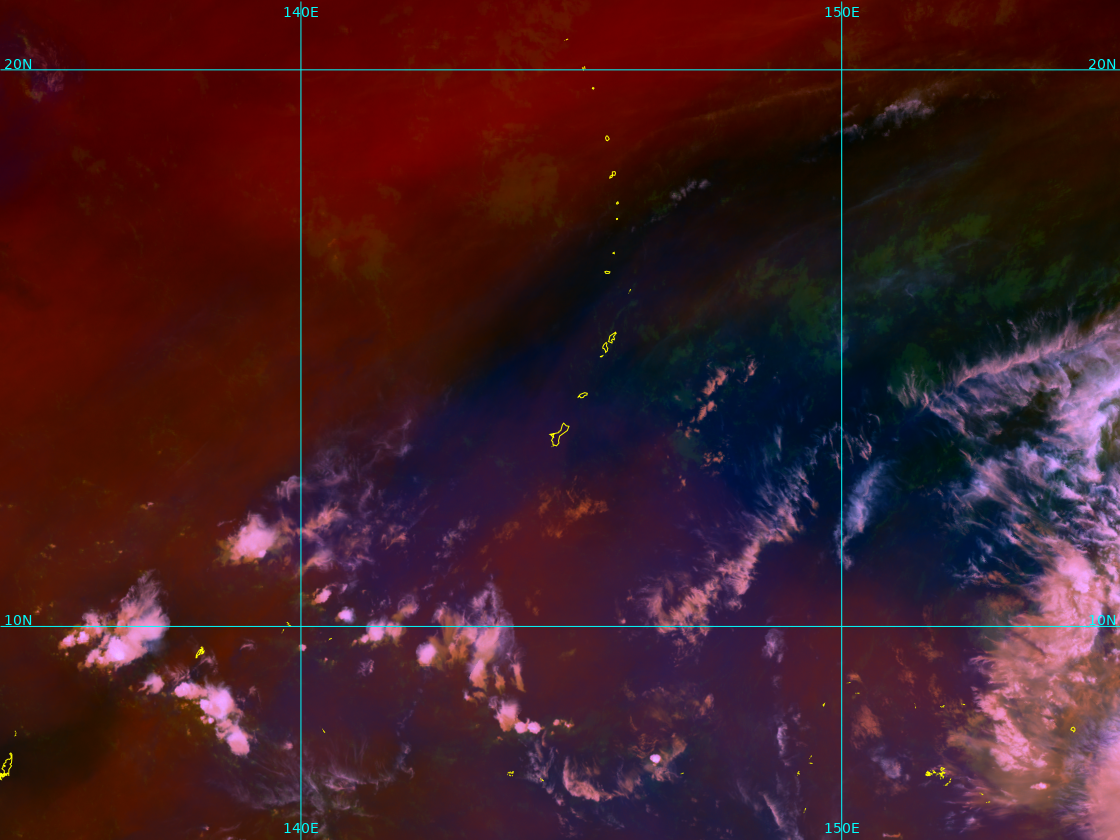
The geo2grid call below will create both the ‘regular’ airmass RGB and the ‘pactropical’ airmass RGB, in this case on 20 April 2023 at 0000 UTC for a pre-defined ‘Guam’ map (the p2g_grid_helper.sh call that created the Guam map is in this blog post). The output are geotiff files.
../geo2grid.sh -r ahi_hsd -w geotiff -p pactropicalairmass airmass -g Guam --grid-configs $GEO2GRID_HOME/Guam.yaml -f /path_to_HSD_data/2023_04_20_110/0000/*FLDK*The toggle below compares the two fields from 0000 UTC 20 April 2023. Coastlines and lat/lon grid lines were added using this command within the geo2grid package: add_coastlines.sh --add-coastlines --add-grid --grid-d 10.0 10.0 --grid-D 10.0 10.0 --grid-text-size 14 *.tif
CSPP Geo2grid (free!) software is available for download here. A one-time registration is required.
View only this post Read Less

