Severe thunderstorms produce tornadoes and damaging winds in Texas and Louisiana
GOES-16 “Red” Visible (0.64 µm, top) and “Clean” Infrared Window (10.3 µm, bottom) images, with time-matched SPC Storm Reports plotted in red/cyan [click to play animated GIF | MP4]

GOES-16 “Clean” Infrared Window (10.3 µm), Cloud Top Temperature and Cloud Top Height products at 2124 UTC [click to enlarge]
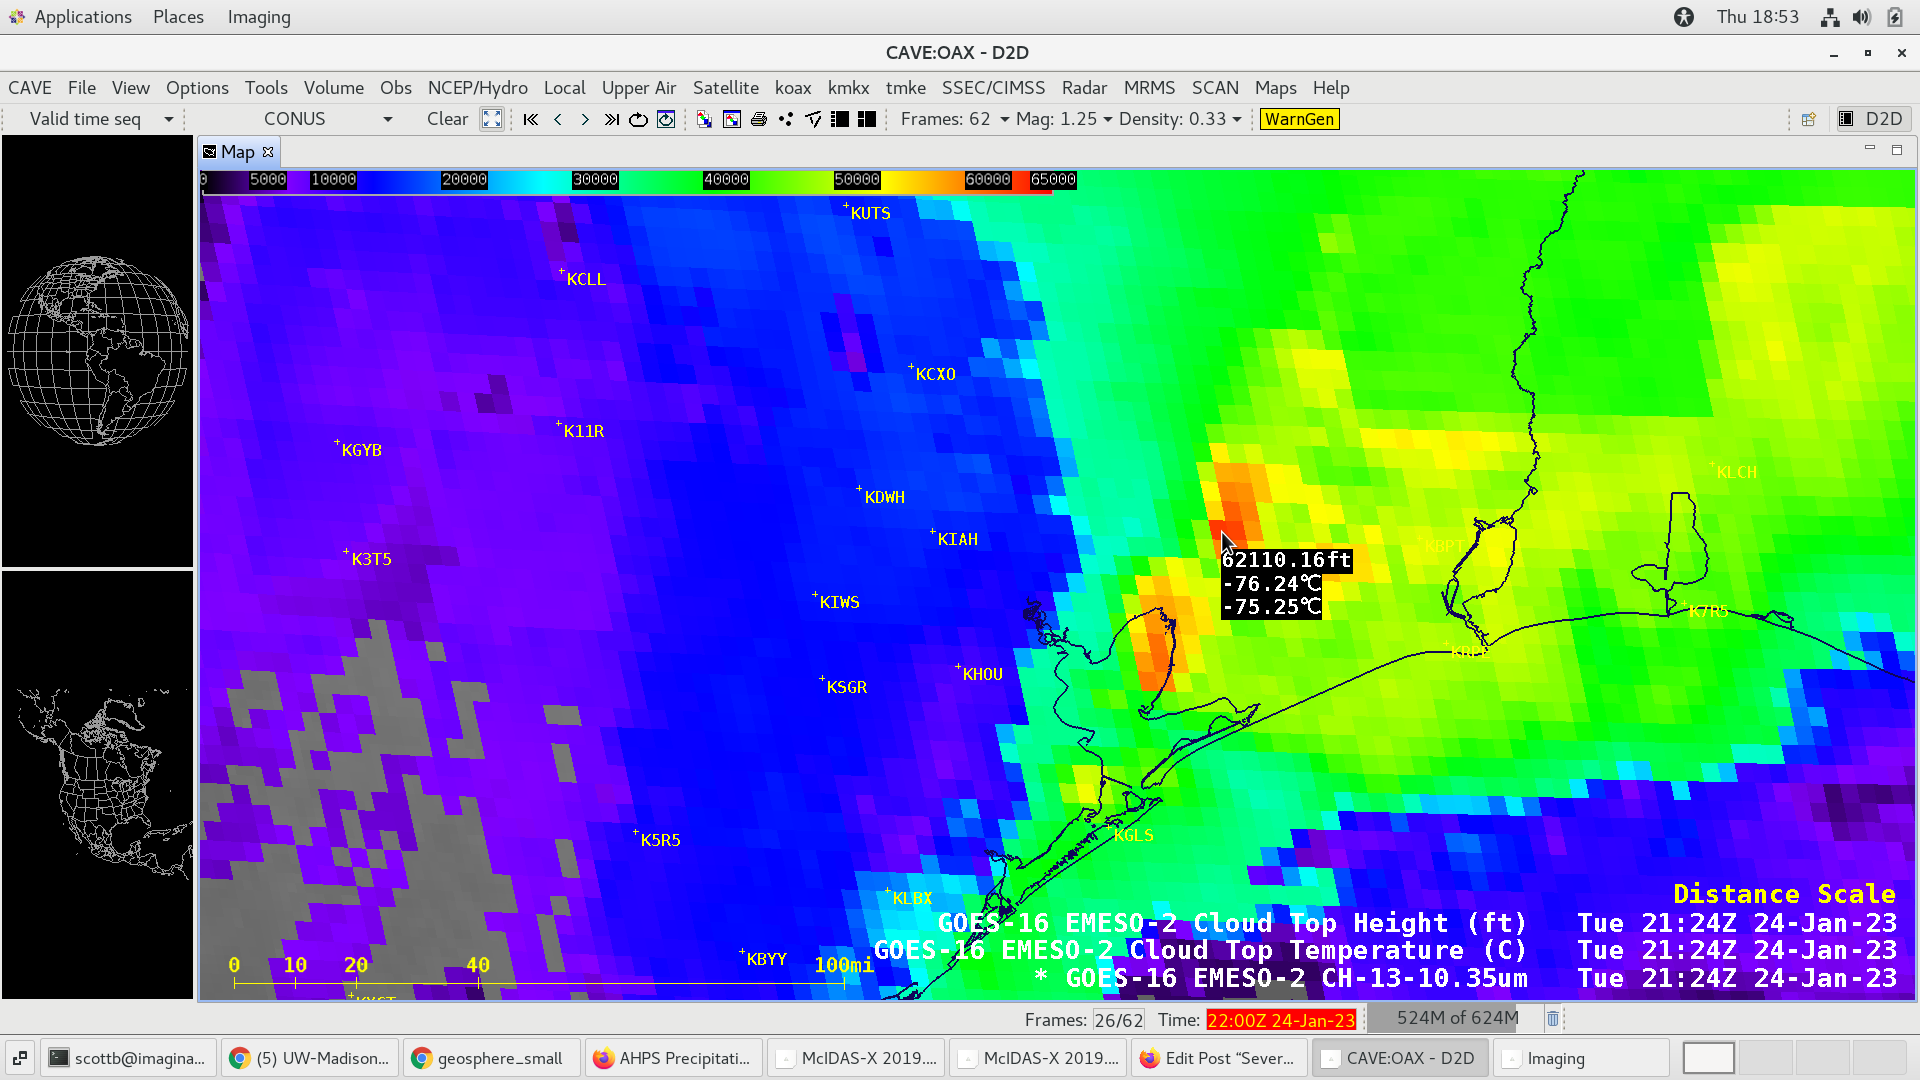
Cursor sampling of GOES-16 “Clean” Infrared Window (10.3 µm), Cloud Top Temperature and Cloud Top Height products at 2124 UTC [click to enlarge]

GOES-16 “Clean” Infrared Window (10.3 µm, top) and “Red” Visible (0.64 µm, bottom) images, with and without an overlay of GLM Flash Extent Density [click to play MP4 | animated GIF]
Two more animations were created over a larger spatial domain than shown above. Here’s is the GOES-16 Mesoscale 2 Sector Band 2 (0.64 µm) from 1620 – 2229 UTC (as an mp4 animation), and here is the same mp4 animation but with GLM 5-minute Flash Extent Density overlain.