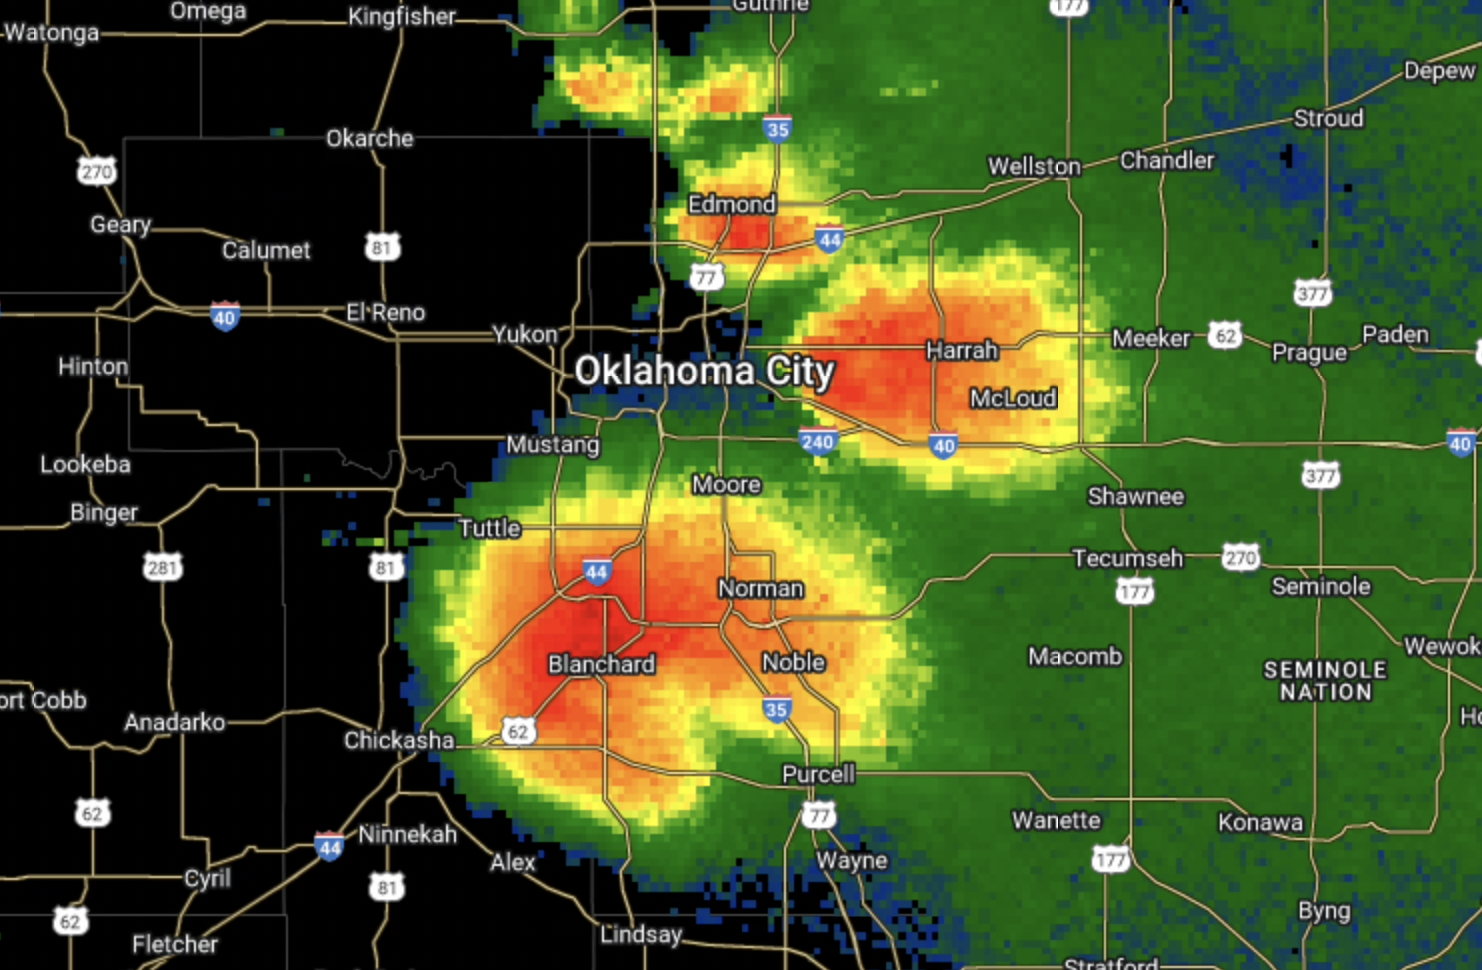
There was a conditional outlook for severe storms in Oklahoma on April 19th, owing to uncertainty in the forcing for ascent and a stout warm-sector cap. Well, the cap broke, and mayhem ensued in central Oklahoma.
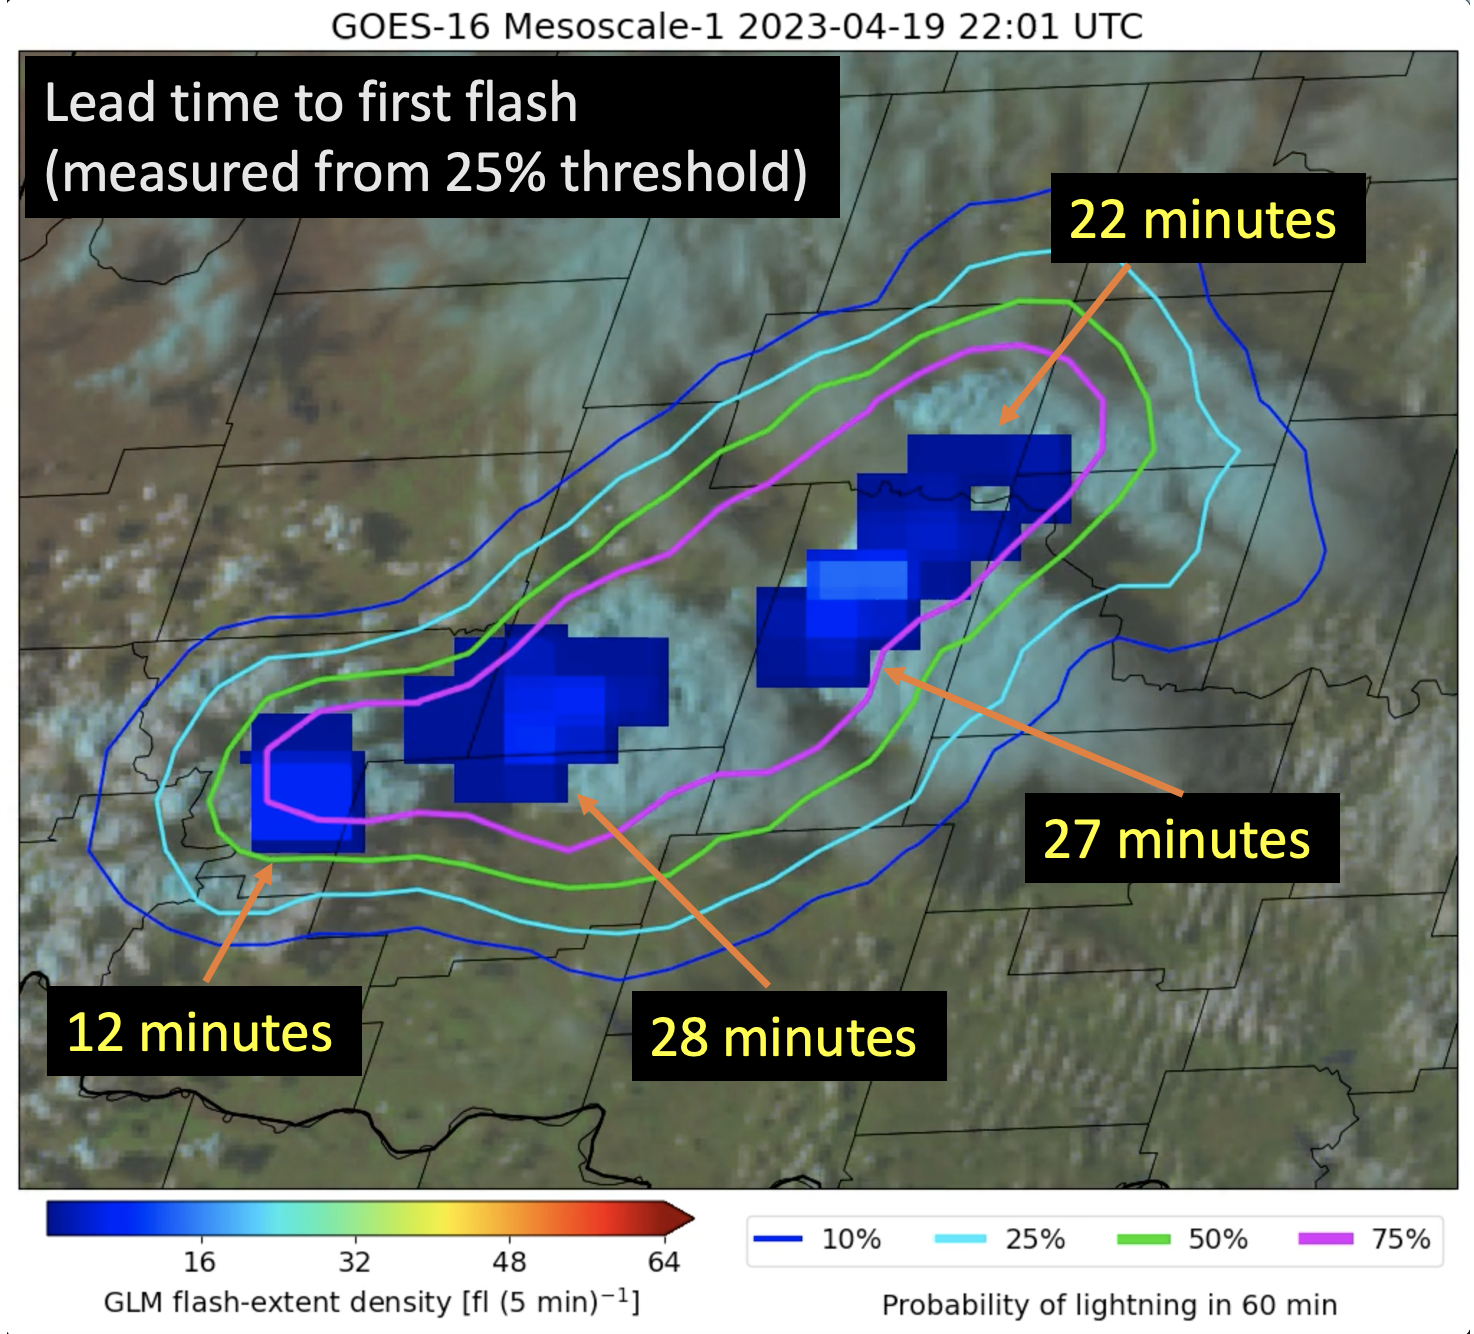
A break in the cirrus deck in southwest Oklahoma likely contributed to surface heating and enhanced mixing of the boundary layer, allowing the cap to break. ProbSevere LightningCast, an AI model that uses solely images of ABI data to predict next-hour lightning at any given point, was able to capture lightning initiation (Figure 1). Glaciating cloud tops are a prime signal of imminent lightning, and the one-minute scans from the GOES-16 mesoscale sector helped the model maximize lead time (Figure 2).

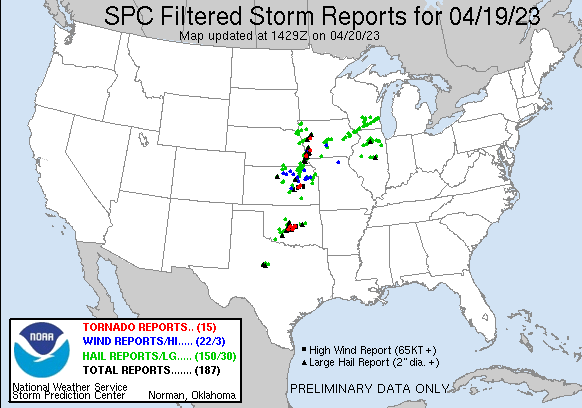
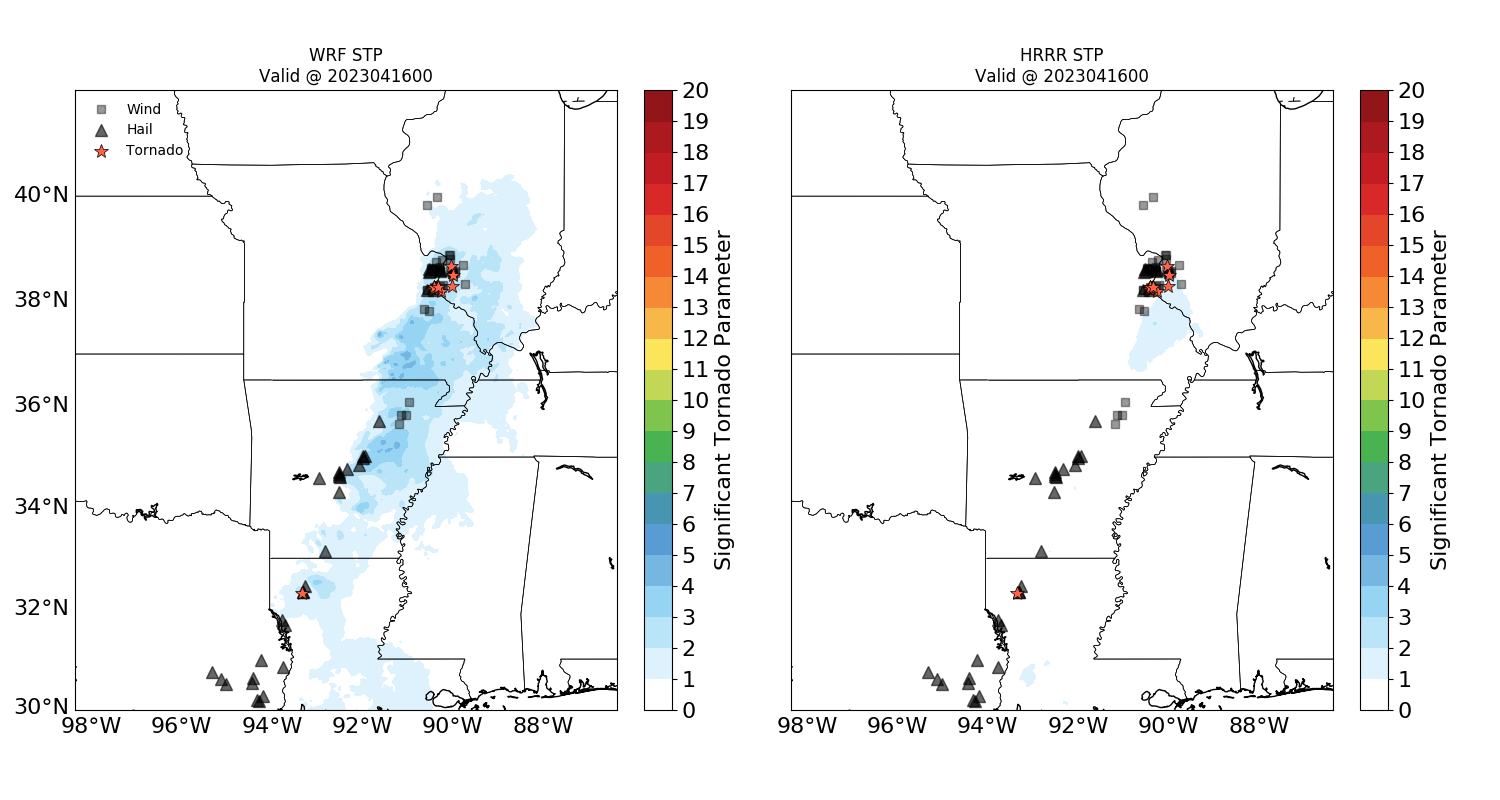
ProbSevere version 3, a set of machine-learning models that predicts probabilities of severe weather hazards in the near future, was able to track these storms as they became severe (Figure 3). These storms produced huge hail (up to 3″ in diameter), straight-line winds exceeding 80 mph, and deadly tornadoes (Figure 4). One aspect of ProbSevere’s automated guidance that forecasters have frequently reported is that during busy situations, ProbSevere helps them quickly triage which storms or threats to prioritize and investigate further. In this outbreak, most storms had at least severe thunderstorm warnings, while several were tornado-warned. Both ProbSevere v3 and LightningCast will be evaluated by forecasters at NOAA’s Hazardous Weather Testbed this spring.
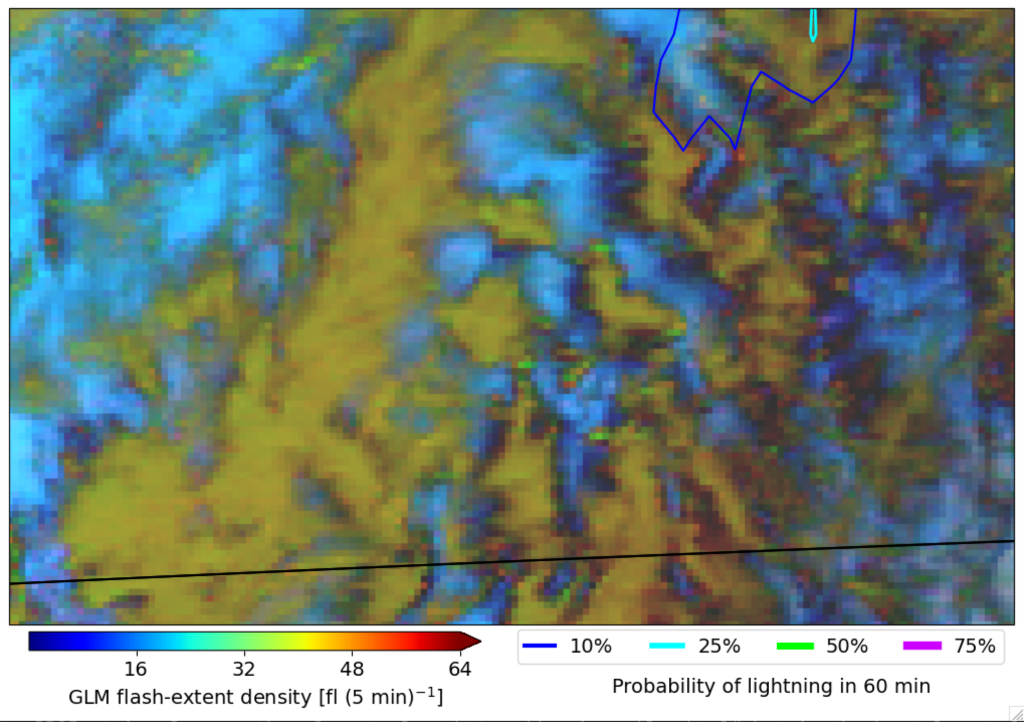
Just a little further north in Kansas, LightningCast was able to correctly predict lightning initiation (with about 16 minutes of lead time) for the storm despite moderate overlapping cirrus clouds (Figure 5). Despite the obscuring ice clouds, LightningCast was able to discern elevated lightning potential with the aid of the visible red band (0.64-µm reflectance), snow-ice band (1.6-µm reflectance), and long-wave infrared bands (10.3-µm and 12.3-µm brightness temperatures) and the spatial patterns evident in the growing cumuliform clouds.
In fact, for this storm, the reflective bands were quite important. When they were removed from the model (a “data-denial” experiment), the probability of lightning was < 10% for this convection at 21:25 UTC, whereas the full LightningCast model produced a maximum probability of about 50% at this time (Figure 6). While we have found that LightningCast performs quite well at night (when the reflective bands are uniformly zero), moderate cirrus cover at night might be an instance where users should expect less lead time to lightning initiation.
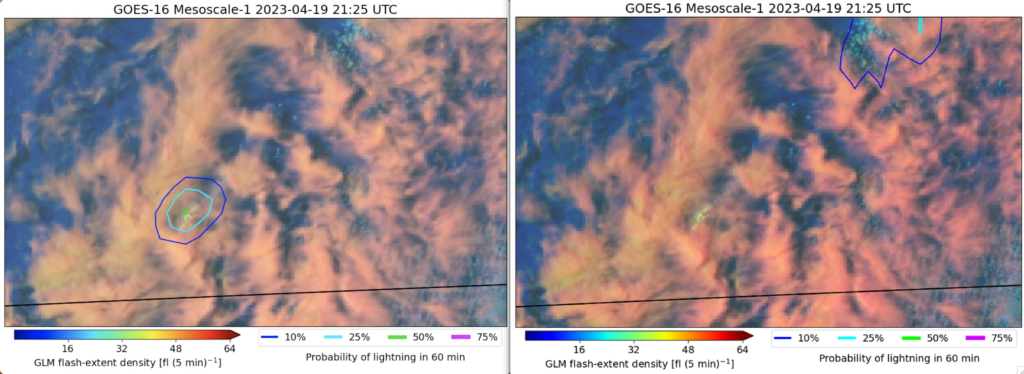
Notice how difficult it is to visually pick out growing convection in this scene, with only the long-wave infrared bands plotted. LightningCast can only discern what humans are able to pick out in the satellite imagery, but LightningCast does it quickly, automatically, objectively, and without ceasing, aiding forecasters in their decision making.
View only this post Read Less
