2.5-minute rapid scan (Target Sector) JMA Himawari-9 “Red” Visible and “Clean” Infrared Window images (above) showed Category 4 Cyclone Ilsa as it approached the northwest coast of Australia, eventually making landfall near Port Hedland (station identifier YPPD) just after 1500 UTC on 13 April 2023. Overshooting tops within the eyewall... Read More

JMA Himawari-9 “Red” Visible (0.64 µm, left) and “Clean” Infrared Window (10.4 µm, right) [click to play animated GIF | MP4]
2.5-minute rapid scan (Target Sector)
JMA Himawari-9 “Red” Visible and “Clean” Infrared Window images
(above) showed Category 4 Cyclone Ilsa as it approached the northwest coast of Australia, eventually making landfall near Port Hedland (station identifier YPPD) just after 1500 UTC on 13 April 2023. Overshooting tops within the eyewall region occasionally exhibited infrared brightness temperatures of -90ºC or colder (shades of yellow embedded within darker purple areas).
A Suomi-NPP ATMS Microwave (183 GHz) image from the CIMSS Tropical Cyclones site (below) displayed a closed eyewall structure at 0543 UTC, with a spiral band extending southward.
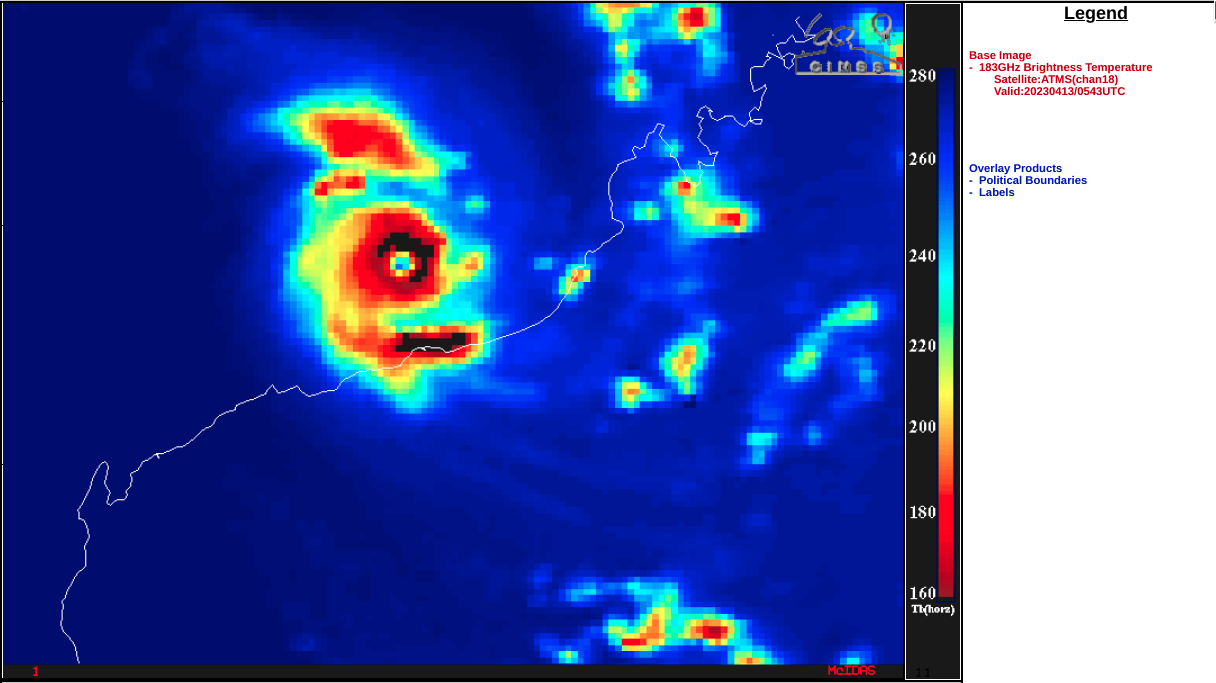
Suomi-NPP ATMS Microwave (183 GHz) image at 0543 UTC [click to enlarge]
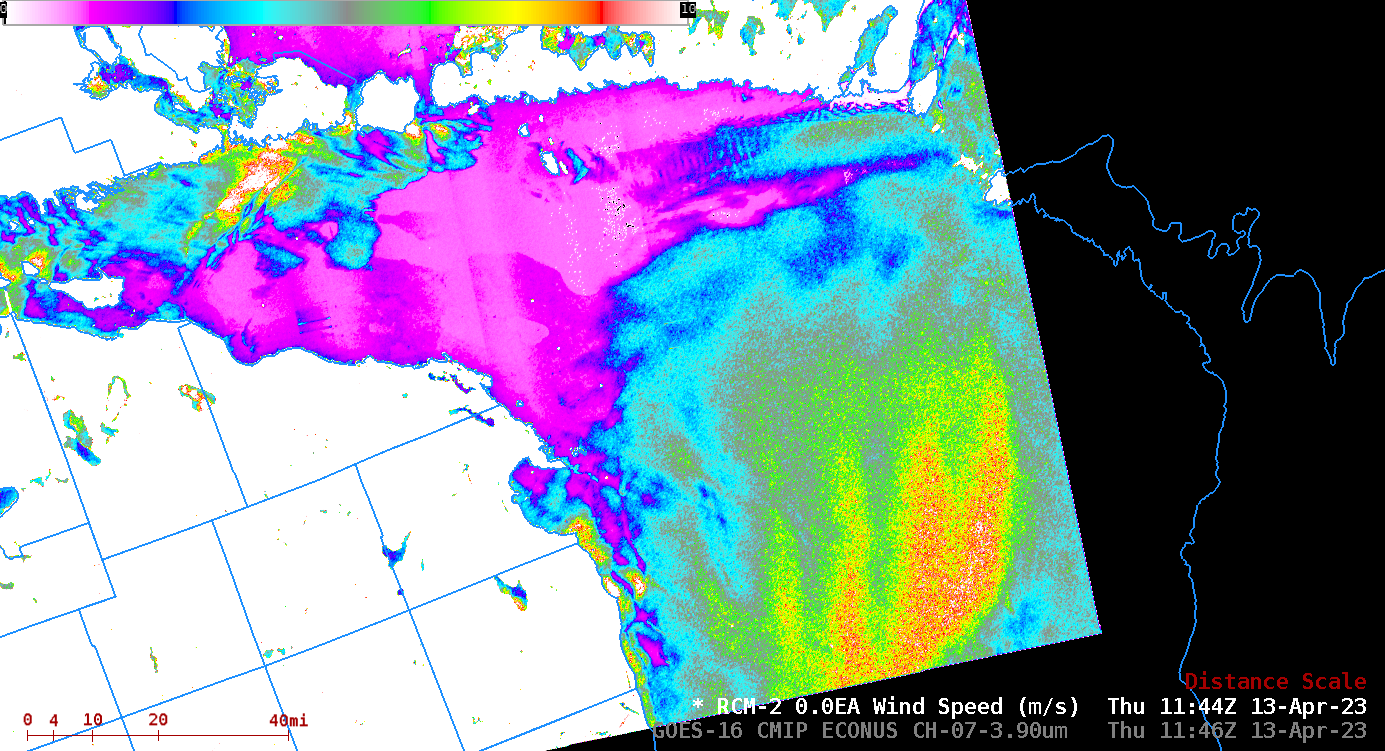
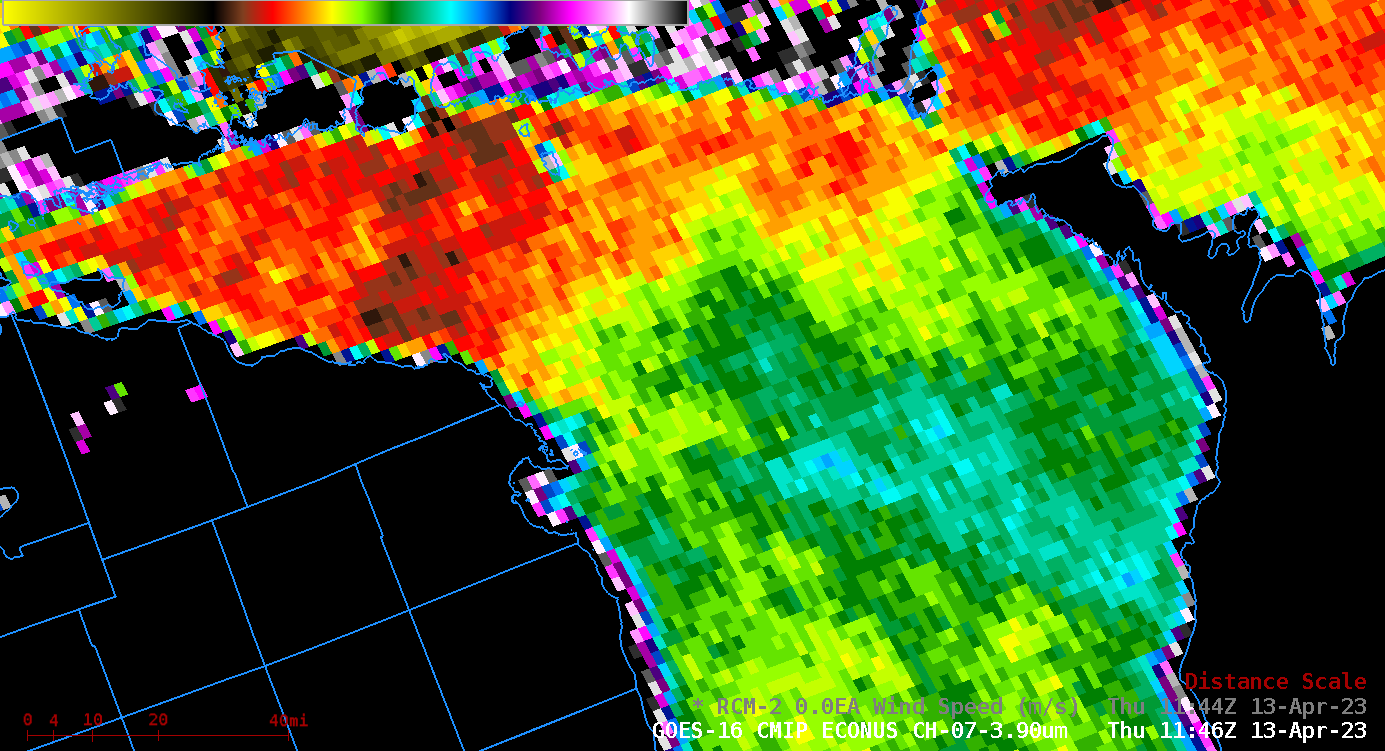
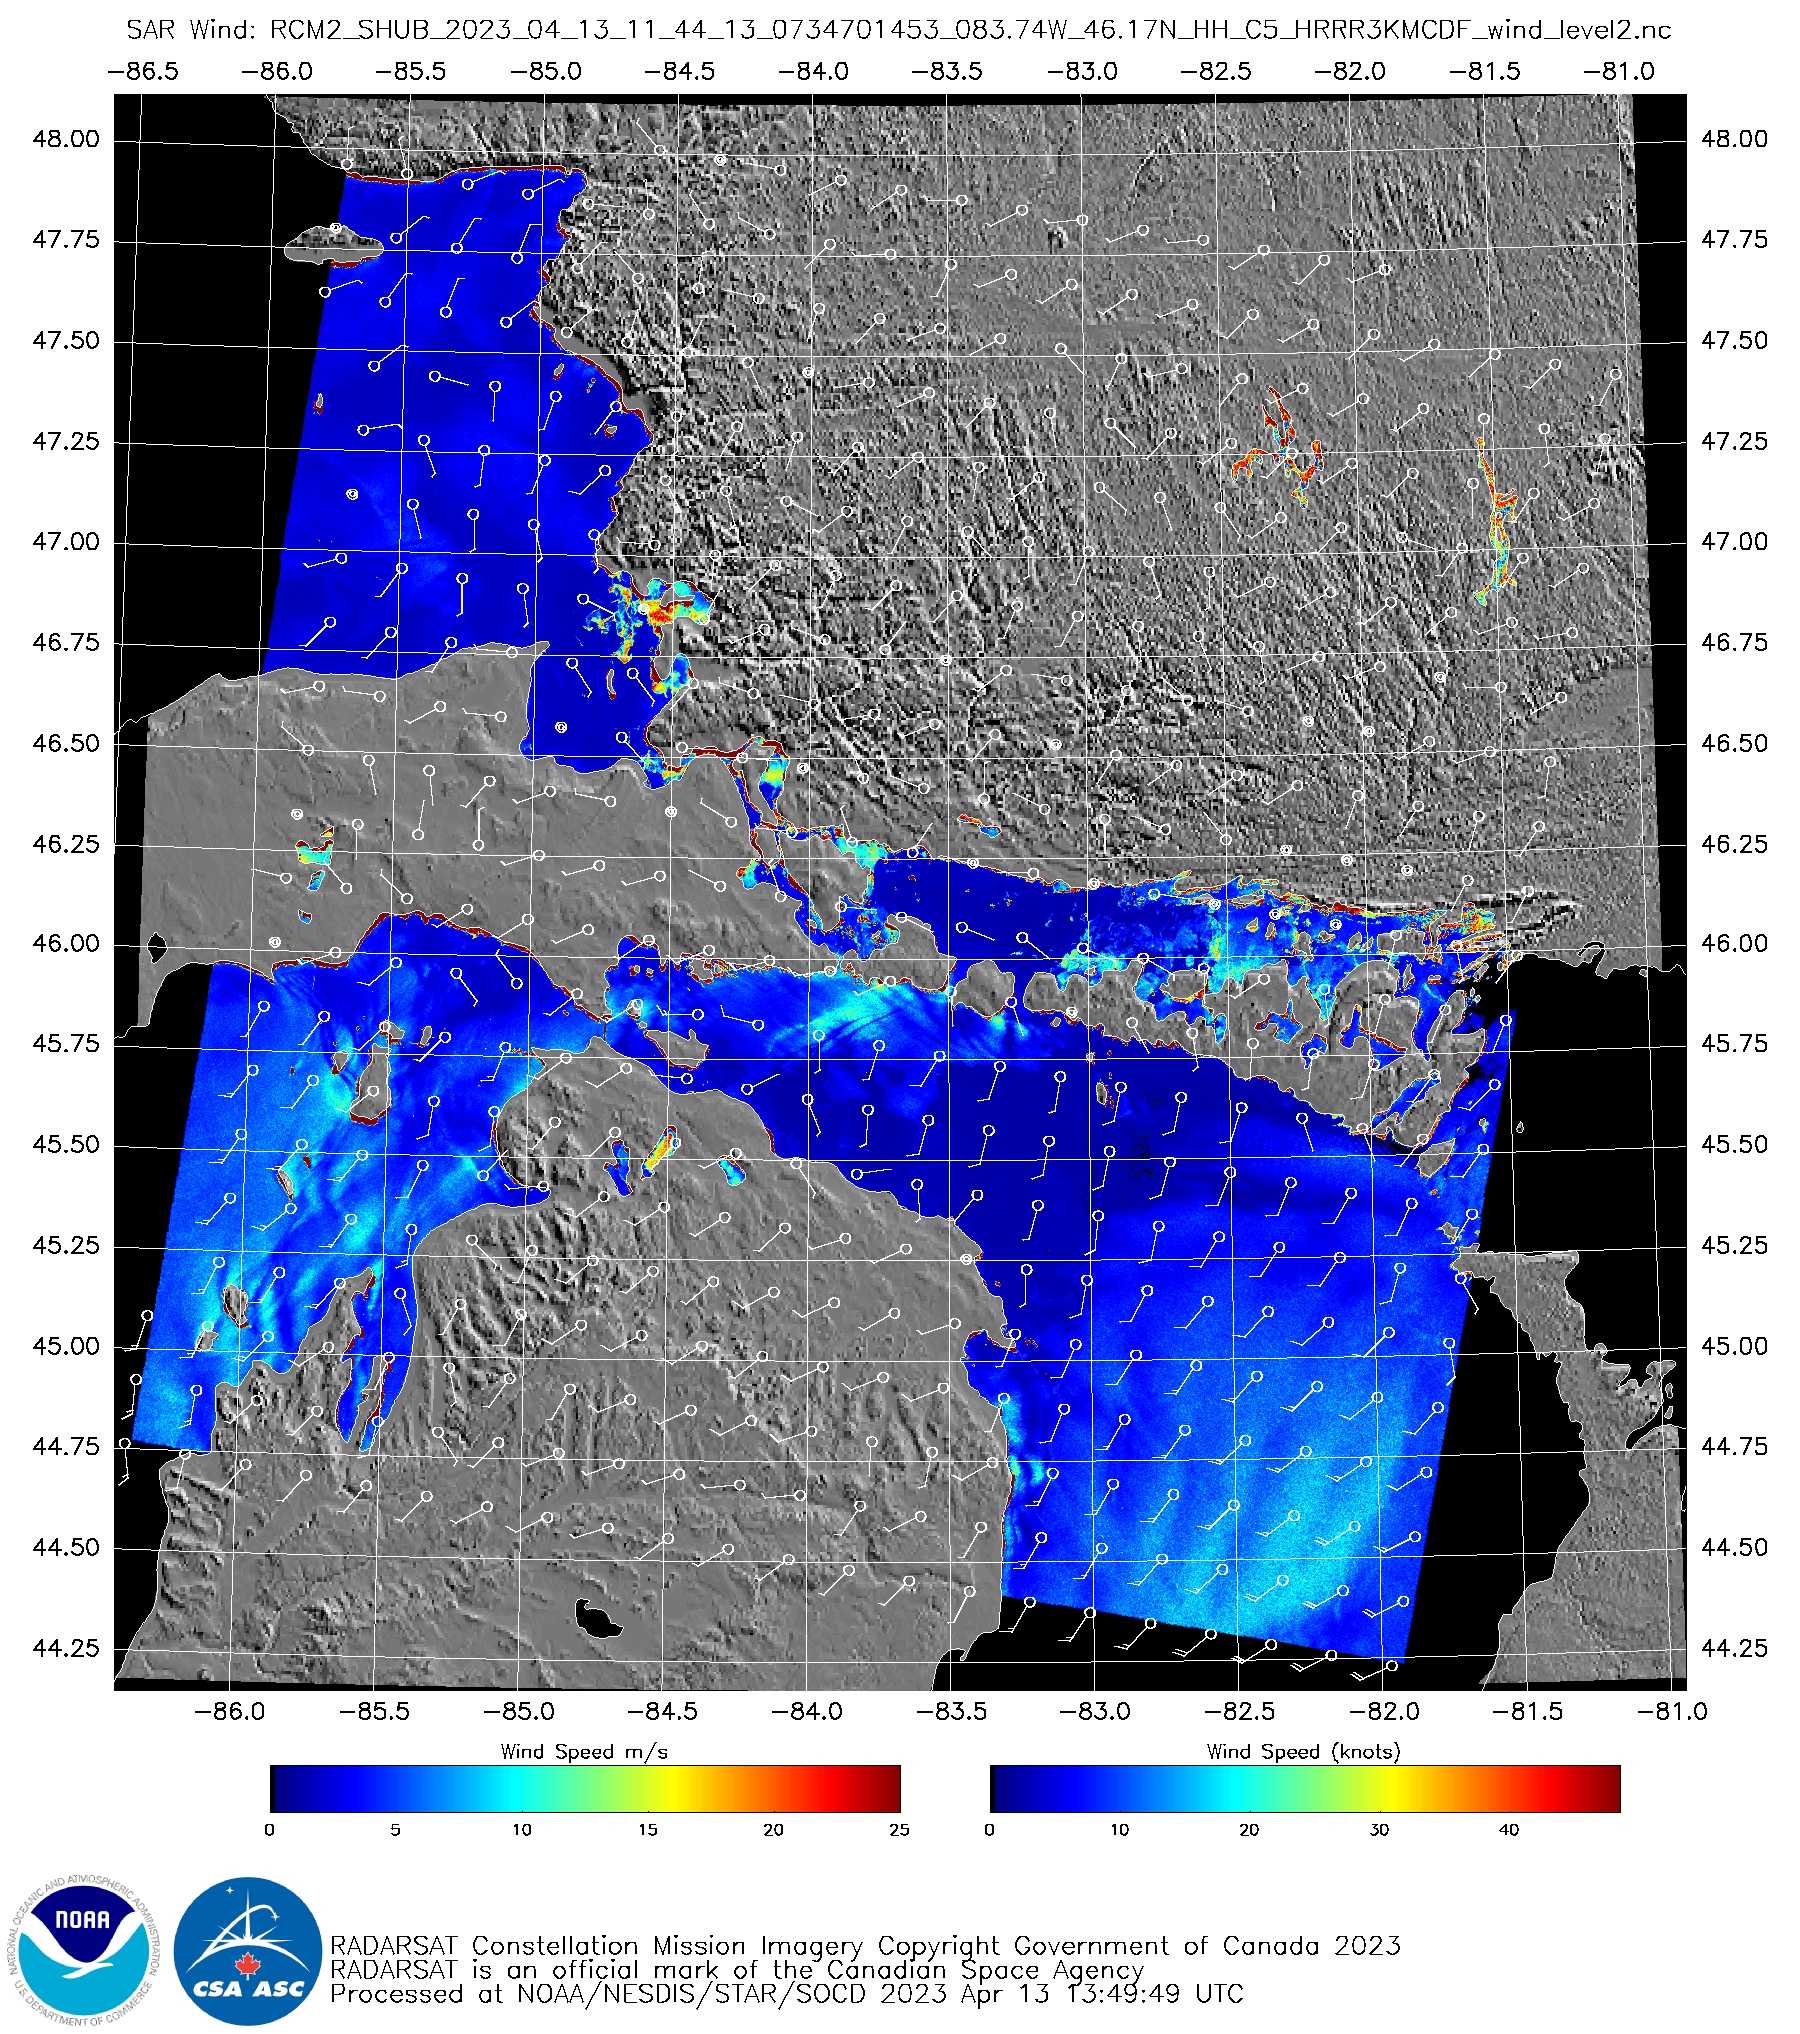
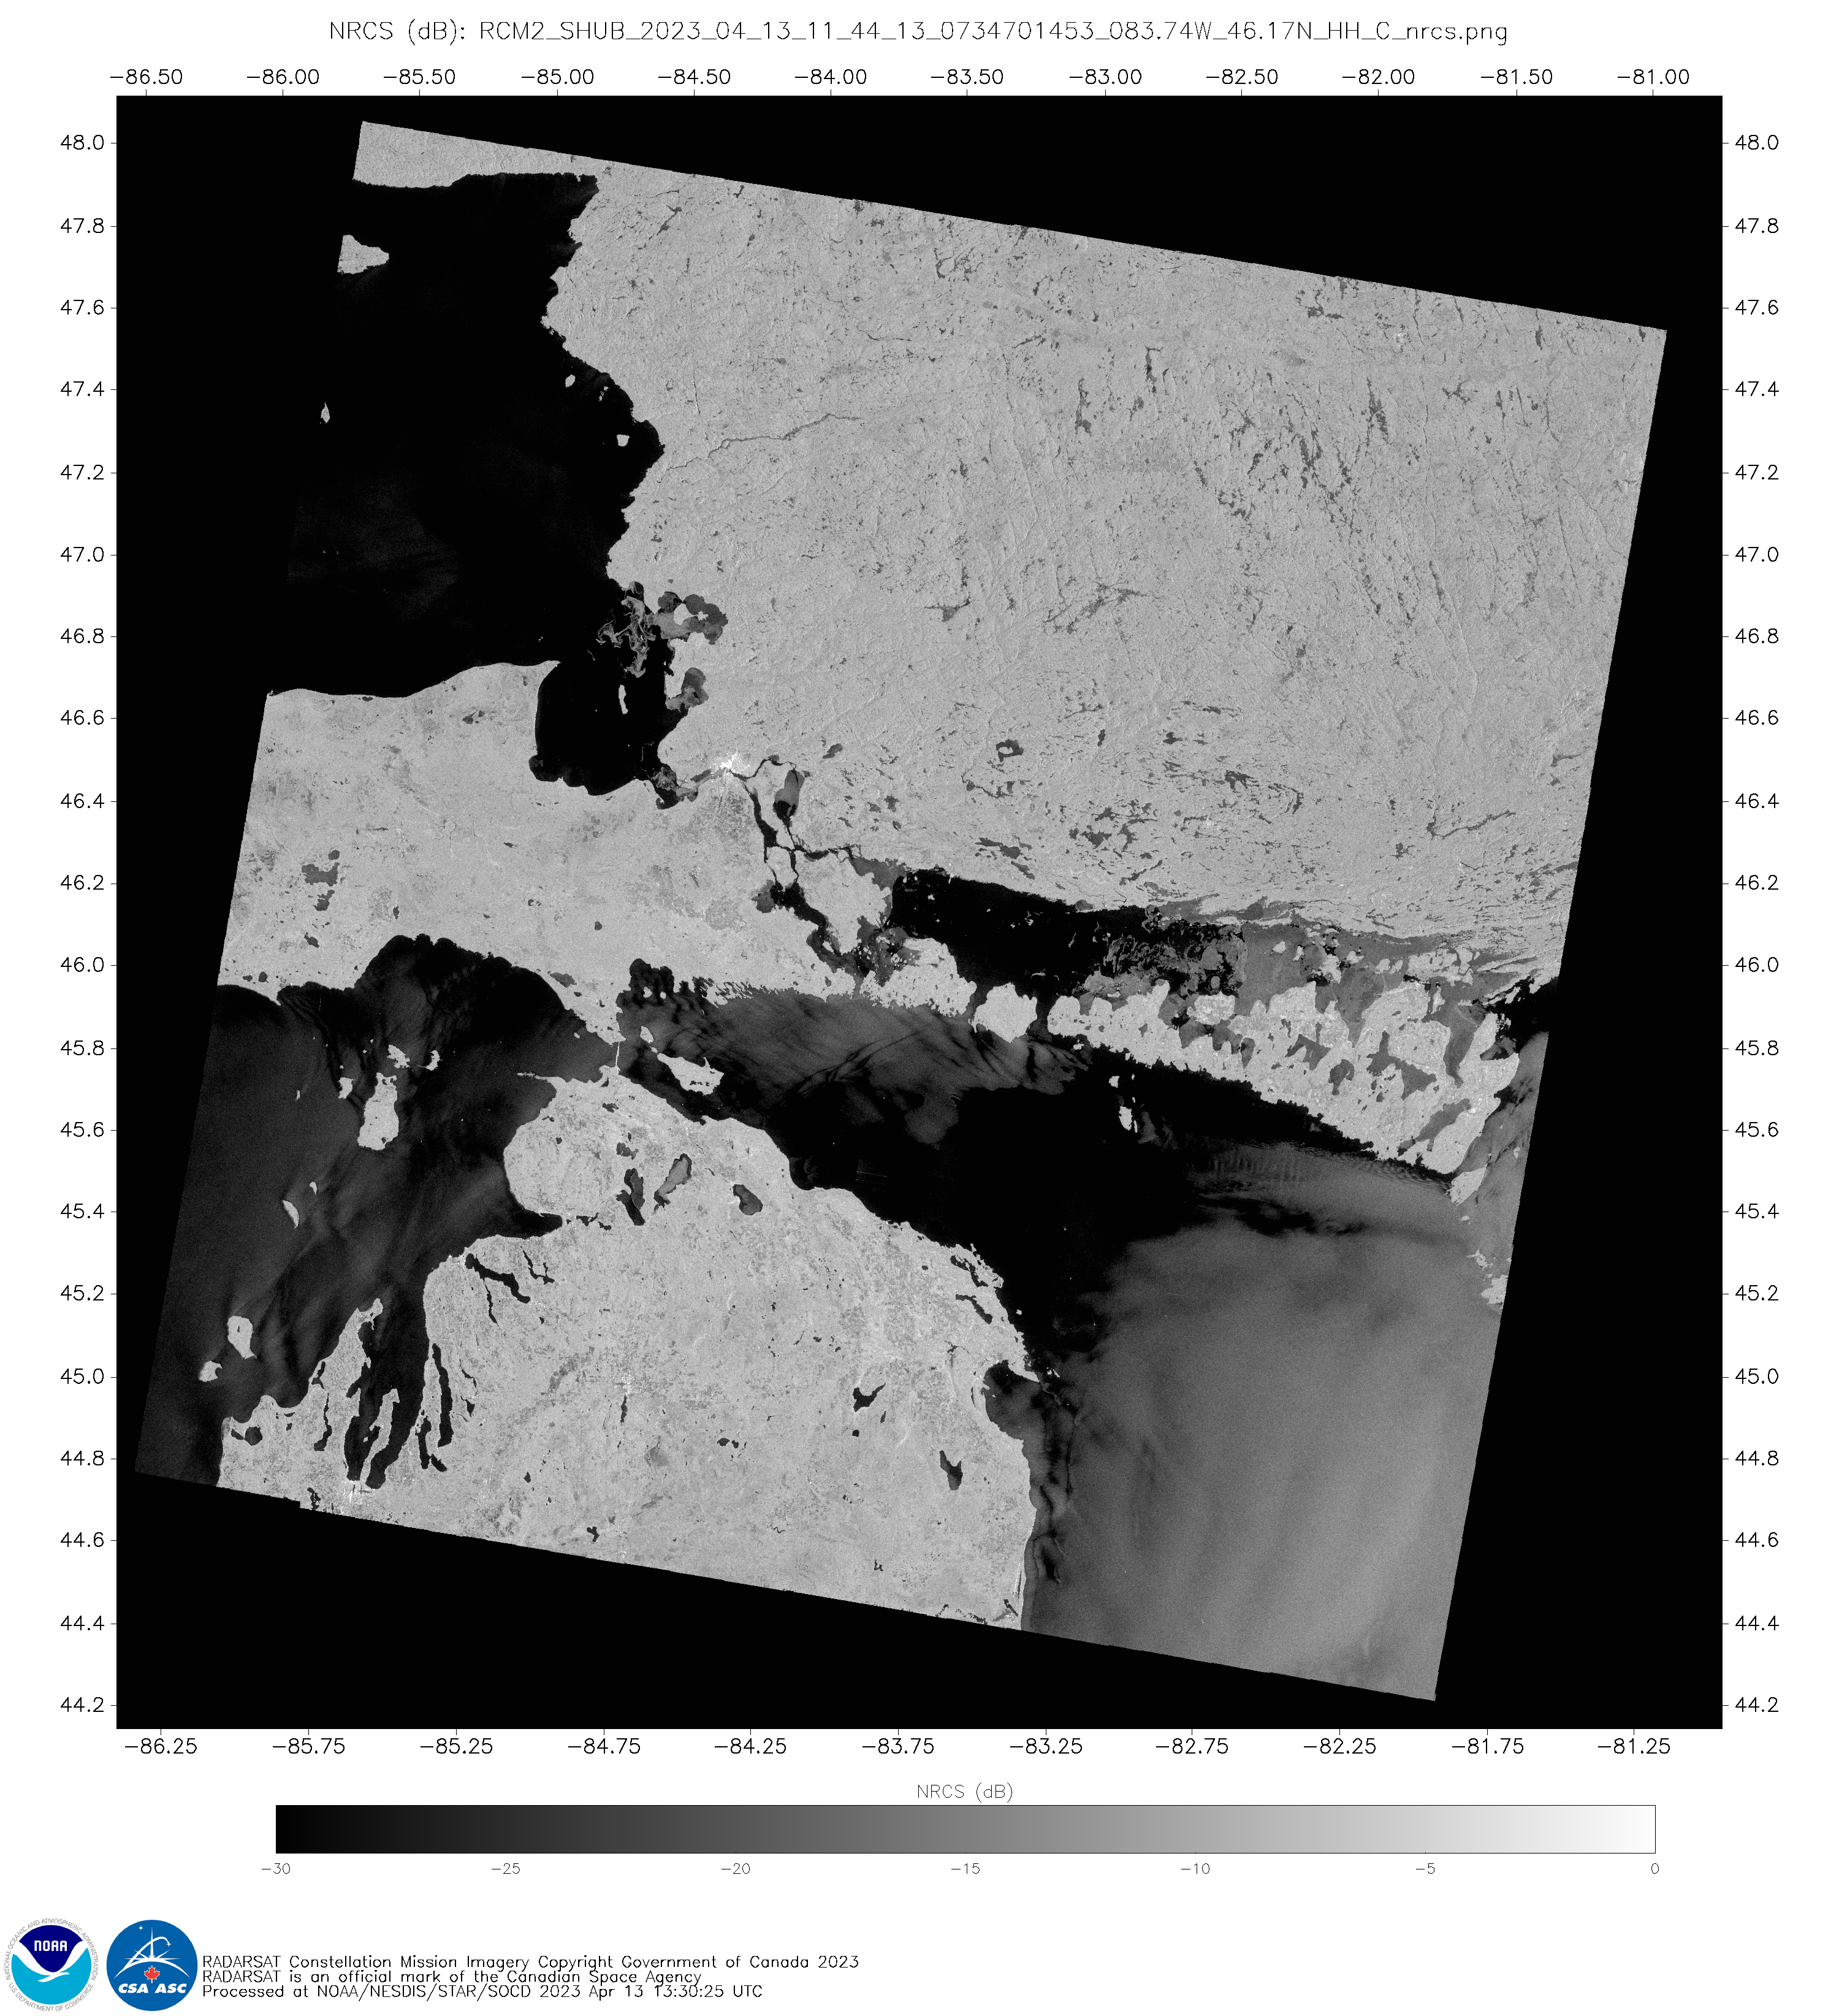
A RCM-3 SAR image at 1030 UTC (
source) is shown below; the peak SAR-derived radial velocity was
144.36 knots within the northeast quadrant of Ilsa.
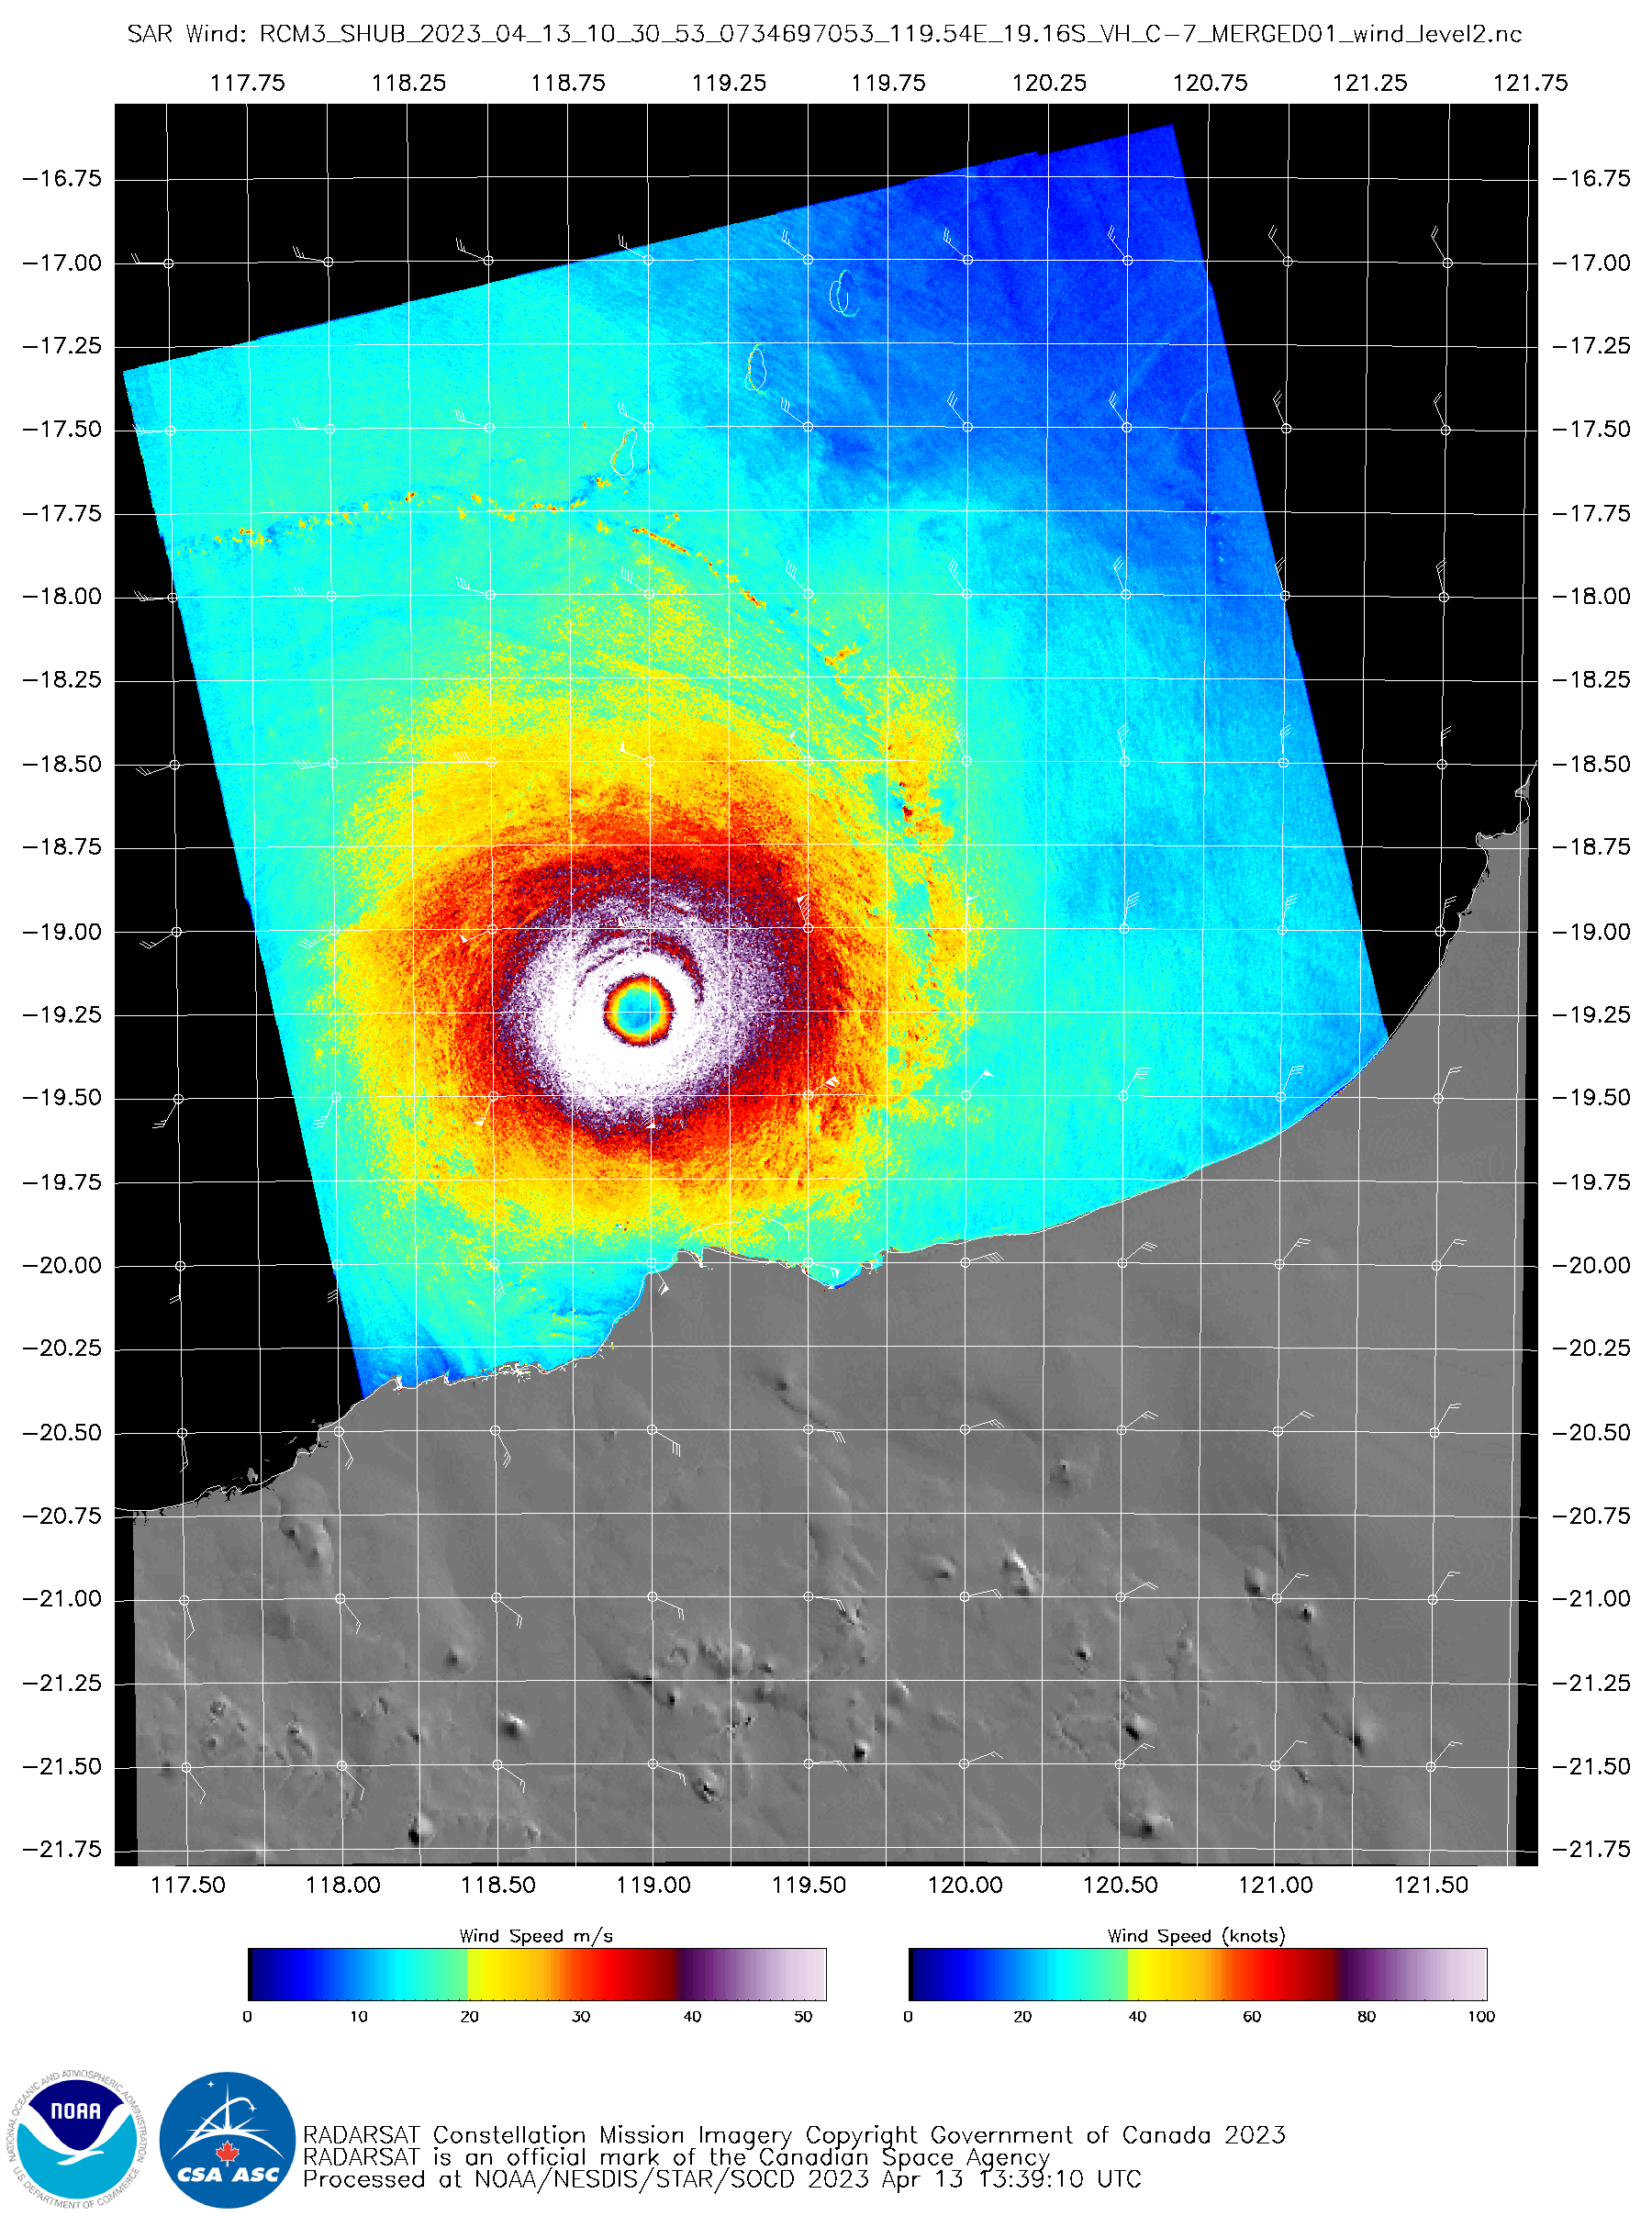
RCM-3 SAR image at 1030 UTC [click to enlarge]
Himawari-9 Infrared (11.2 µm) images
(below) included an overlay of
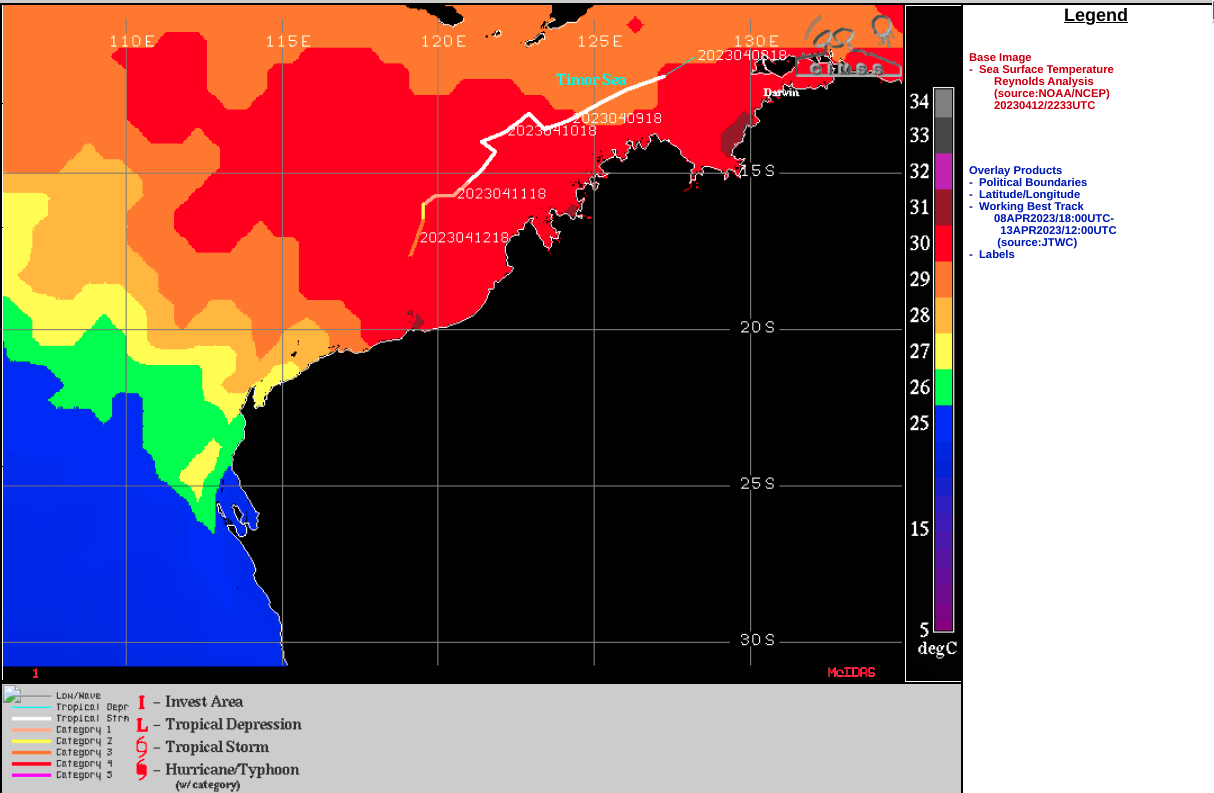
deep-layer wind shear at 1200 UTC — which showed that Ilsa was moving through an environment of low shear (as it traversed warm
Sea Suface Temperatures).
JMA Himawari-9 Infrared (11.2 µm) images, with an overlay of deep-layer wind shear at 1200 UTC [click to enlarge]
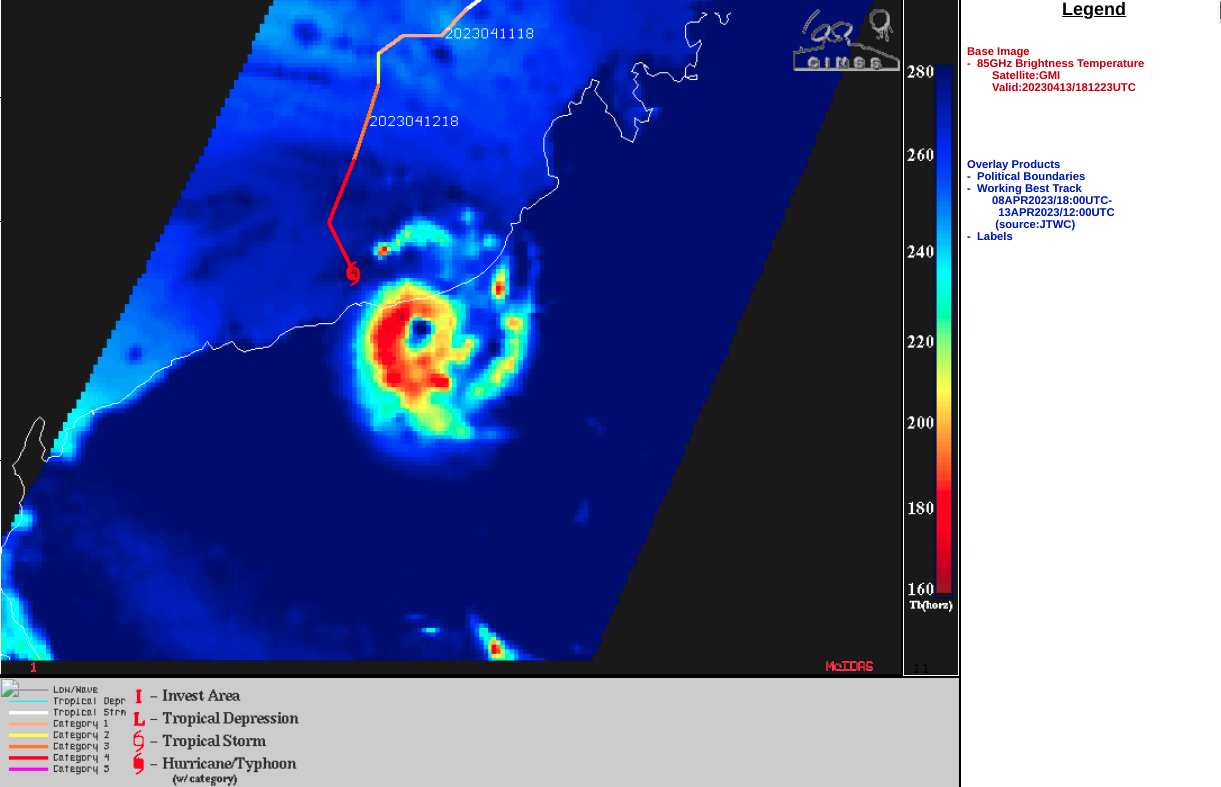
GMI Microwave (85 GHZ) image at 1821 UTC [click to enlarge]
A GMI Microwave image at 1821 UTC
(above) and a DMSP-18 SSMIS Microwave image at 2006 UTC
(below) revealed that Ilsa’s closed eyewall remained intact for several hours after the storm had moved inland, while maintaining Category 4 intensity (as of 1800 UTC).
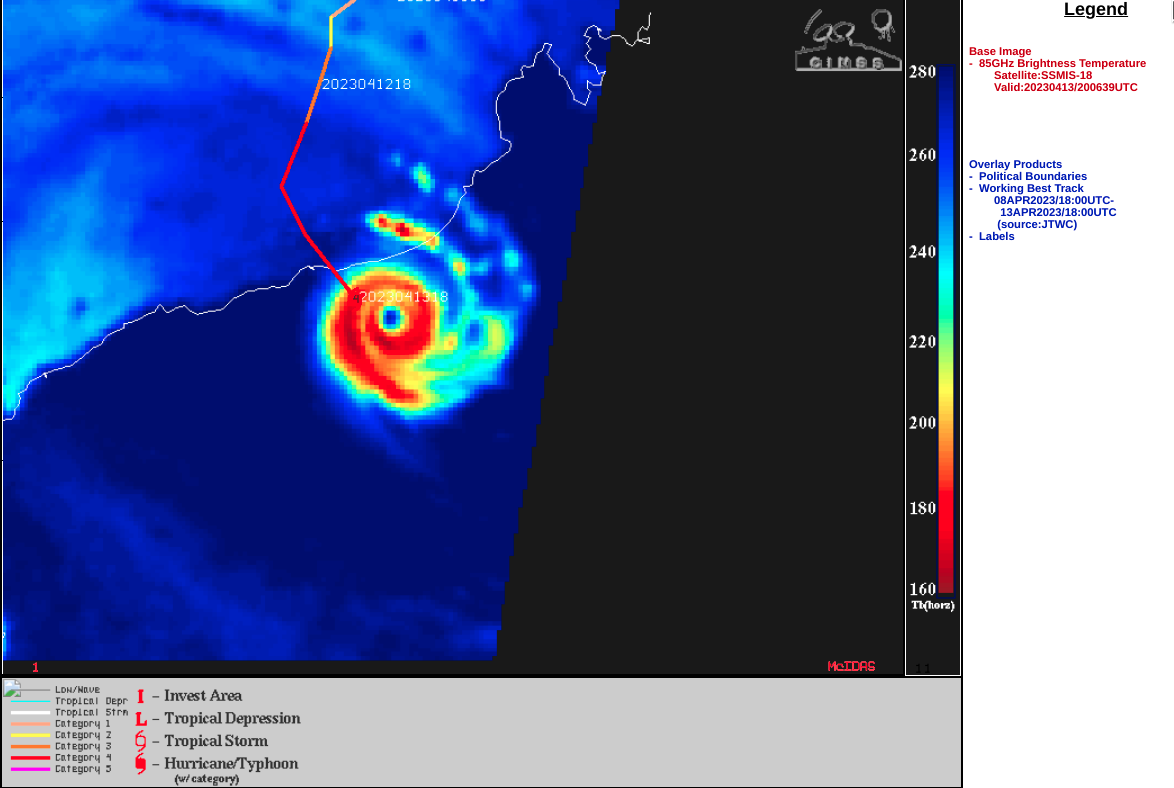
DMSP-18 SSMIS Microwave (85 GHz) image at 2006 UTC [click to enlarge]
View only this post
Read Less


