
Cincinnati’s 25th running of the Flying Pig Marathon commenced on the morning of Sunday, May 7th, despite deteriorating weather conditions. After a round of storms at about 09:30 UTC, which subsequently passed through, race officials began the marathon as scheduled at 10:30 UTC. Figure 1 shows the composite reflectivity and LightningCast contours 0-30 minutes prior to the start time. The point marked “H” in the center of the animations below is the Cincinnati Municipal Airport — Lunken Field, which is about 3 miles east of downtown Cincinnati, where the marathon took place. In Figure 1, we see some storm cells intensifying and heading east toward downtown Cincinnati. The LightingCast probability of lighting in the next hour was > 50% at 10:30 UTC, when the race began.
ProbSevere LightningCast uses artificial intelligence and GOES-R ABI data to predict the probability of lightning in the next 60 minutes, as observed by the GOES-R Geostationary Lightning Mapper (GLM). Figures 2 and 3 show animations of LightningCast probabilities with GOES-16 10.3 µm brightness temperature and GLM flash-extent density (Figure 3). As the convection approaches downtown Cincinnati, we see cooling cloud tops and intensifying lightning flash rates. Furthermore, in Figure 3, we see a number of anvil flashes “overhead” of point H (i.e., within the GLM pixel containing point H) just prior to the start of the race. With thick ice from the anvil of the departing round of storms and the anvil of the approaching line of storms, LightningCast probabilities remained high despite no flash centroids within 10 miles of downtown Cincinnati during the inter-storm period (~10:15 to 11:00 UTC).
Using the LightningCast time series capability at Cincinnati Municipal Airport — Lunken Field (Figure 4), we see that the probability of lightning remained elevated (40-60%) in the inter-storm period, then jumped up to 71% by 10:36 UTC. The probability steadily increased to 96% at 10:51 UTC, 28 minutes before a shelter-in-place order was issued to runners. The “order” was more of a recommendation, according to race officials, as many runners were either confused by it or ignored it. The race began at 10:30 UTC, which was 15 minutes after the last flashes (within 10 miles) from the first round of storms.
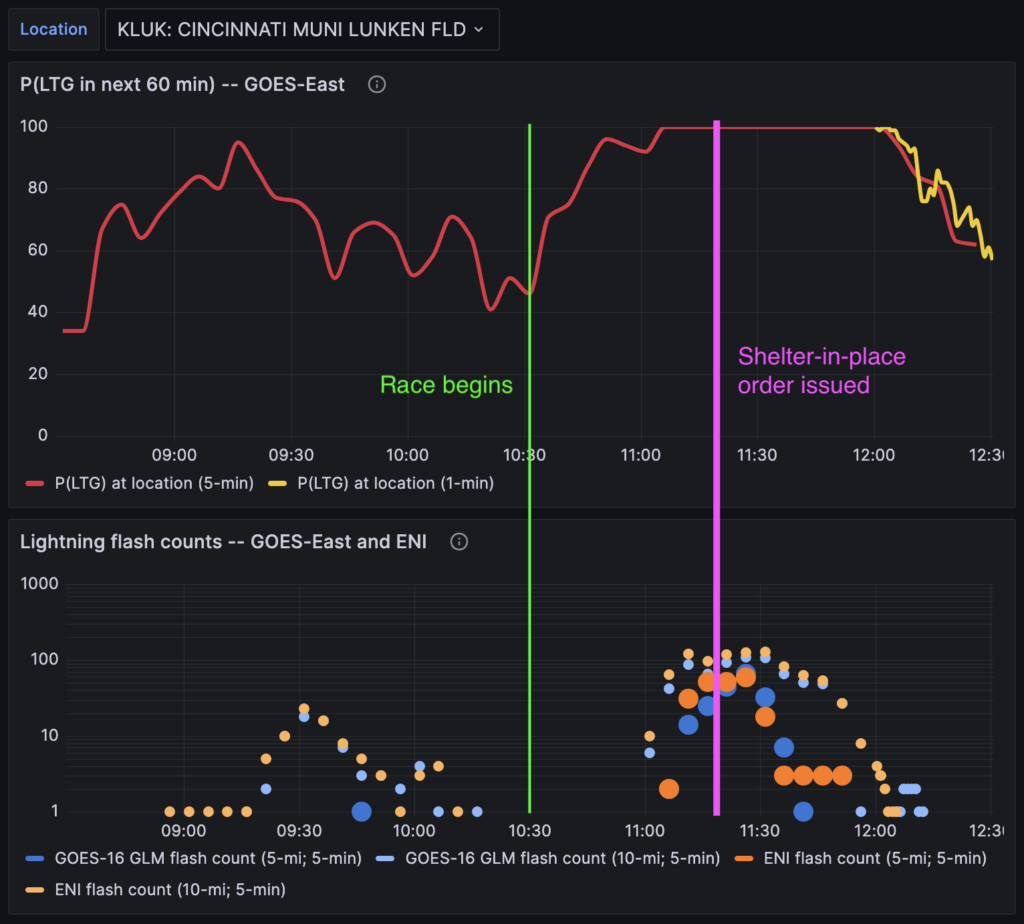
Fortunately, there were no reported lightning-related injuries to racers or spectators, despite dozens of observed flashes every 5 minutes, within 5 miles of downtown Cincinnati. We aim to make LightningCast usable by forecasters and event managers to help make informed decisions such as postponements and sheltering at events with high vulnerability to lightning.
h/t to Kevin Thiel for providing information for this event.
View only this post Read Less

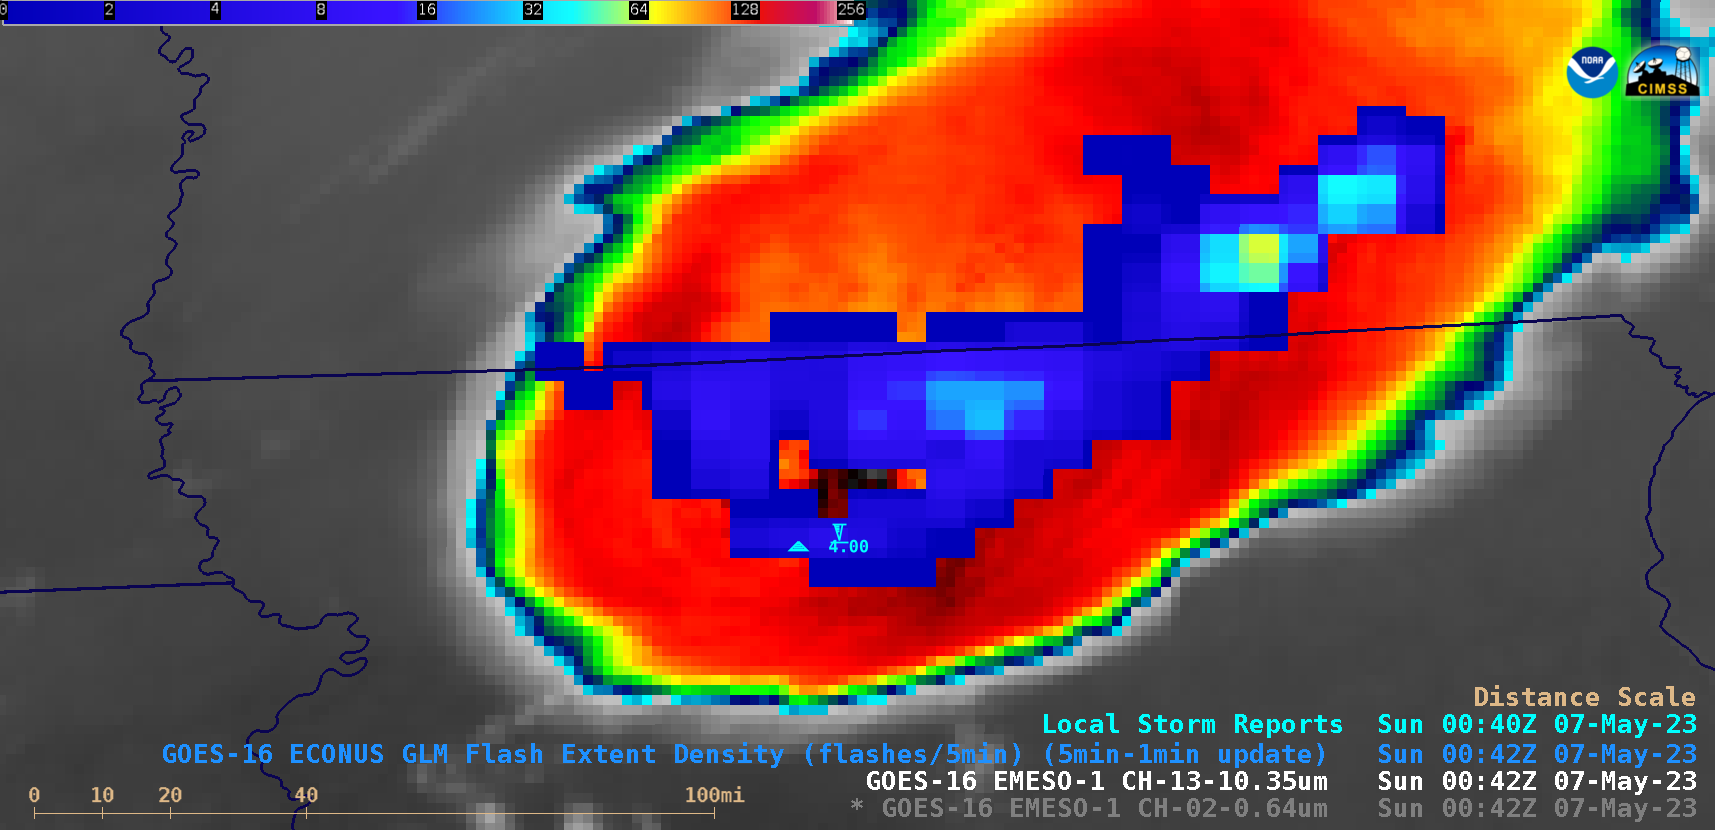
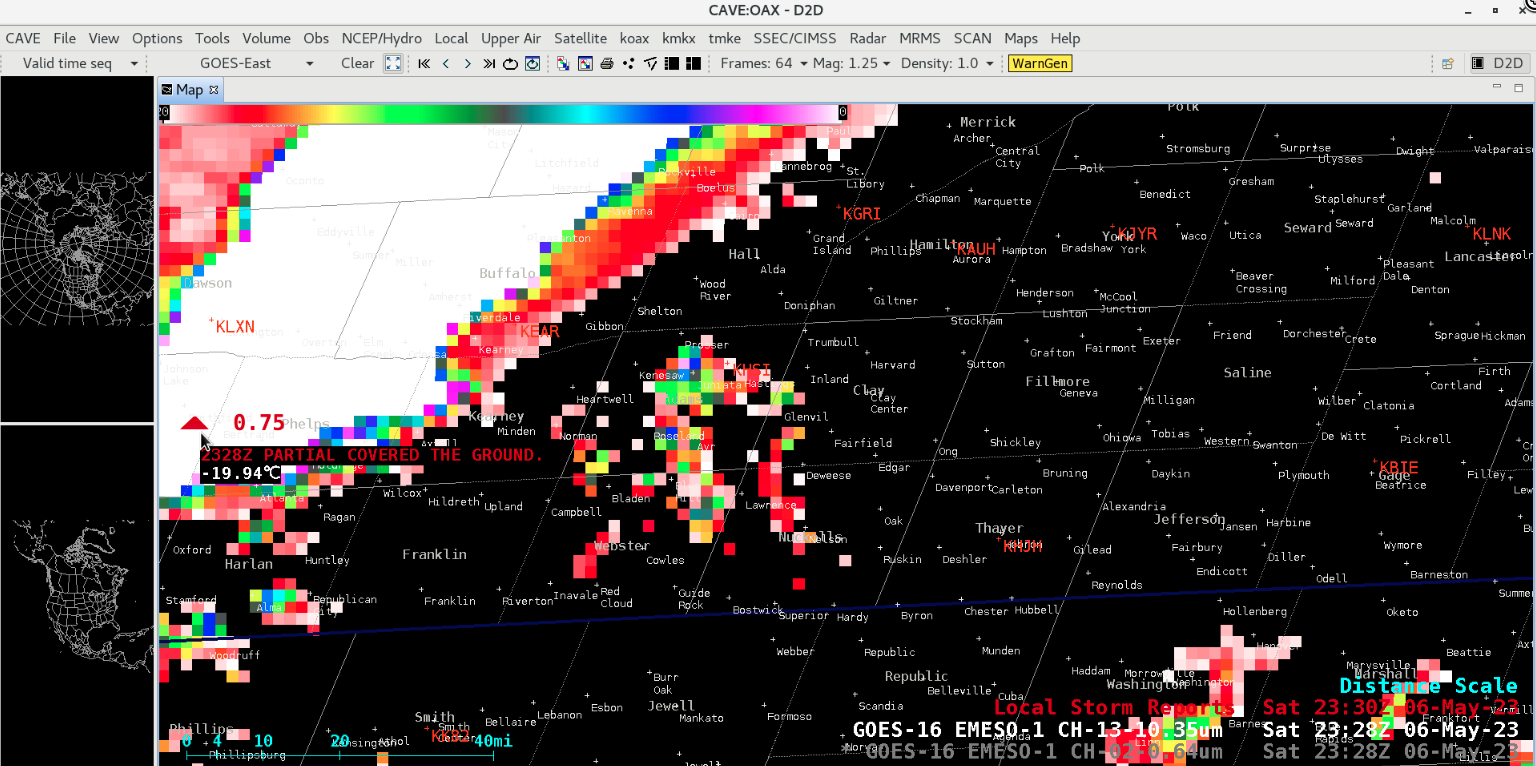
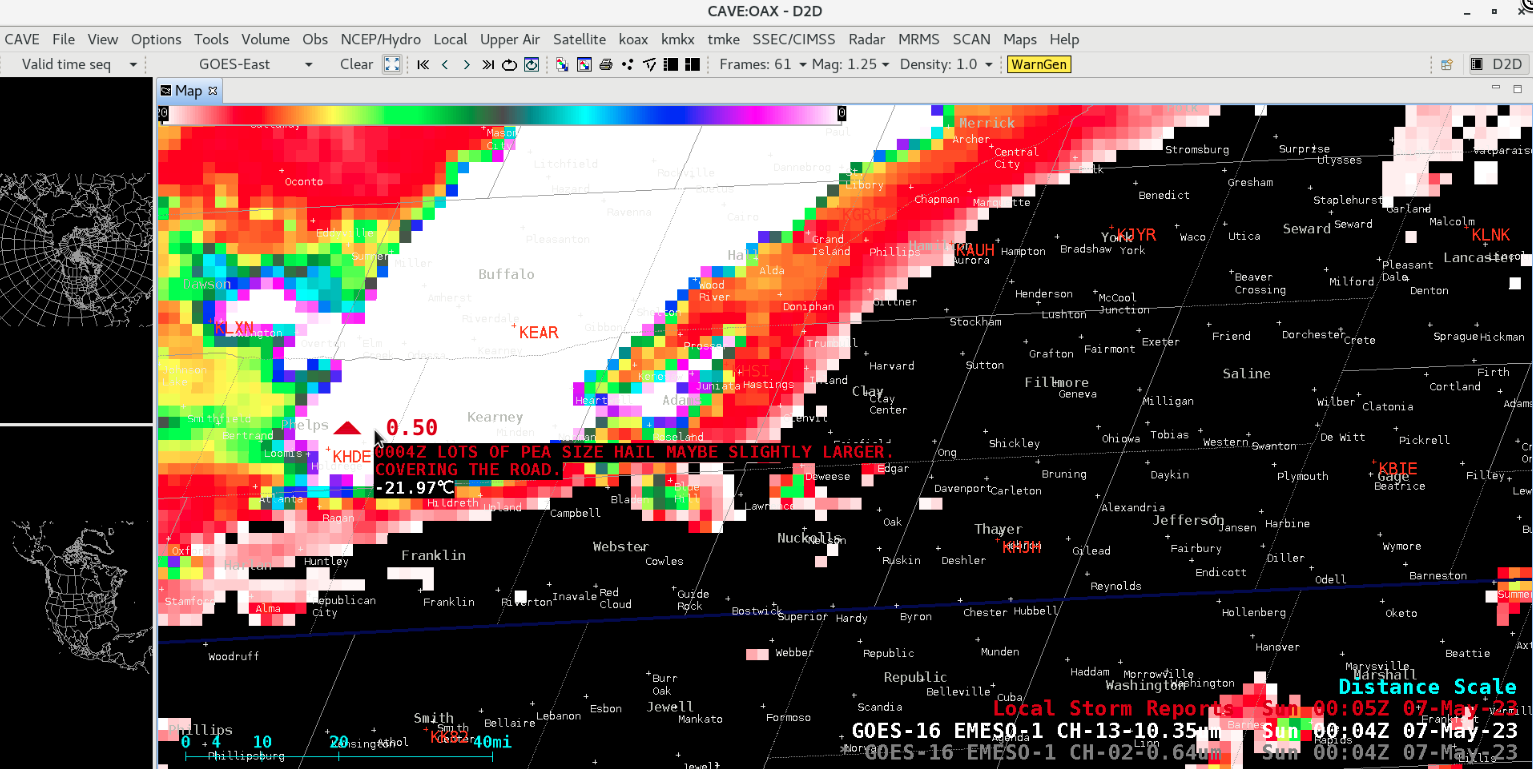
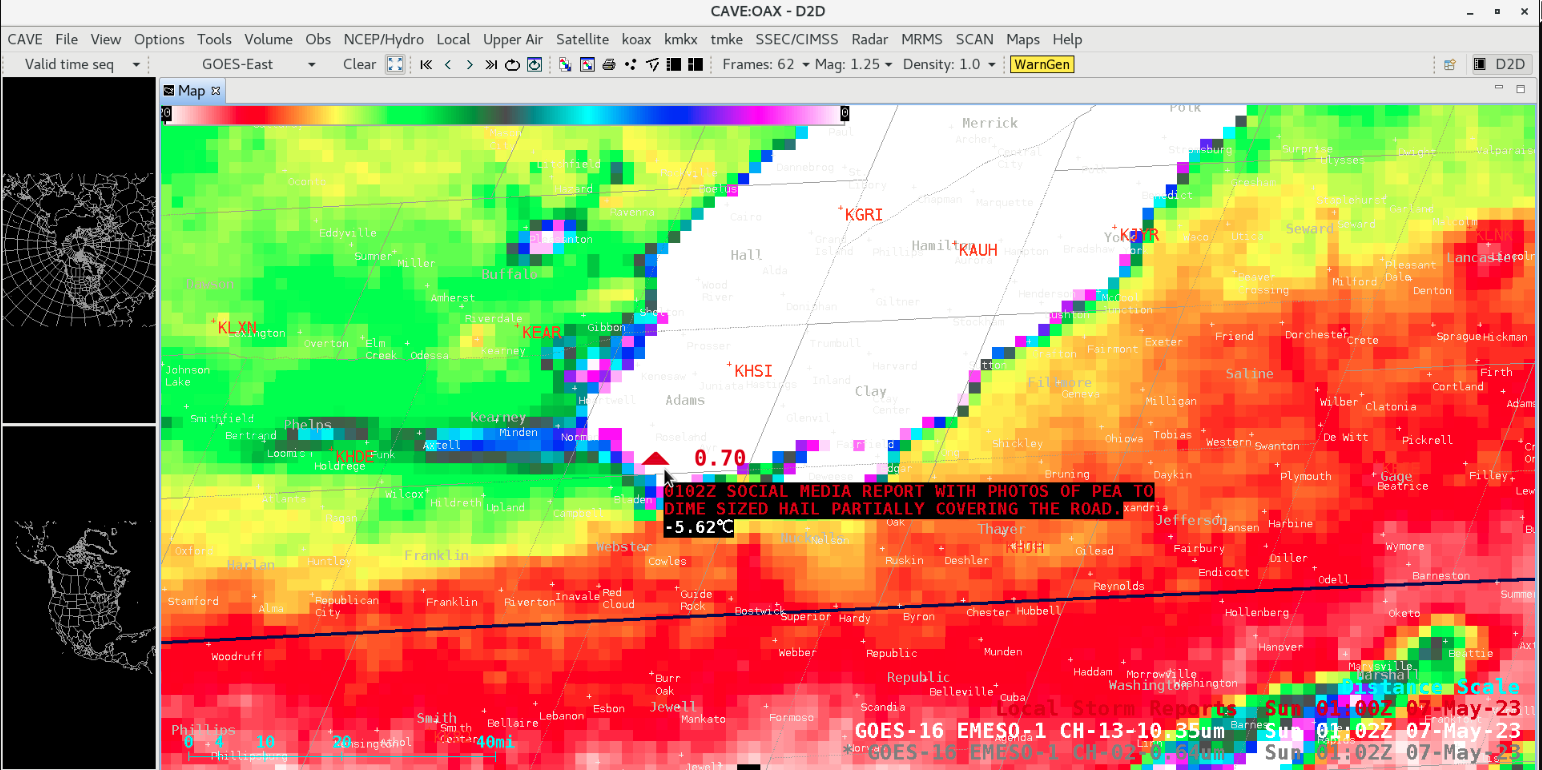
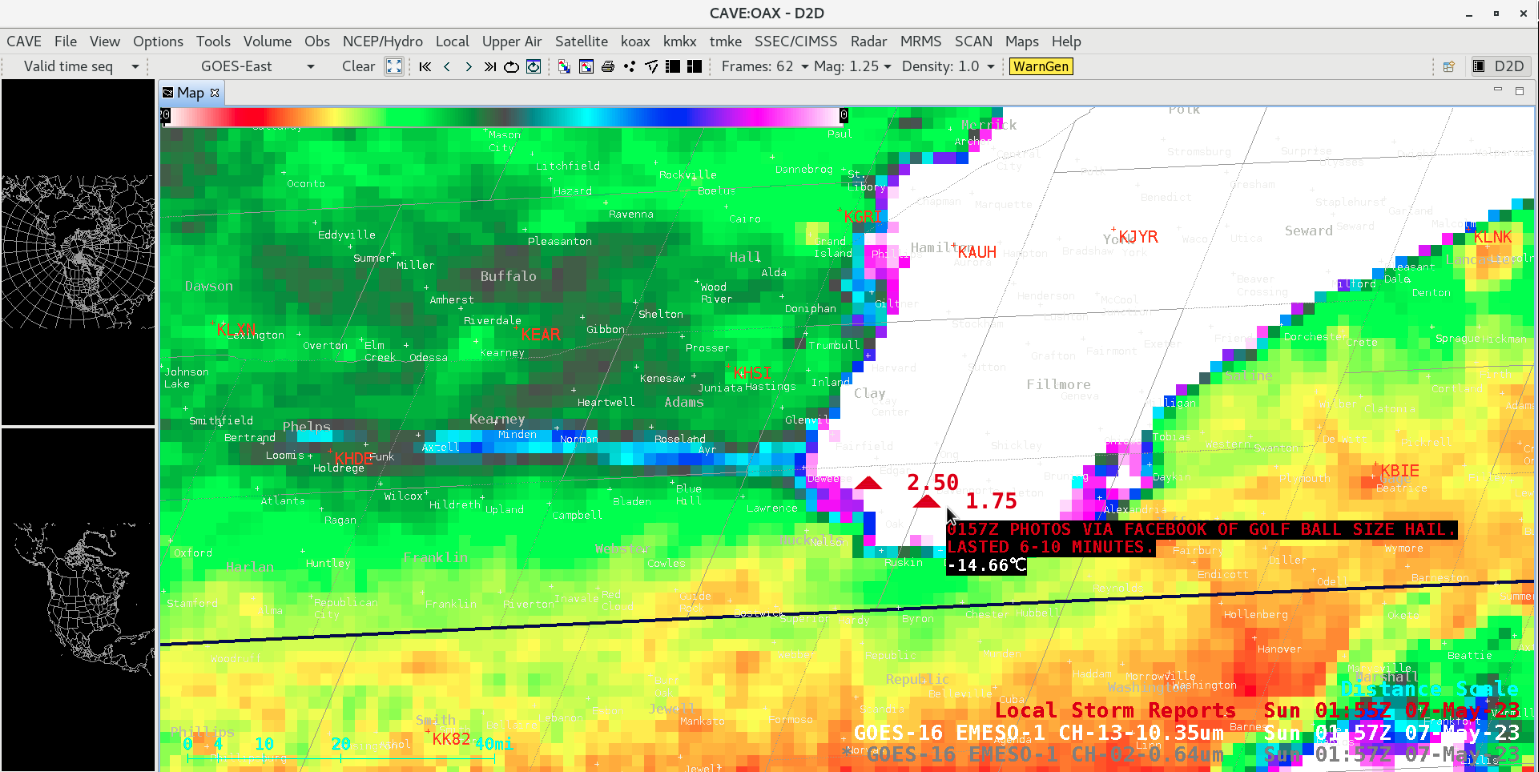
![GOES-16 “Red” Visible (0.64 µm) and “Clean” Infrared Window (10.3 µm) images [click to play animated GIF | MP4]](https://cimss.ssec.wisc.edu/satellite-blog/images/2023/05/230506_goes16_visible_infrared_localStormReports_MO_anim.gif)


