McIDAS images of POES AVHRR 10.8 µm IR channel data (above) showed the development of a large terrain-induced “banner cloud” over the eastern part of the Brooks Range in northeastern Alaska on 01 January – 02 January 2010. The IR cloud top brightness temperature values were as cold as -65º... Read More
")
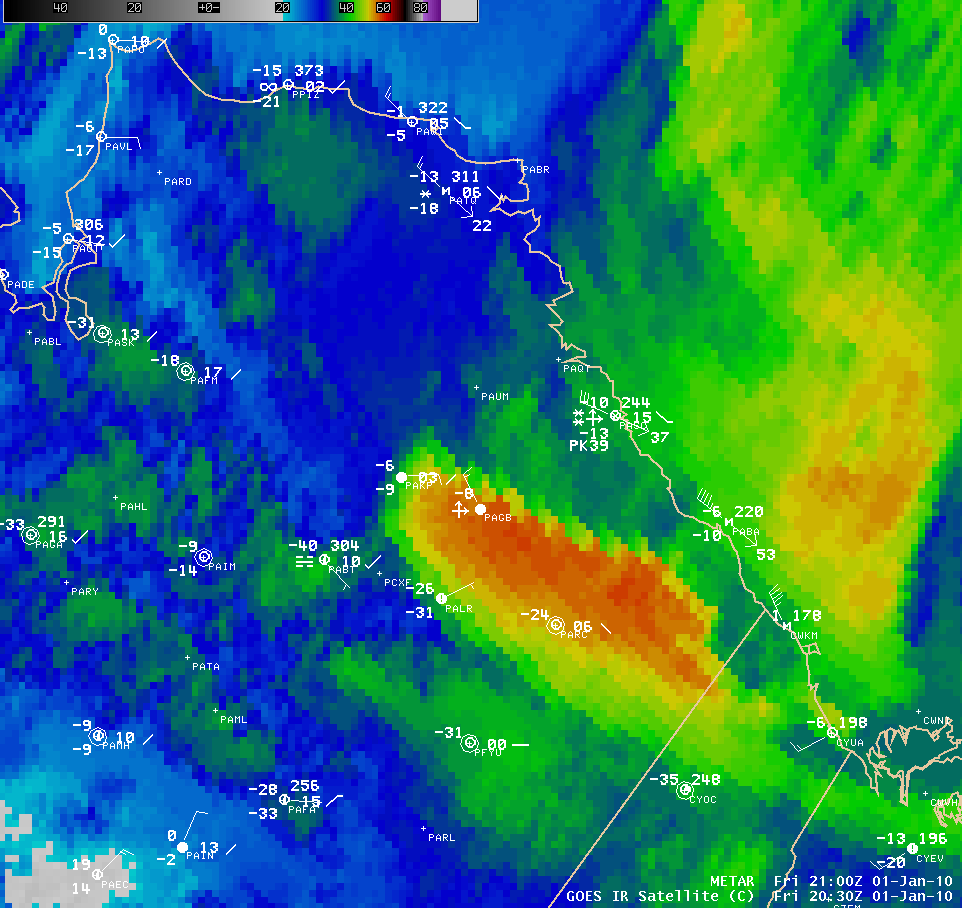
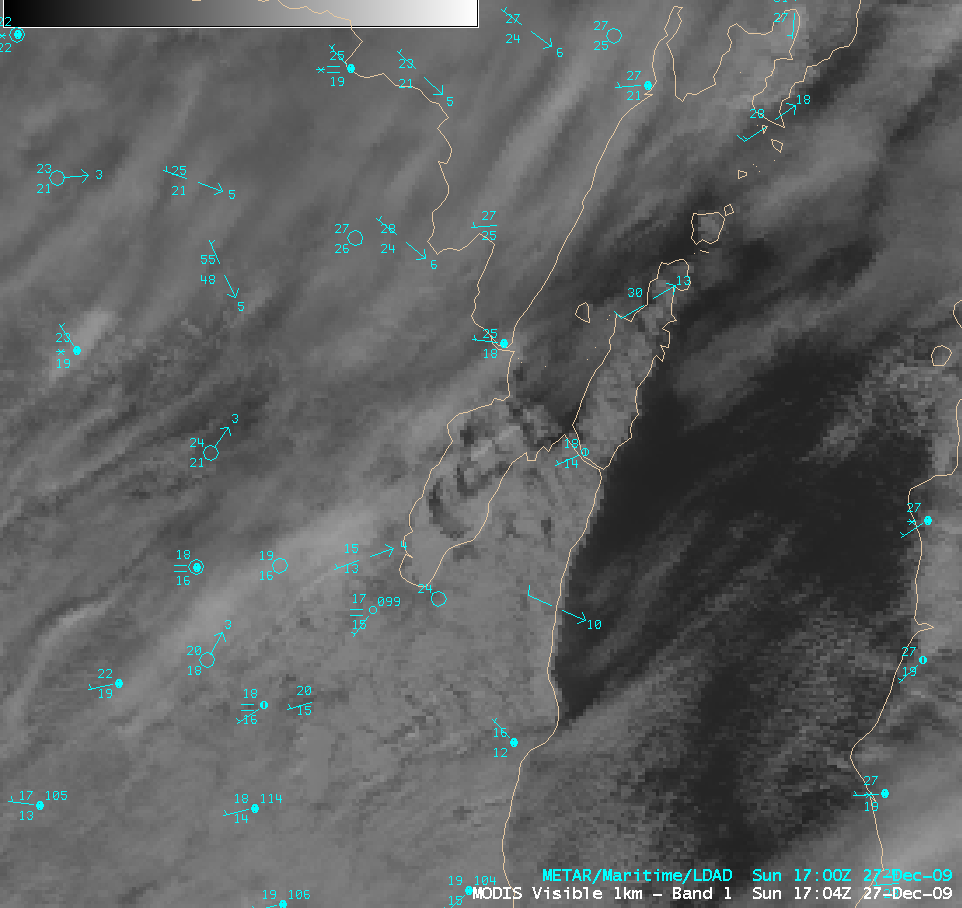
POES AVHRR 10.8 µm IR images + surface temperatures (F)
McIDAS images of POES AVHRR 10.8 µm IR channel data (above) showed the development of a large terrain-induced “banner cloud” over the eastern part of the Brooks Range in northeastern Alaska on 01 January – 02 January 2010. The IR cloud top brightness temperature values were as cold as -65º C (darker red color enhancement) around 20:26 UTC, which suggested very high cloud tops (GOES-11 10.7 µm IR cloud top brightness temperatures were as cold as -58º C at that time). The terrain of the Brooks Range was acting as an obstacle to the northerly flow aloft (ECMWF 700 hPa winds | 500 hPa winds), which helped to initiate the formation of the banner cloud.
This cloud feature was also apparently thick enough to have a dramatic influence on surface temperatures — note that the temperature at Arctic Village (station identifier PARC) rose from -35º F before the cloud feature developed to +1º F after the cloud feature had been overhead for several hours. A surface meteorogram plot indicated that this temperature rise occurred during a period of light winds, so warm air advection could not account for the warming; instead, the thick cloud deck acted as a blanket to stop radiational cooling over that particular site.
CIMSS has been evaluating and testing a variety of CLAVR-x AVHRR cloud products in AWIPS, which can be used to further characterize this banner cloud that formed over the Brooks Range. The Cloud Type product (below) classified the feature as a combination of Cirrus, Multi-level Cirrus, and Opaque Ice Cloud categories (yellow, orange, and red color enhancements), which is not surprising given the very cold appearance on IR imagery.

AVHRR Cloud Type product
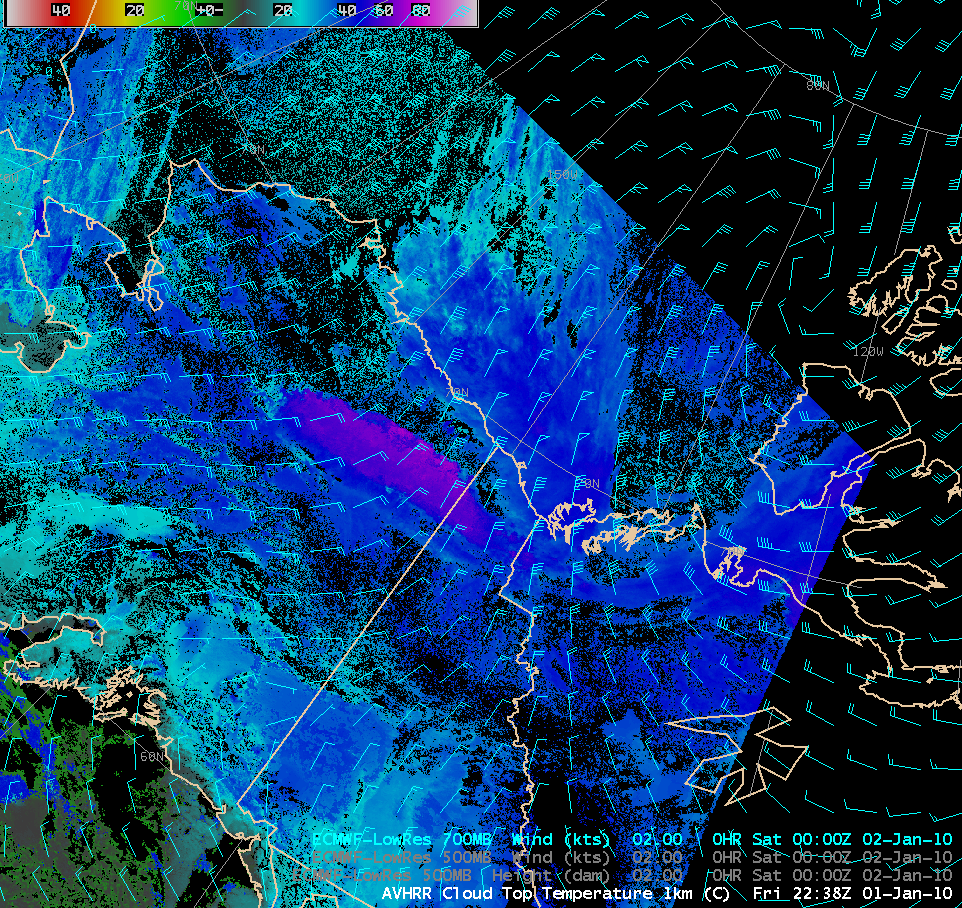
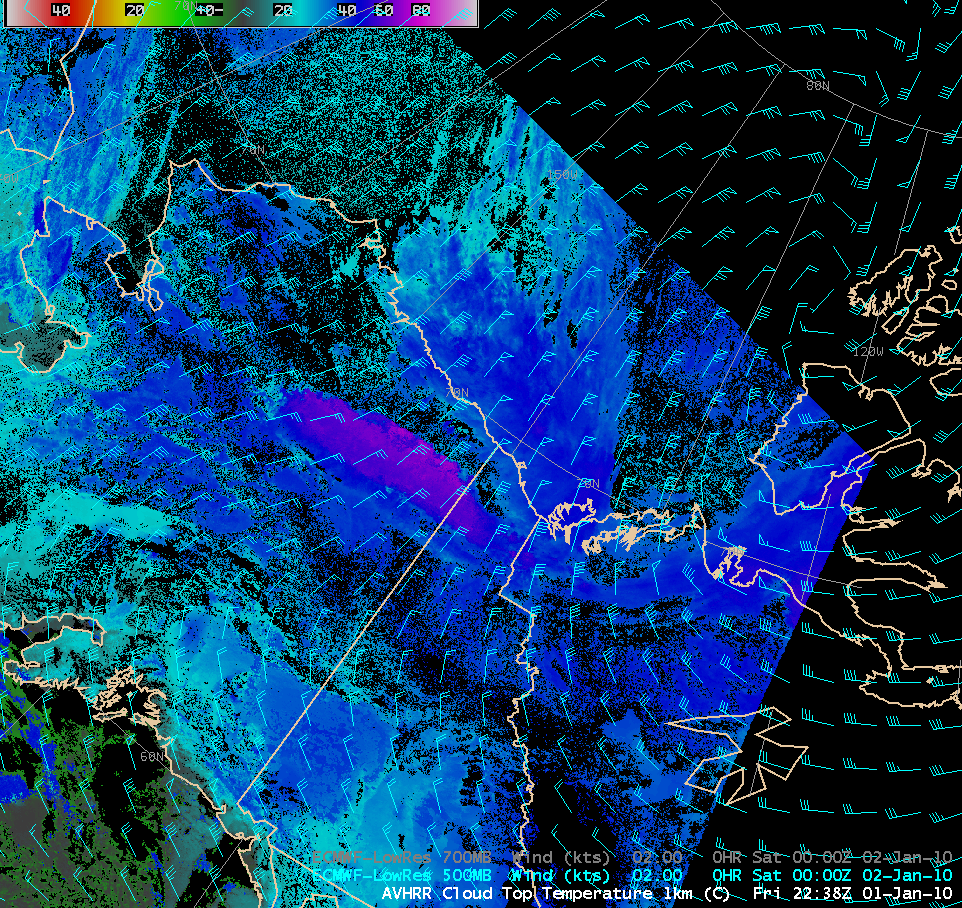
The AVHRR Cloud Top Temperature (CTT) product (below) showed that the tops of the cirrus feature were even colder than what was indicated by the IR imagery, with CTT values as low as -76º C at 20:20 UTC.

AVHRR Cloud Top Temperature product
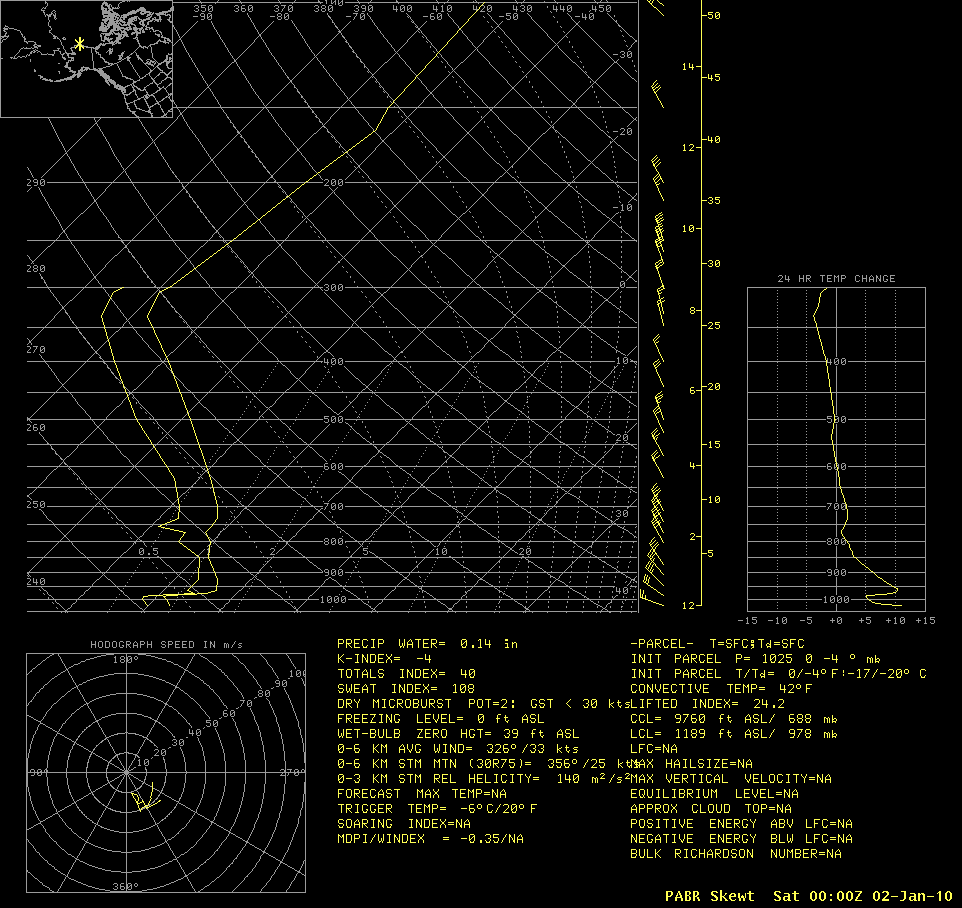
The AVHRR Cloud Top Height product (below) showed that the tops of the banner cloud feature were generally around 8 km (cyan color enhancement). This height was close to the altitude of the tropopause, as indicated on the Barrow AK rawinsonde data.

AVHRR Cloud Top Height product
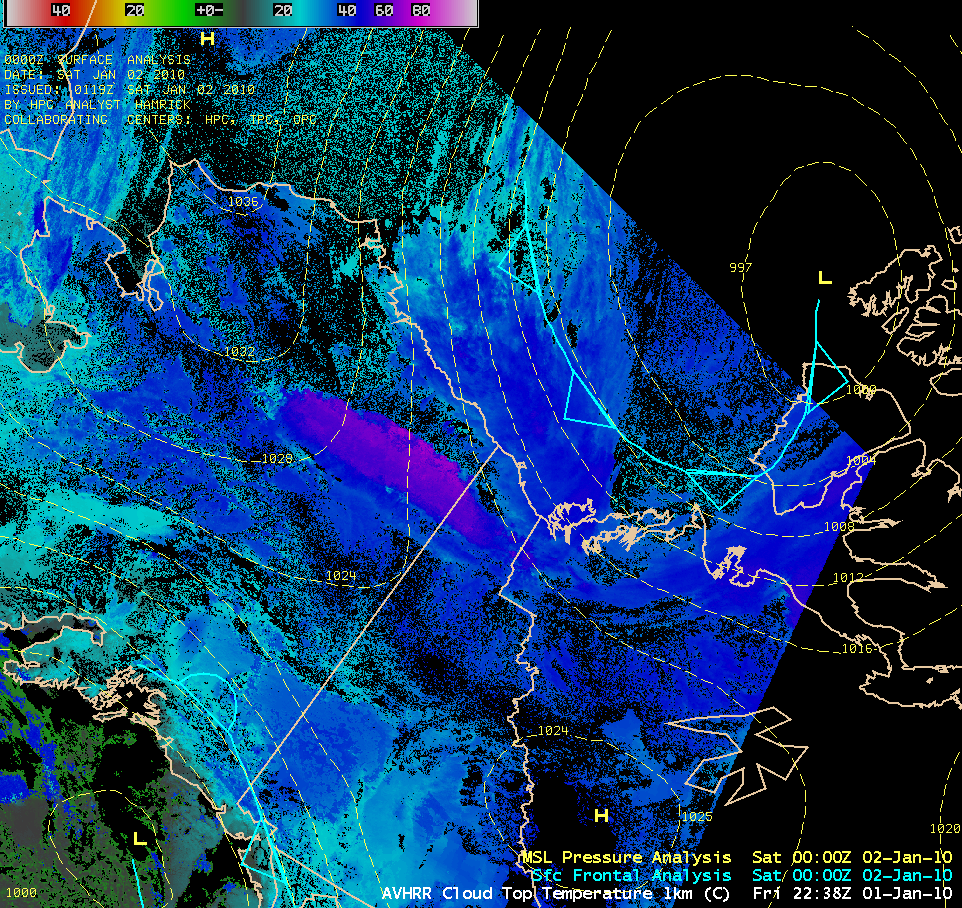
As an aside, the eastern Arctic Slope region of Alaska was experiencing blizzard conditions during this period — at Barter Island (station identifier PABA) along the coast, winds gusted as high as 72 mph. The strong westerly winds were in response to a tightening pressure gradient in advance of an approaching cold front (surface pressure and frontal analysis).
View only this post
Read Less

")


")


