Standing waves to the lee of the Hawaiian Islands

GOES-17 Low-level (7.3 µm), Mid-level (6.9 µm) and Upper-level (6.2 µm) Water Vapor images, with pilot reports of turbulence plotted in cyan [click to play animation | MP4]
As a compact but anomalously-deep middle/upper-tropospheric low approached Hawai’i on 29 November 2021, GOES-17 (GOES-West) Low-level (7.3 µm), Mid-level (6.9 µm) and Upper-level (6.2 µm) Water Vapor images (above) showed complex lee wave structures southwest of the island chain. There were a few pilot reports of moderate turbulence in the general vicinity of these waves.
Even though 250 hPa wind speeds along the western side of the upper-level low were relatively light (30-60 knots), those north-northeasterly upper-tropospheric wind speeds were higher than normal for Hawai’i during the end of November. A Turbulence Probability product (below) indicated that the risk for Moderate or Greater (MOG) turbulence was generally low (less than 50%), and focused along the dry slot near the axis of the 250 hPa jet streak. Note that the Turbulence Probability began to decrease later in the period, as those 250 hPa jet streak winds began to relax over the area.
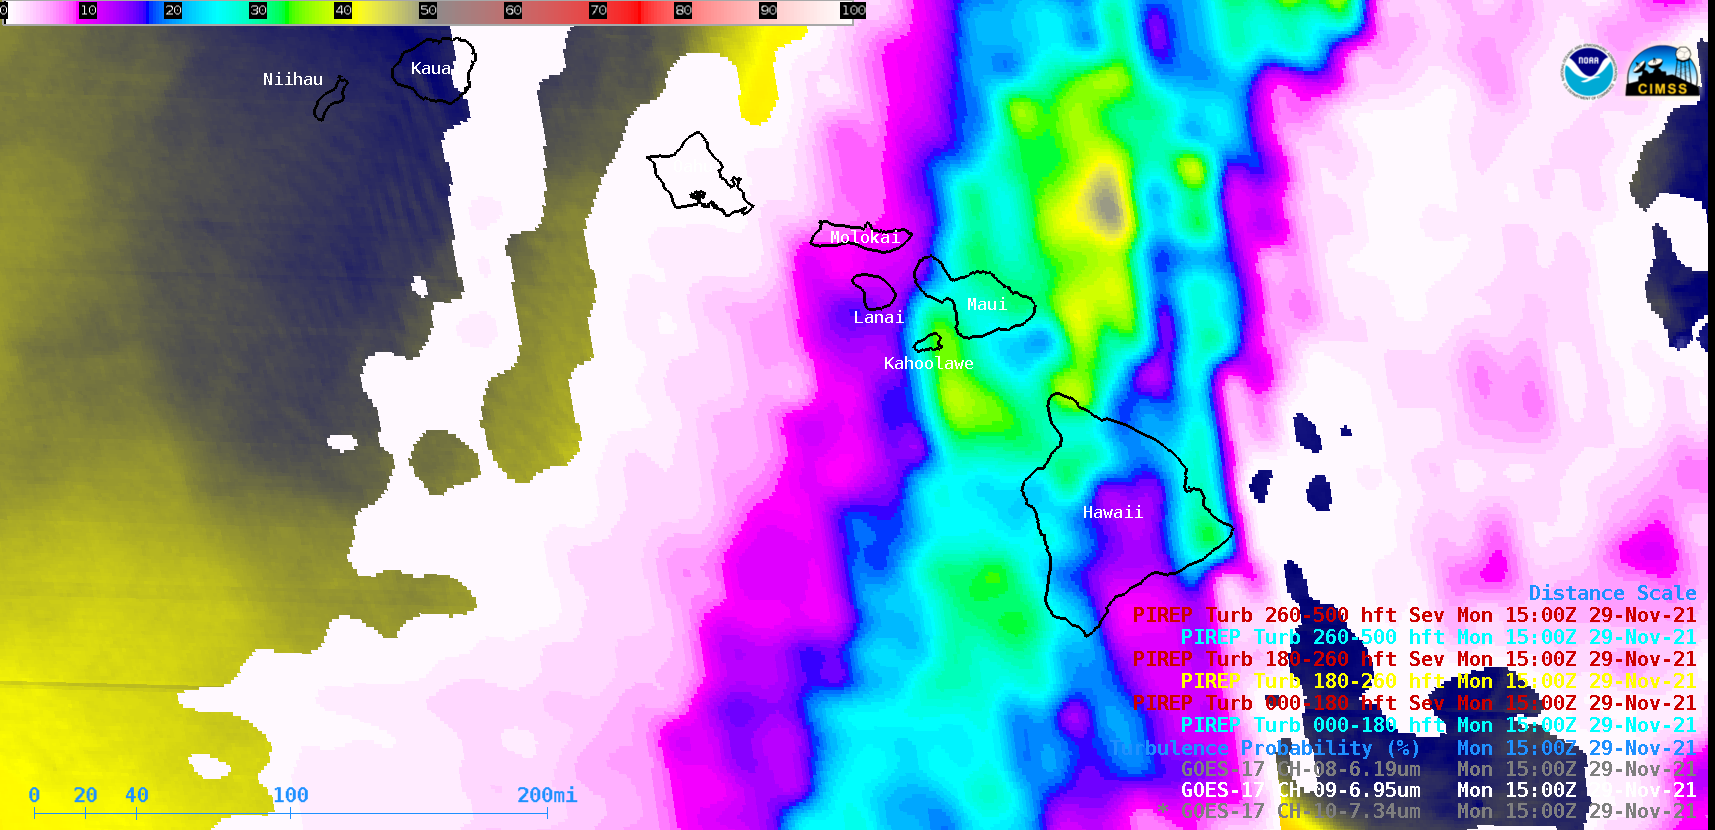
GOES-17 Mid-level (6.9 µm) Water Vapor images, with an overlay of Turbulence Probability after 1300 UTC [click to play animated GIF | MP4]
Training for this Turbulence Probability product is available here and here.