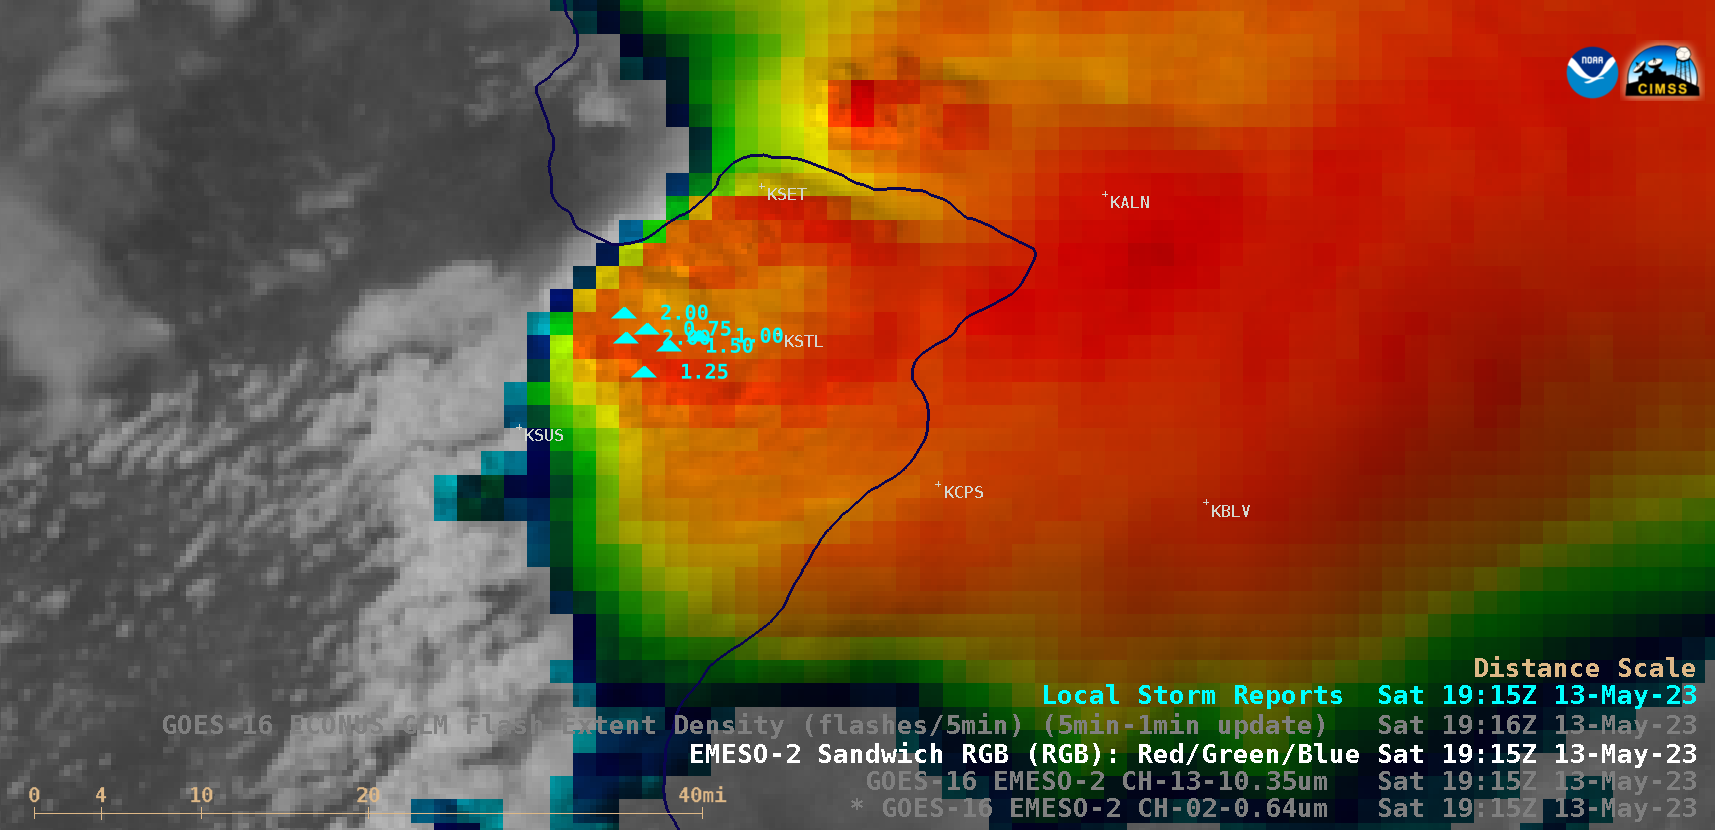

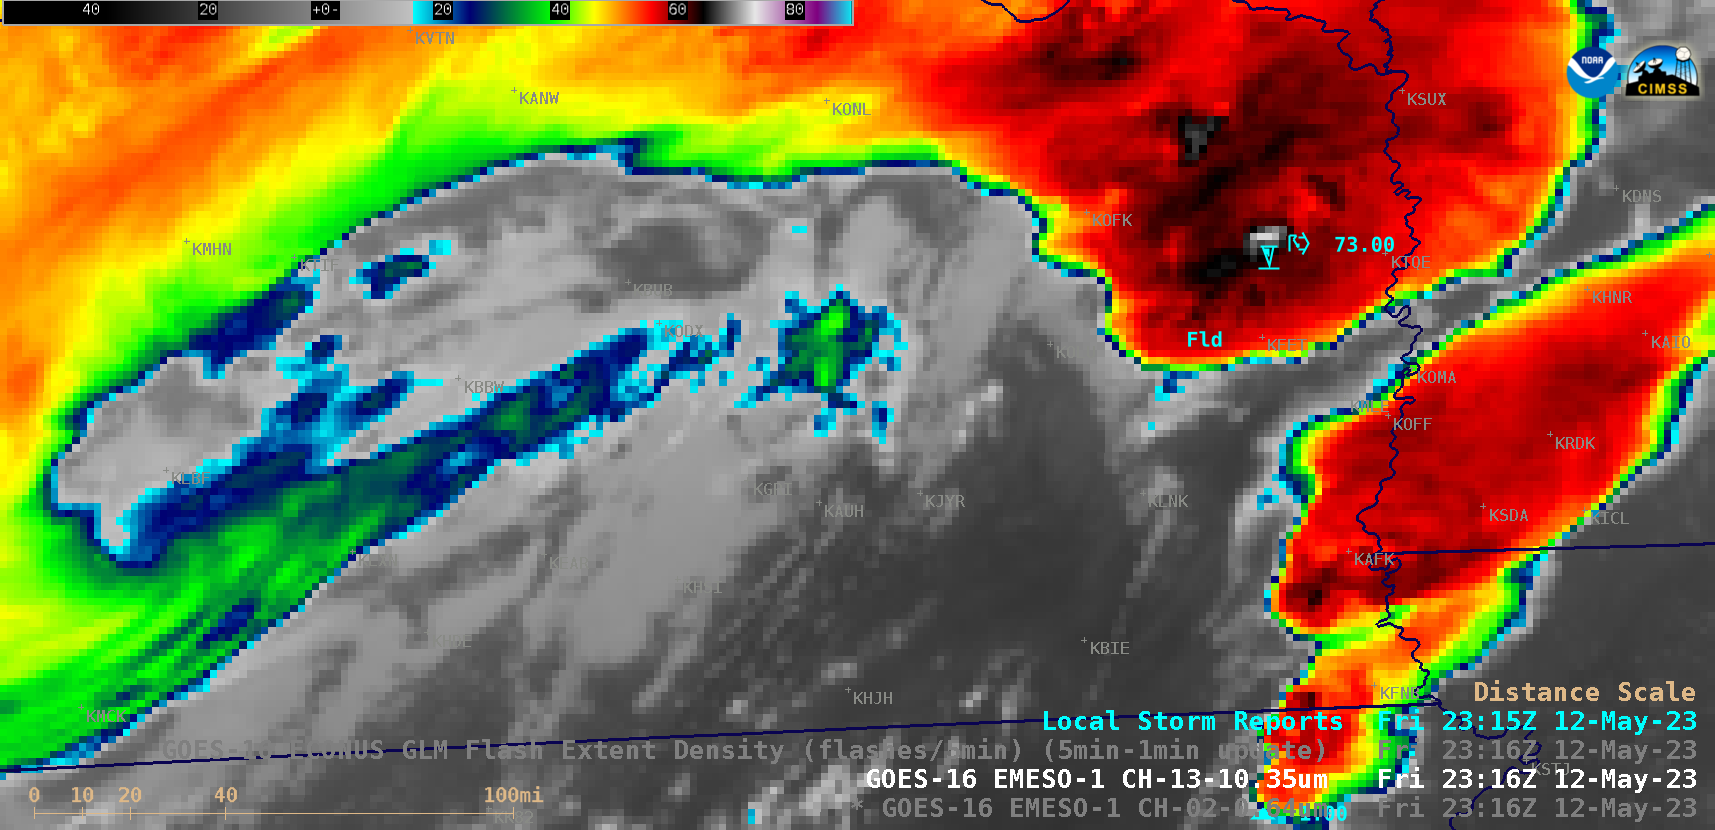
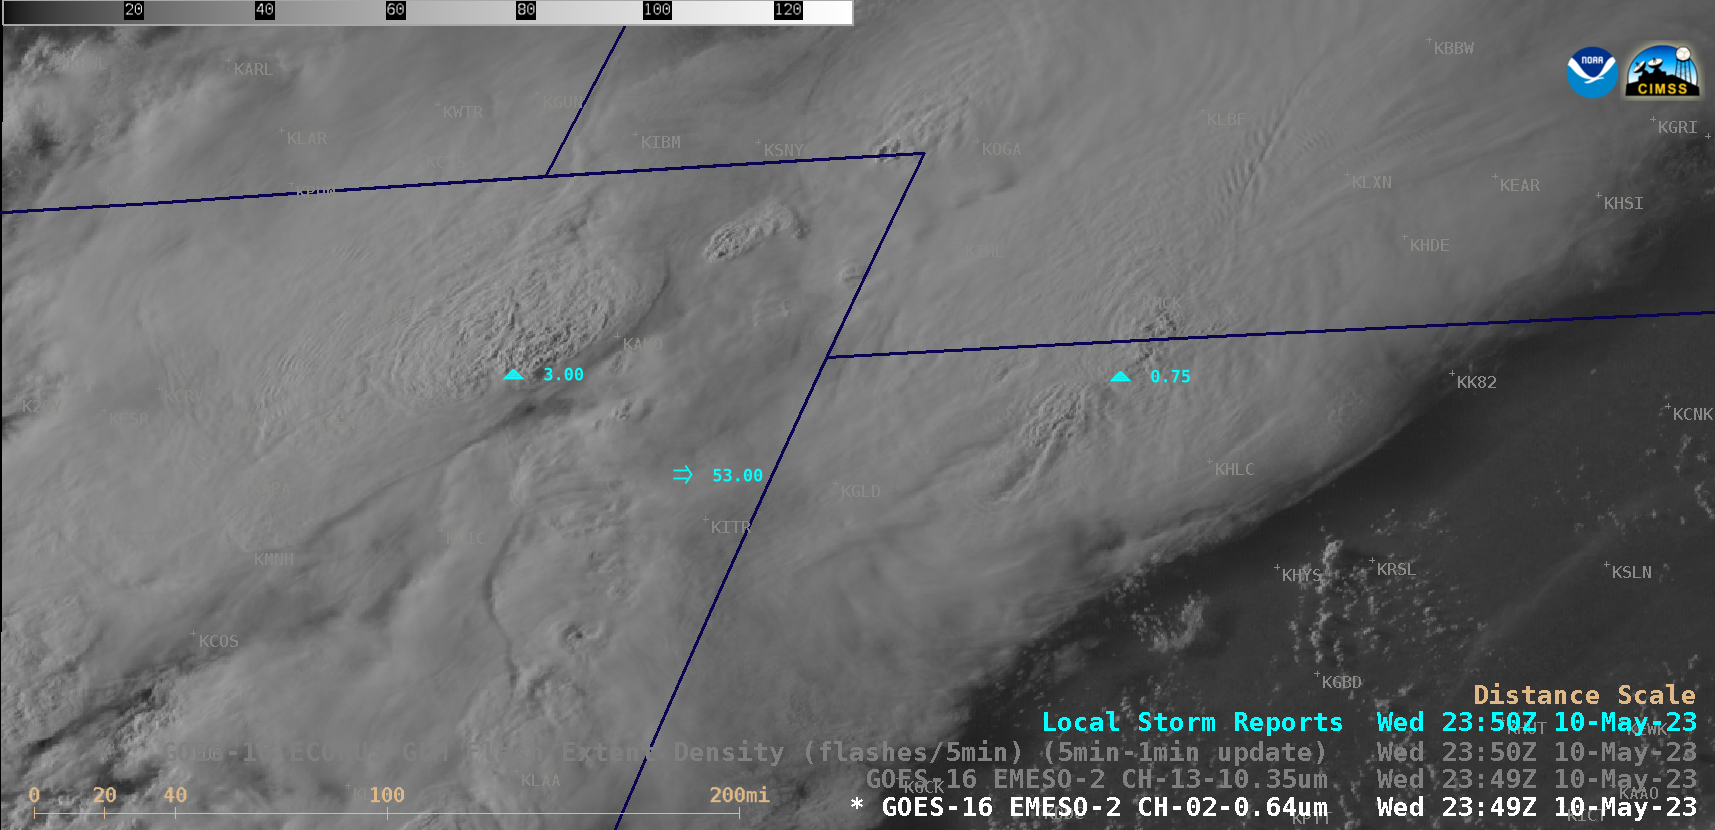
GOES-16 Visible/Infrared Sandwich RGB images, with Local Storm Reports plotted in cyan [click to play animated GIF | MP4]
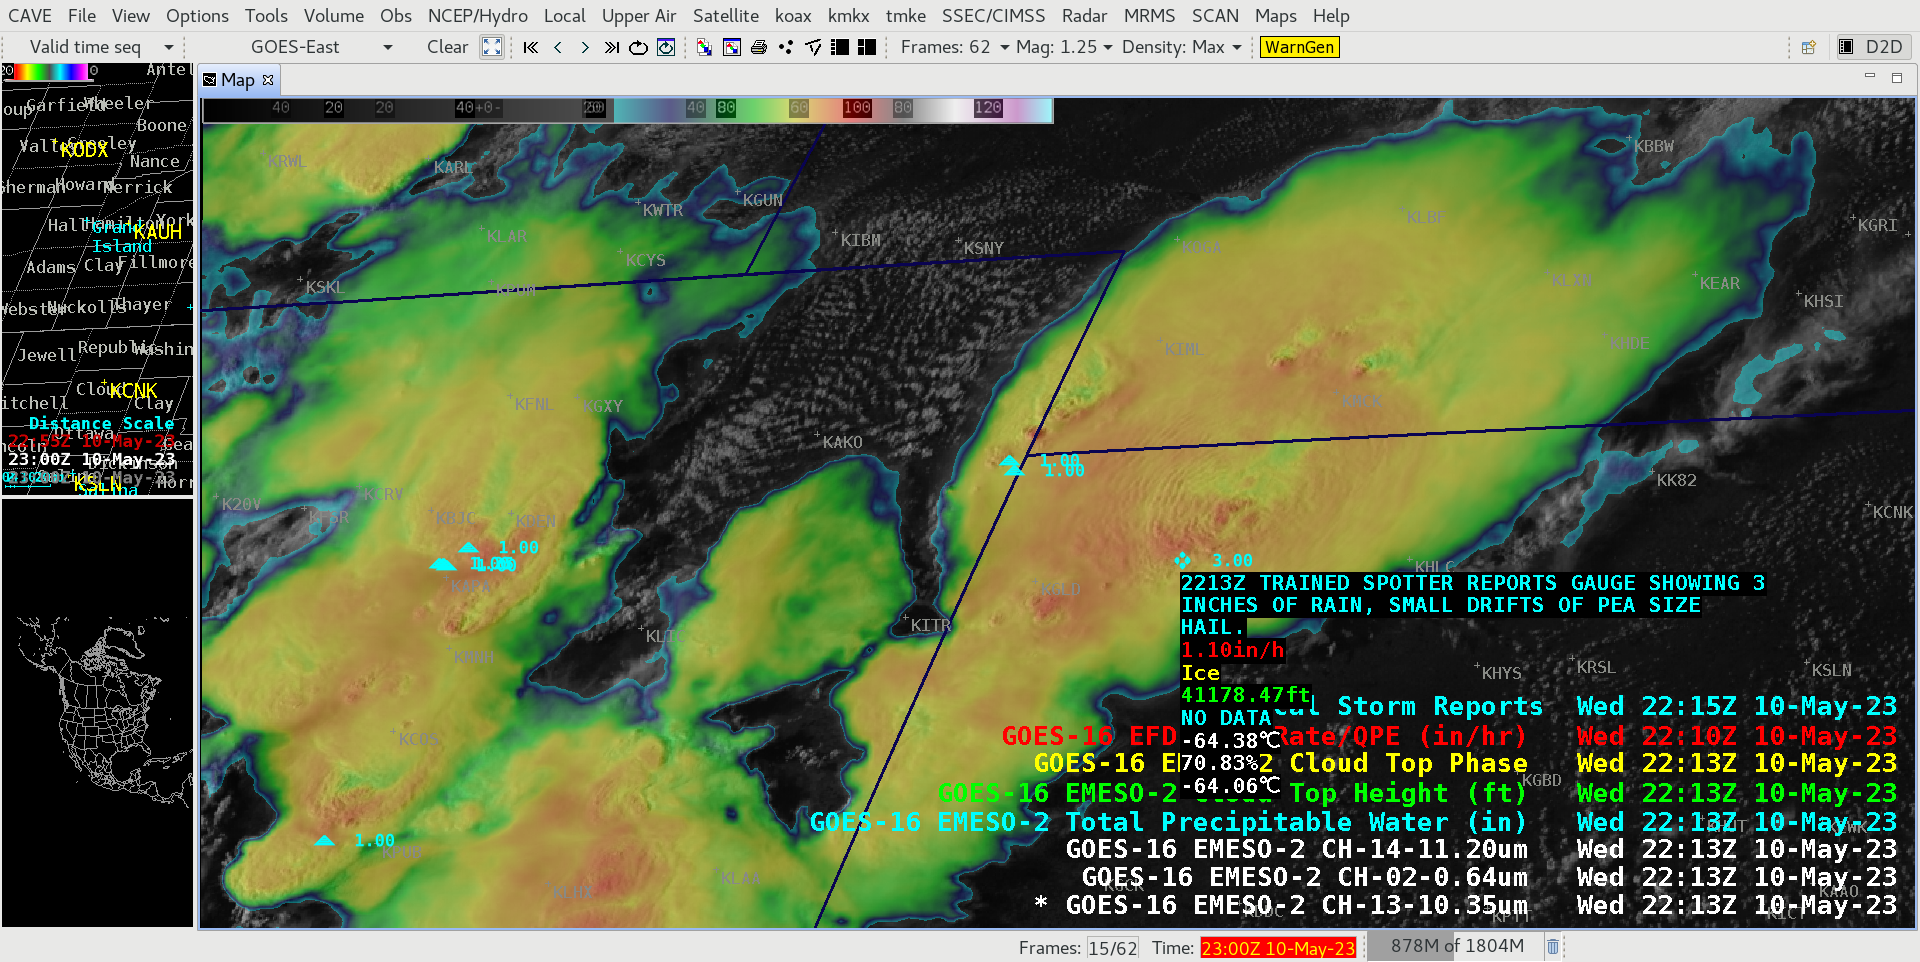
There were also several reports of heavy rainfall — GOES-16 Visible/Infrared Sandwich RGB images at 1956 UTC UTC, 2100 UTC and 2124 UTC (below) include a cursor sampling of the associated Rainfall Rate (red), Cloud Top Phase (yellow) and Cloud Top Height (green) Level 2 Derived Products over the location of Local Storm Reports of Heavy Rainfall. Cursor readout values of Rainfall Rate remained in the 1.85-1.90 inch/hour range during the 20-25 minutes prior to each of these 3 heavy rainfall Local Storm Reports.
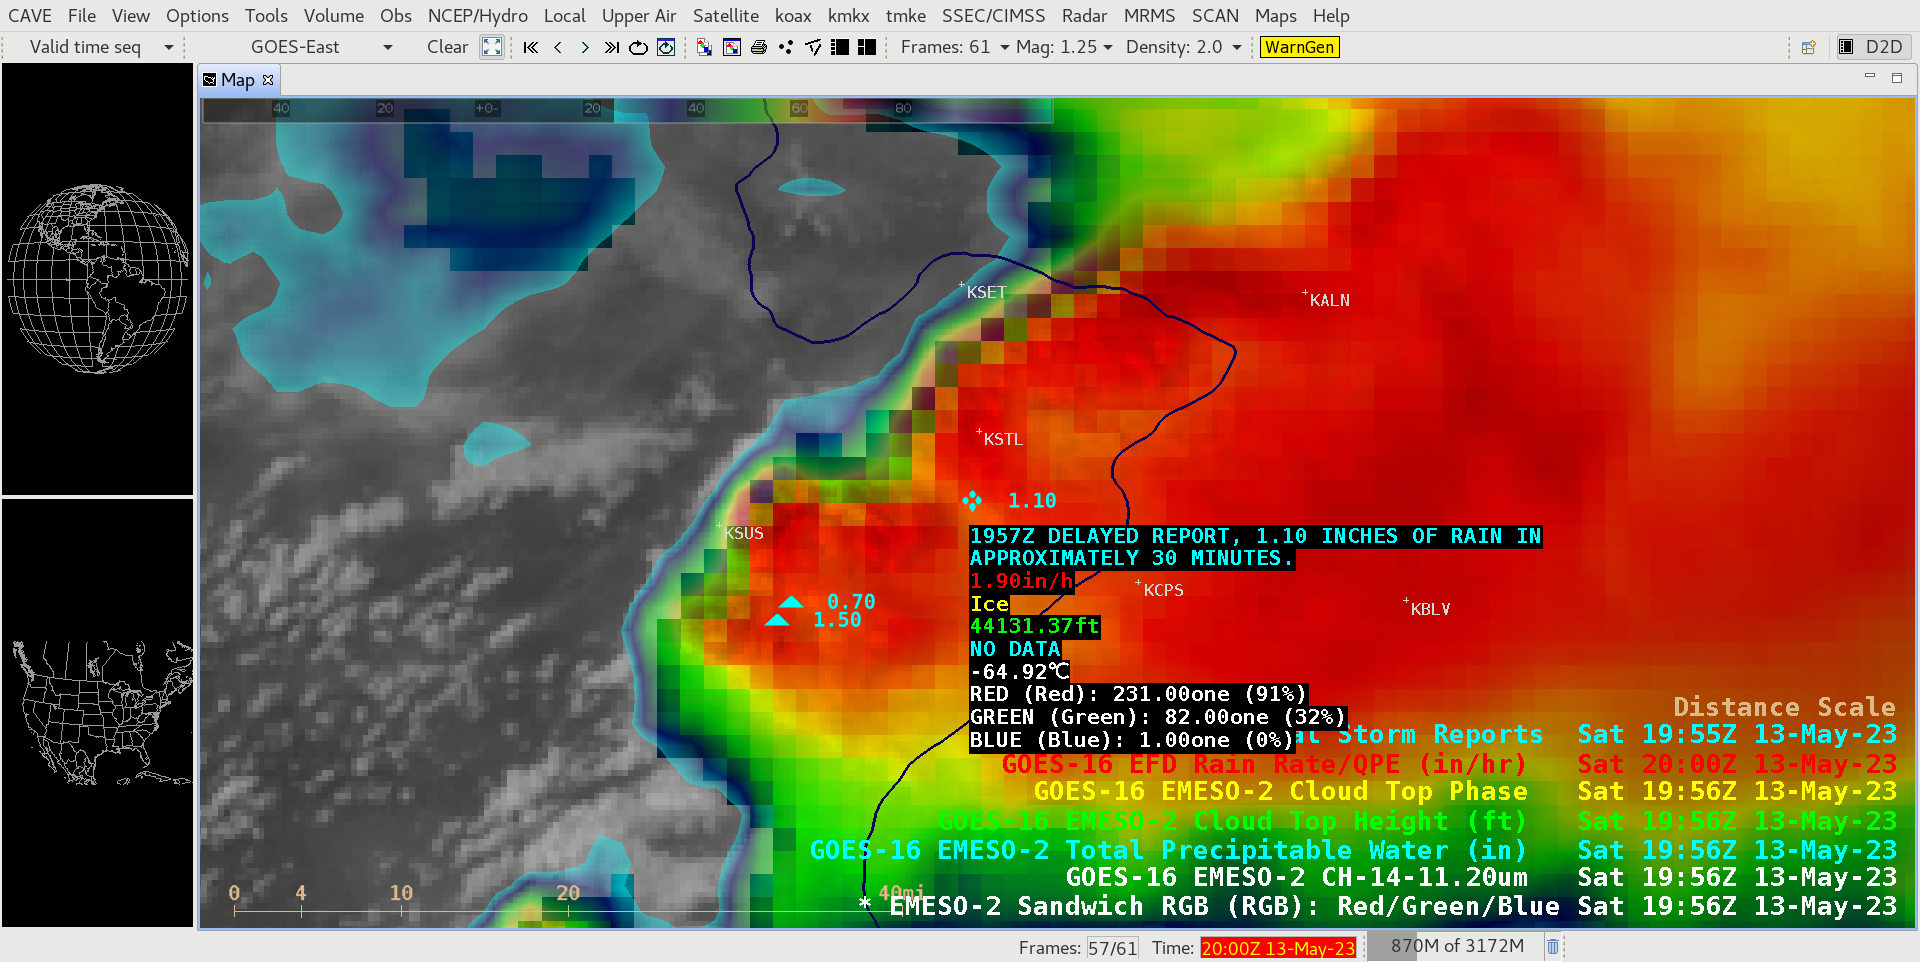
GOES-16 Visible/Infrared Sandwich RGB image at 1956 UTC, with cursor sampling of the associated Rainfall Rate (red), Cloud Top Phase (yellow) and Cloud Top Height (green) Level 2 Derived Products [click to enlarge]
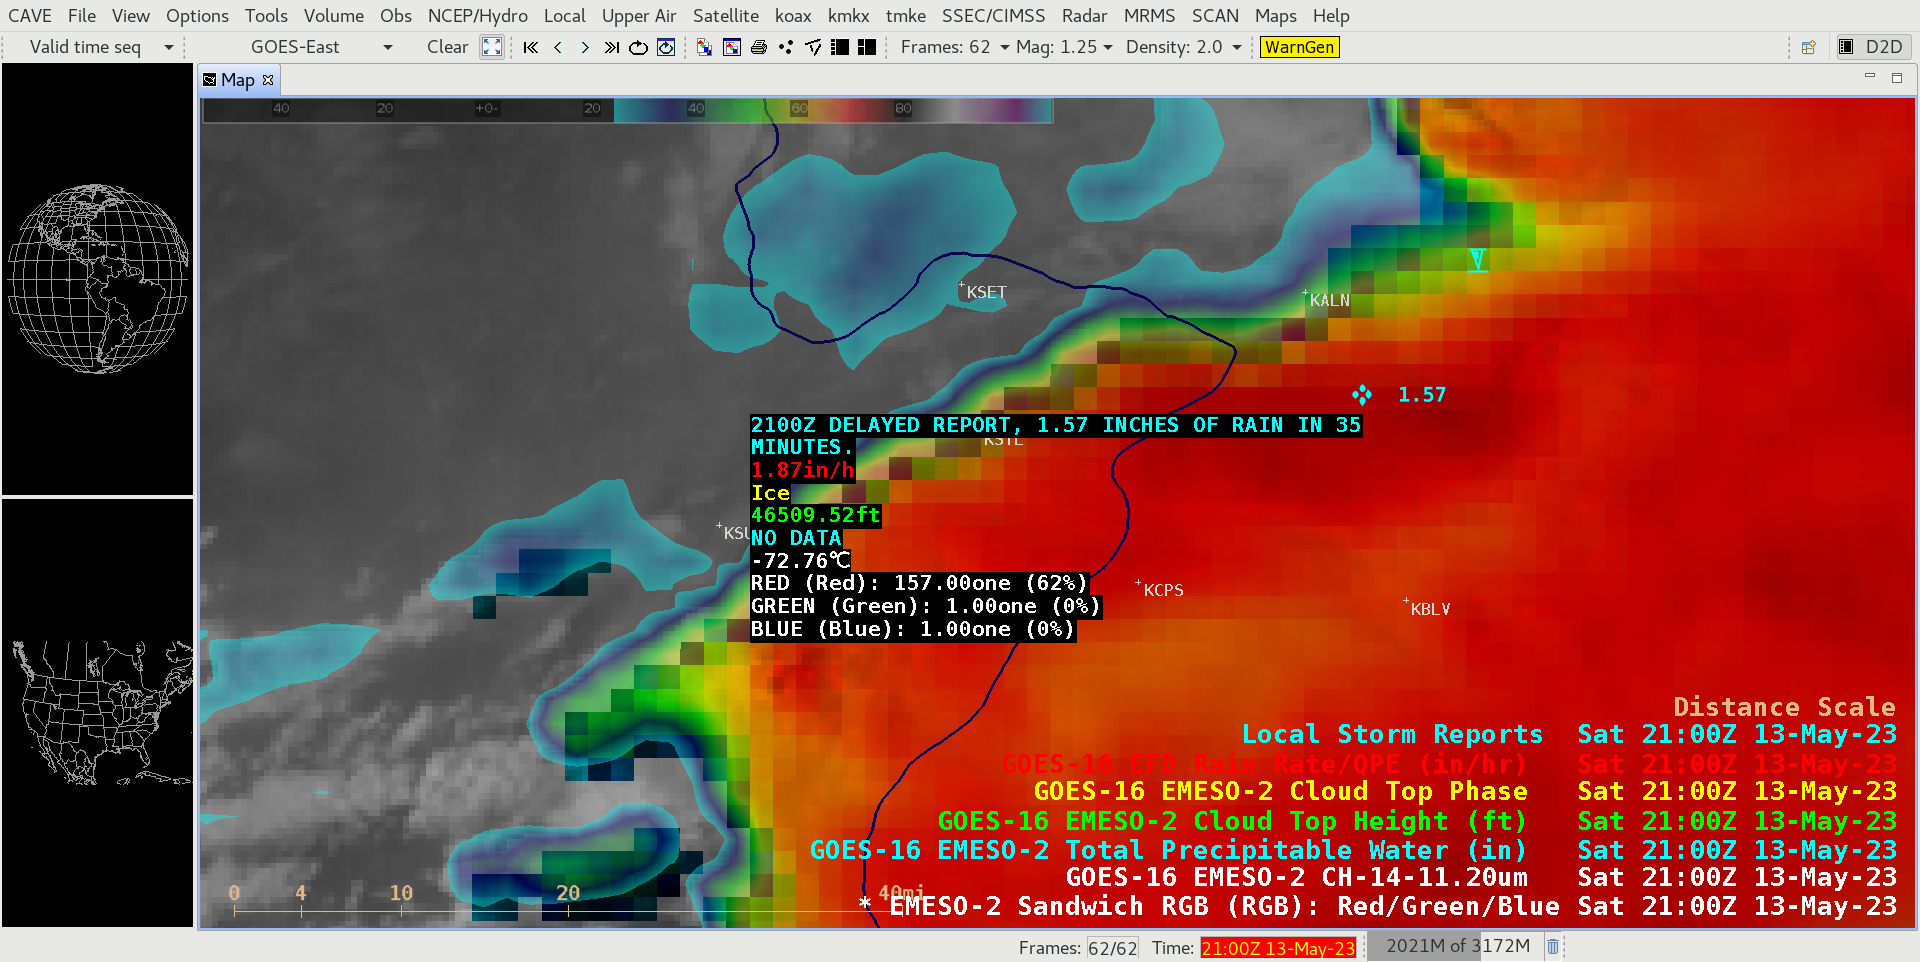
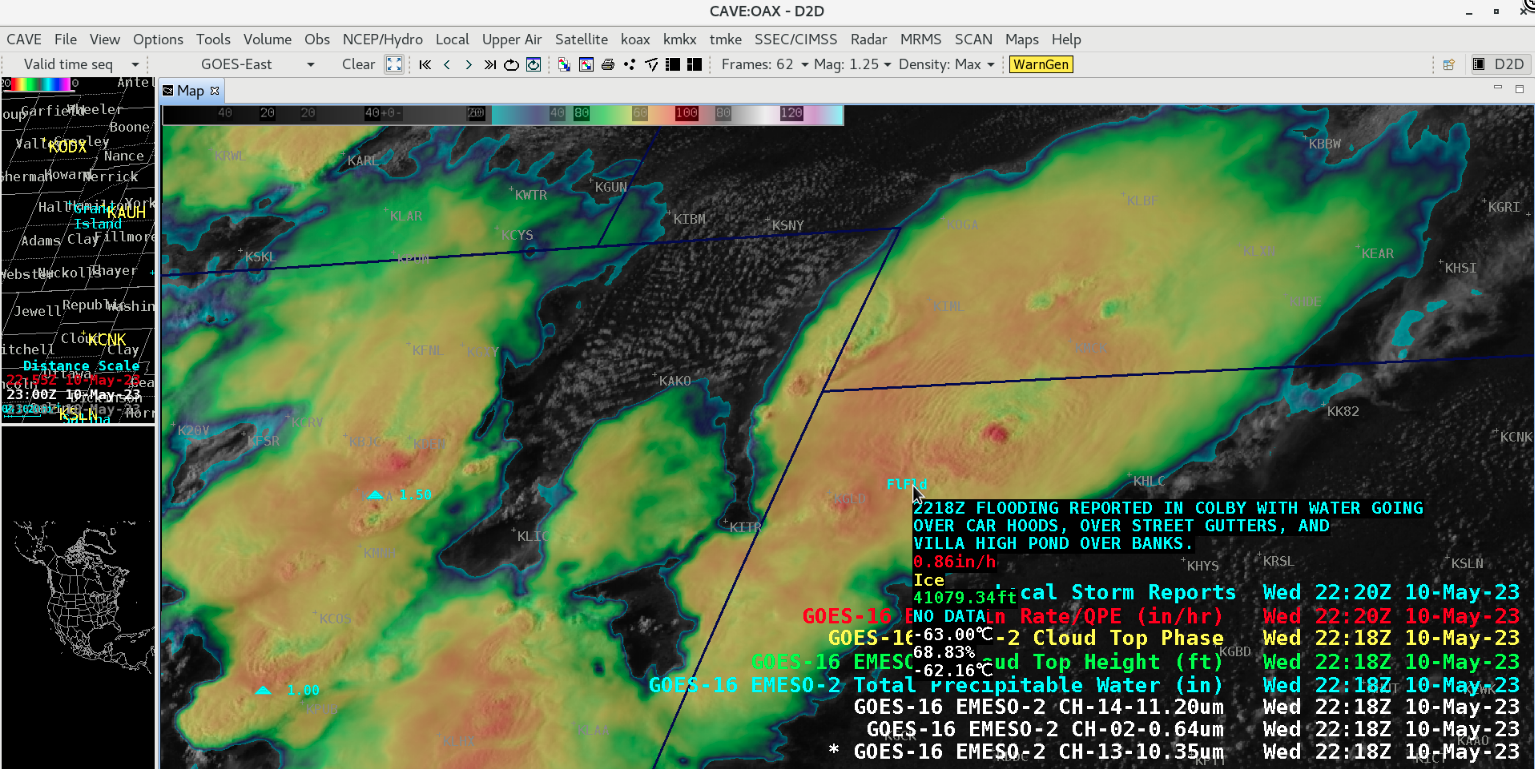
GOES-16 Visible/Infrared Sandwich RGB image at 2100 UTC, with cursor sampling of the associated Rainfall Rate (red), Cloud Top Phase (yellow) and Cloud Top Height (green) Level 2 Derived Products [click to enlarge]
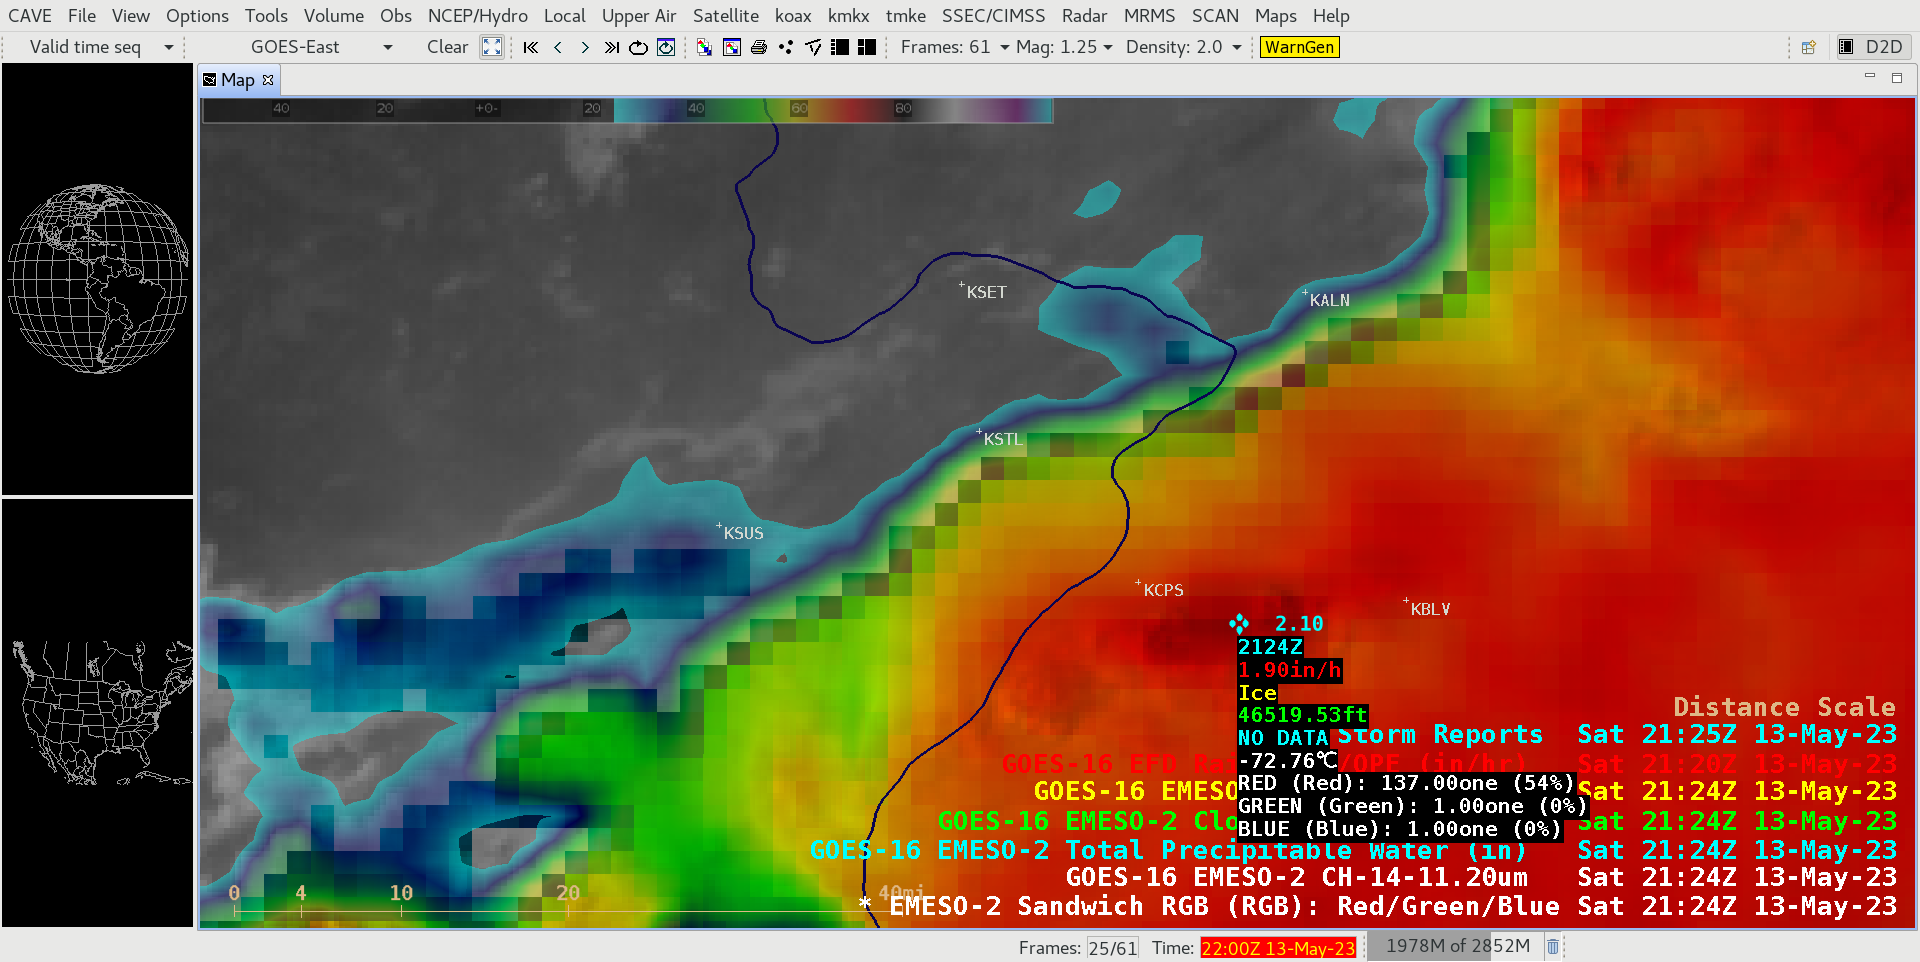
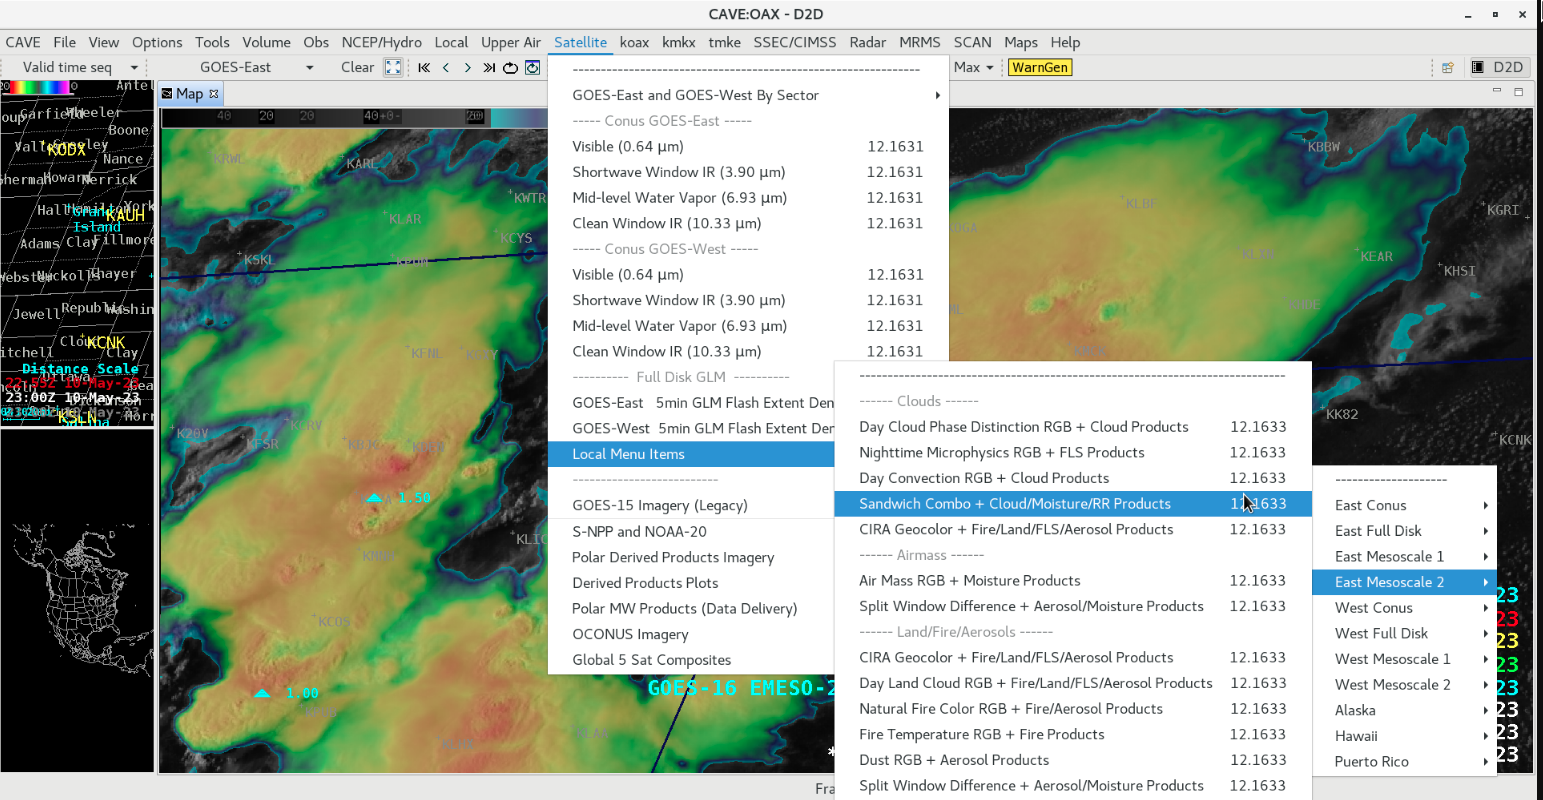
GOES-16 Visible/Infrared Sandwich RGB image at 2124 UTC, with cursor sampling of the associated Rainfall Rate (red), Cloud Top Phase (yellow) and Cloud Top Height (green) Level 2 Derived Products [click to enlarge]
View only this post Read Less


