This website works best with a newer web browser such as Chrome, Firefox, Safari or Microsoft
Edge. Internet Explorer is not supported by this website.
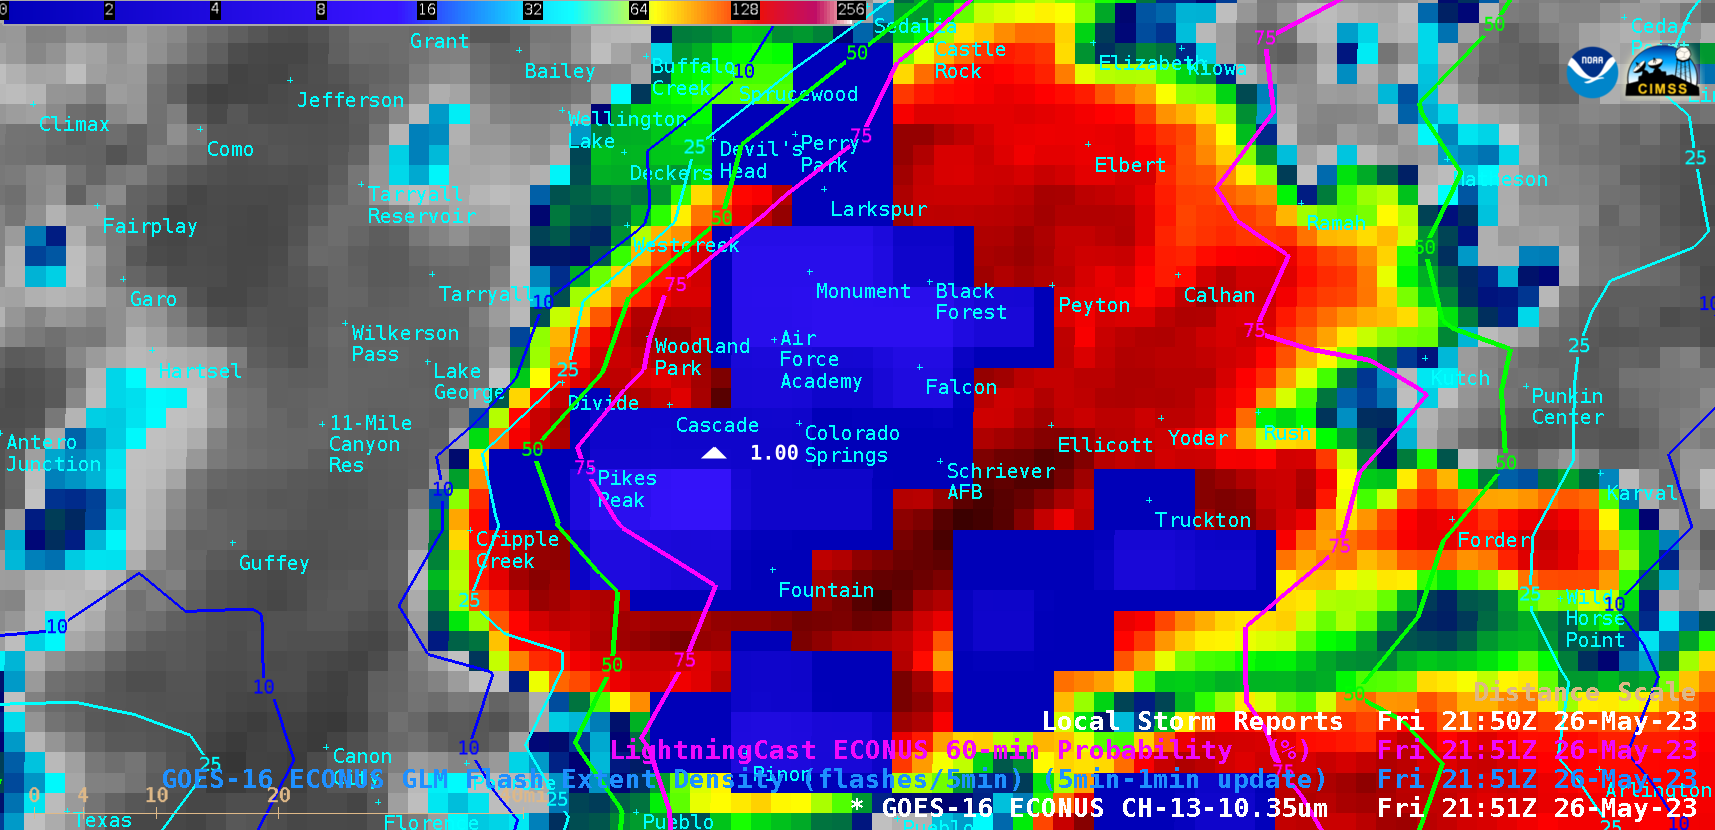
2 people were hospitalized after being struck by lightning on a Colorado Springs golf course (media report) around 2140 UTC on 26 May 2023. 5-minute GOES-16 (GOES-East) “Clean” Infrared Window (10.3 µm) images (above) showed thunderstorms that were increasing in coverage/intensity as they moved northeastward toward the Colorado Springs area (eventually producing 1.00-inch-diameter hail) — and Lightning Cast... Read More
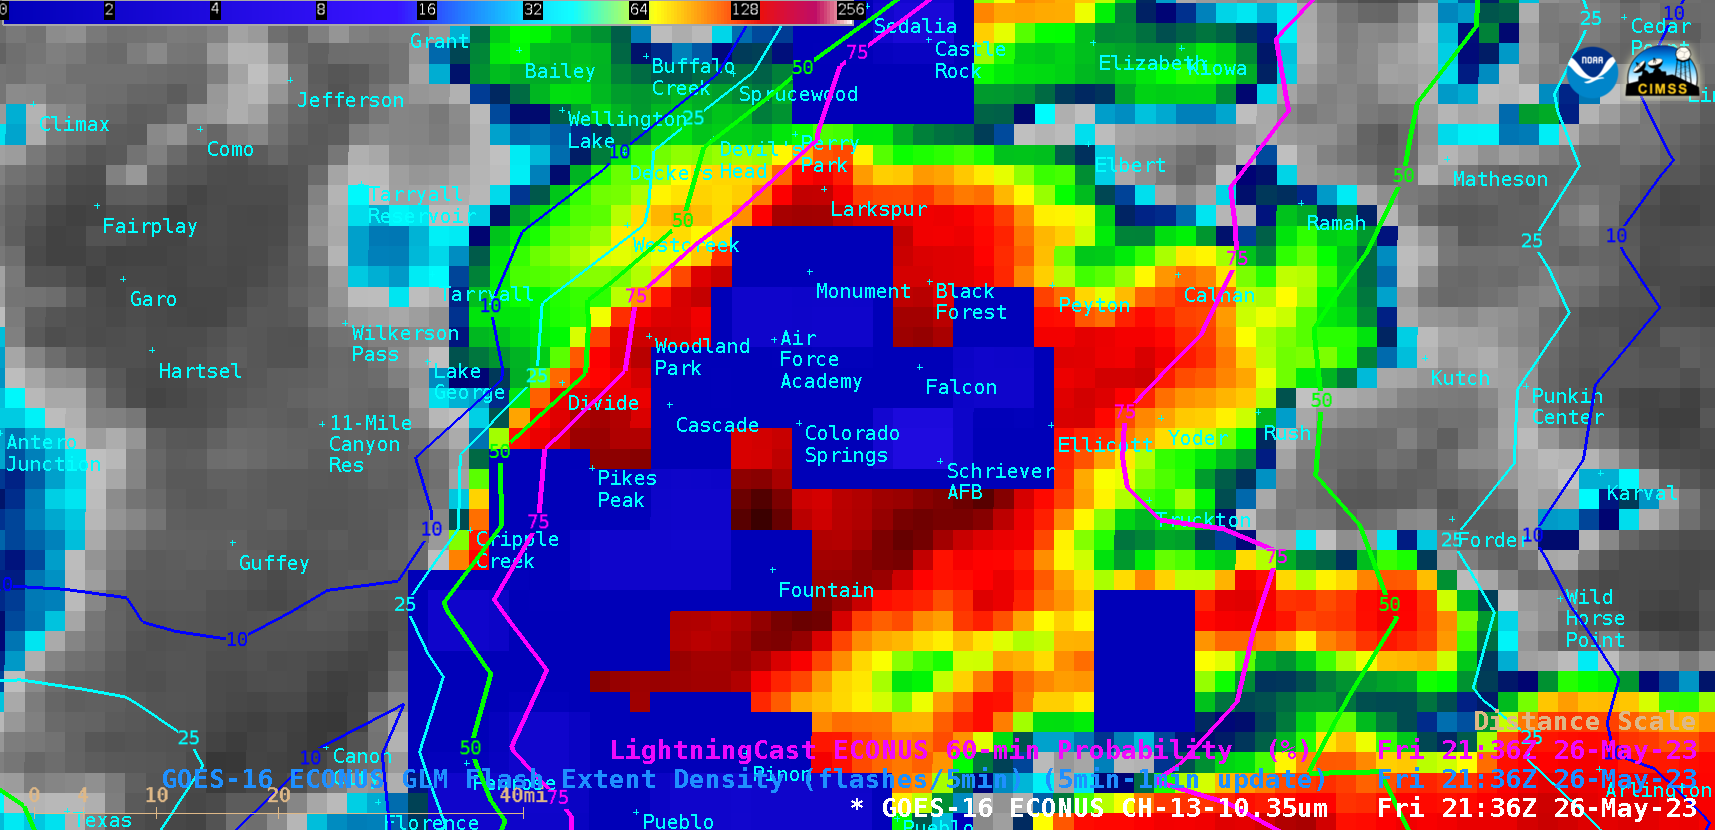
GOES-16 “Clean” Infrared Window (10.3 µm) images, with/without an overlay of GLM Flash Extent Density and contours of LightningCast Probability [click to play animated GIF| MP4]
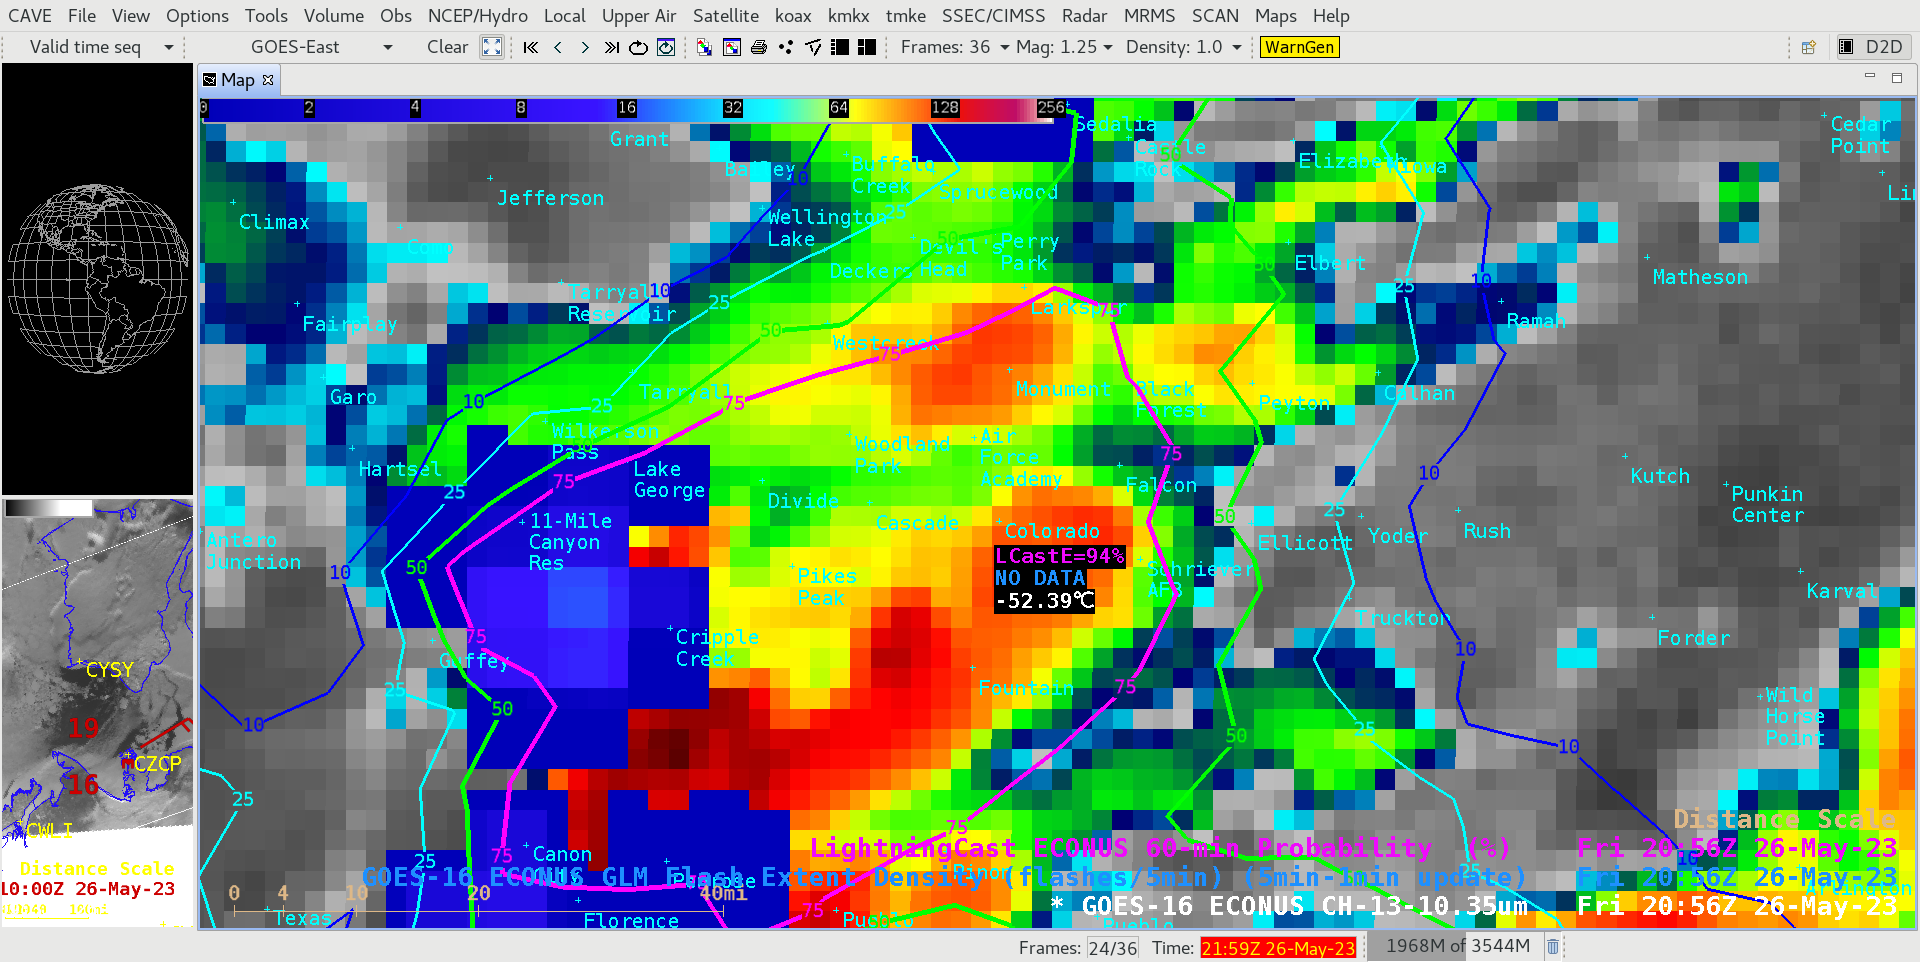
2 people were hospitalized after being struck by lightning on a Colorado Springs golf course (media report) around 2140 UTC on 26 May 2023. 5-minute GOES-16 (GOES-East) “Clean” Infrared Window (10.3 µm) images (above) showed thunderstorms that were increasing in coverage/intensity as they moved northeastward toward the Colorado Springs area (eventually producing 1.00-inch-diameter hail) — and Lightning Cast Probability values over Colorado Springs began to steadily increase after 1901 UTC, reaching or exceeding 50%/75%/90% at 2021 UTC/2046 UTC/2056 UTC respectively.
The occurrence of GLMFlash Extent Density pixels directly over Colorado Springs began at 2121 UTC — 25 minutes after the initial 90% LightningCast value, 35 minutes after the initial 75% LightningCast value and 60 minutes after the initial 50% LightningCast value. Decision support for outdoor events benefits from the lead time offered by the LightningCast tool.
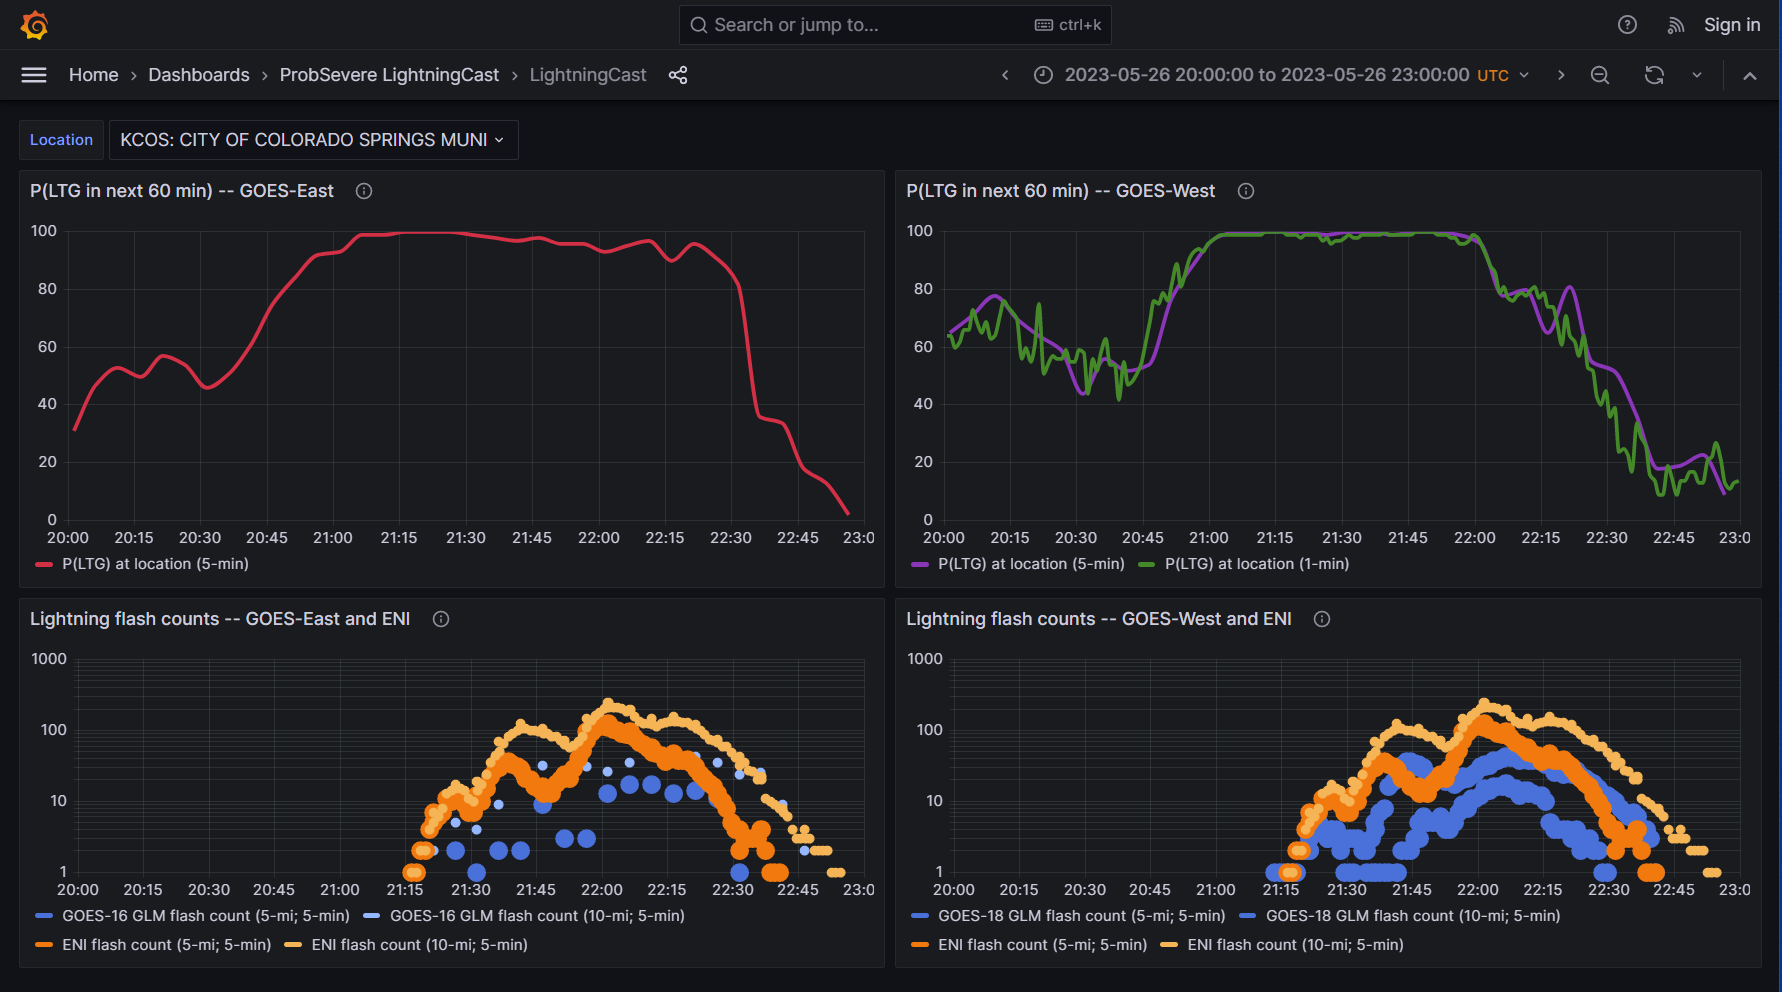
The LightningCast webite (here) includes a ‘Lightning Meteogram’ tool for airports within the USA and Canada; the one for the Colorado Springs CO airport (KCOS) for this event is shown below for both GOES-16 CONUS data (left) and GOES-18 PACUS/Meso (right) — a GOES-18 Mesoscale sector was over Colorado during this event. LightningCast probabilities — that a GLM detection will occur within the next 60 minutes — were very large before the lightning near the airport, and tapered off before the lightning diminished.
ProbSevere LightningCast Probabilities for GOES-16 CONUS data scanning (upper left) and GOES-18 PACUS and Mesosector data (upper right); Lightning observations from ENI within 5 and 10 miles of airport KCOS (bottom left and right); and GLM Flash Count within 5 and 10 miles of KCOS from GOES-16 (lower left) and GOES-18 (lower right) (Click to enlarge)
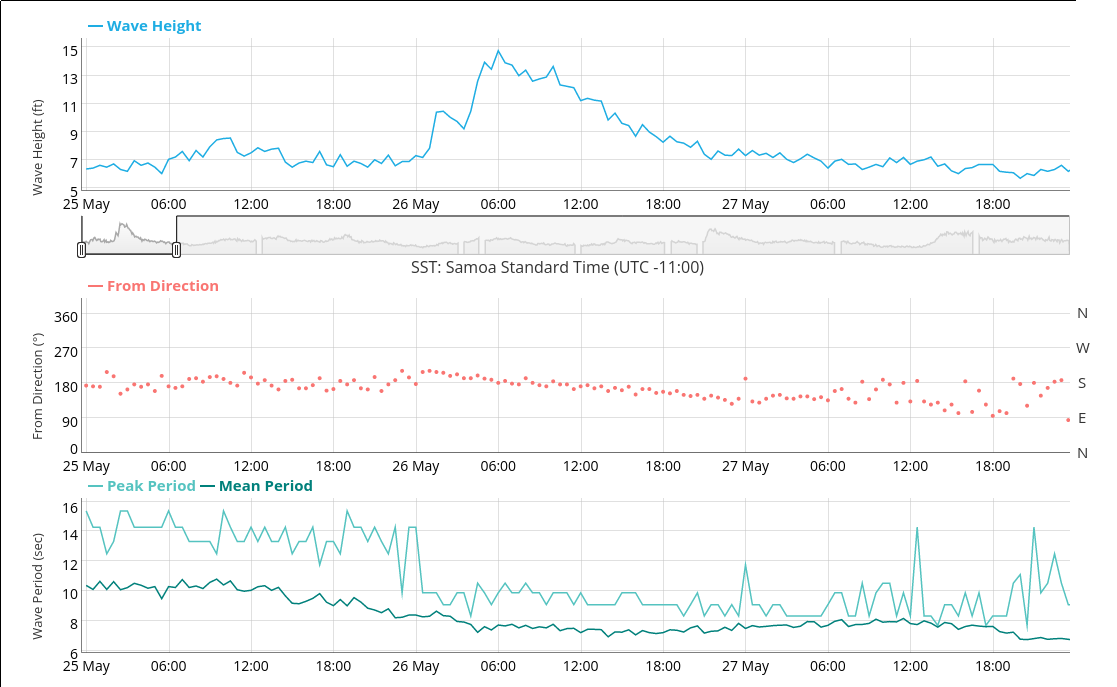
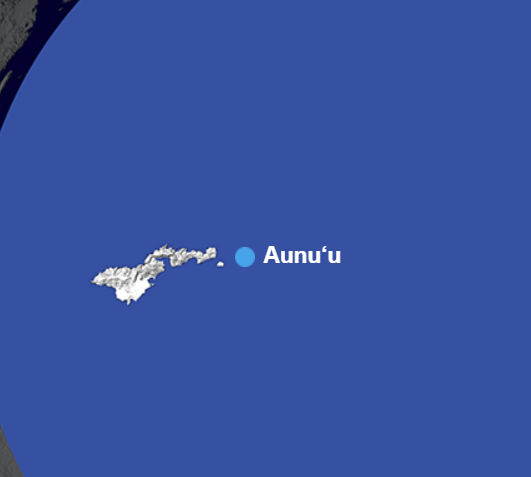
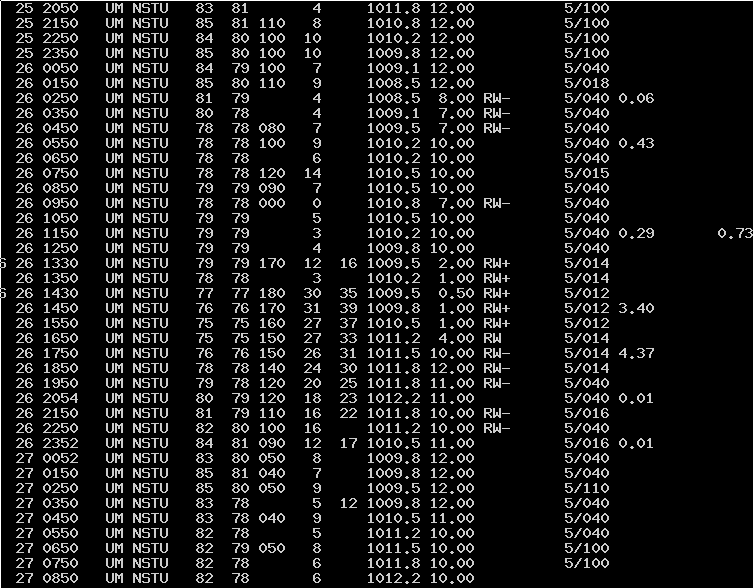
A meteogram of surface observations at Pago Pago International Airport, above, shows a period of heavy rain and strong winds between 1400 and 2300 UTC on 26 May 2023. The strong winds had a big affect on waves at Aunu’u, as shown below (imagery from this website; click here to see the... Read More
Surface observations at NSTU (Pago Pago International Airport) from 2000 UTC 25 May through 23 UTC 27 May 2023 (Click to enlarge)
A meteogram of surface observations at Pago Pago International Airport, above, shows a period of heavy rain and strong winds between 1400 and 2300 UTC on 26 May 2023. The strong winds had a big affect on waves at Aunu’u, as shown below (imagery from this website; click here to see the location of that buoy). What kind of satellite products could help a forecaster anticipate this inclement weather?
Wave Height and principal wave direction on 25-27 May 2023 at Aunu’u to the east of Tutuila (Click to enlarge)GOES-18 Night Microphysics RGB, 1000-1950 UTC on 26 May 2023 (Click to enlarge)
GOES-18 Night Microphysics RGB imagery from 1000-1950 UTC on 26 May is shown above. It is a challenge to intuit any kind of low- or mid-level feature that might be triggering convection in this imagery because of the preponderance of high clouds (red in this RGB) (Note also that barcode noise artifacts do appear in this RGB and show up as vertical yellow streaks; here are GOES-18 PACUS images that show the noise on 26 May). The window channel imagery (Band 13, 10.3 µm) loaded with the Total Precipitable Water fields is shown below. GOES-18 TPW is a clear-sky only product, and therefore little information is present in the active band of precipitation — but it does show abundant moisture to the north of Samoa, with dryer air to the northeast and southwest. (AWIPS Note: I’ve changed the default TPW values here from 0-2.5″ to 1-2.5″ because values between 0 and 1″ in this part of the Globe are exceptionally rare!). Strong convection develops between Upolu and Tutuila around 1200 UTC and the moves eastward to cover Tutuila. (Click here to see a METAR listing from Pago Pago; heavy rain started at 1330 UTC). Also: there is a parallax shift in the imagery below. GOES-18 sits over the Equator at 137 o W, to the east of the imagery below that has the 170oW longitude line in its center; the true location of the cloud tops will be to the east of their displayed location, so they are developing closer to Tutuila than in the display.
GOES-18 Clean Window Infrared (Band 13, 10.3 µm) imagery, and Total Precipitable Water, 1000-1950 UTC on 26 May 2023 (Click to enlarge)
CIMSS creates LightningCast probabilities for the South Pacific surrounding American Samoa, available at this website (choose the ‘American Samoa’ sector). The animation below shows Probabilities of a GLM observation with the next 60 minutes (i.e., LightningCast Probability) increasing to the west of Tutuila starting around 1200 UTC and then persisting at high values around the island. One can use this product to anticipate not only lightning, but also the strong convection that produces lightning.
ProbSevere LightningCast Probabilities displayed with GOES-18 Clean Window infrared imagery, 1000-1400 UTC on 26 May 2023 (Click to enlarge)MIMIC Total Precipitable Water (TPW), 0000-1500 UTC on 26 May 2023 (Click to enlarge)
As noted above, GOES-18 Level 2 TPW fields provided scant information for this event because of abundant clouds. MIMIC TPW, in contrast (shown above), derived from microwave data that is then redistributed with pressure-weighted GFS winds, shows an atmosphere rich in moisture across the Samoan island chain, with largest values of TPW moving over the island chain towards the end of this animation. The upper-air Soundings at Pago Pago, below, from 0000 and 1200 UTC on 26 May (from this site) shows an increase in TPW during those 12 hours as well, from 58 to 62 mm. That is near the maximum observed value for 26 May at this site (source).
SkewT-logP Rawinsonde, Pago Pago, 0000 and 1200 UTC on 26 May 2023 (click to enlarge)
What kind of wind observations could be used to anticipate the strong winds?
GCOM-w1 AMSR-2 Wind Speeds, 25 and 26 May 2023 (Click to enlarge)
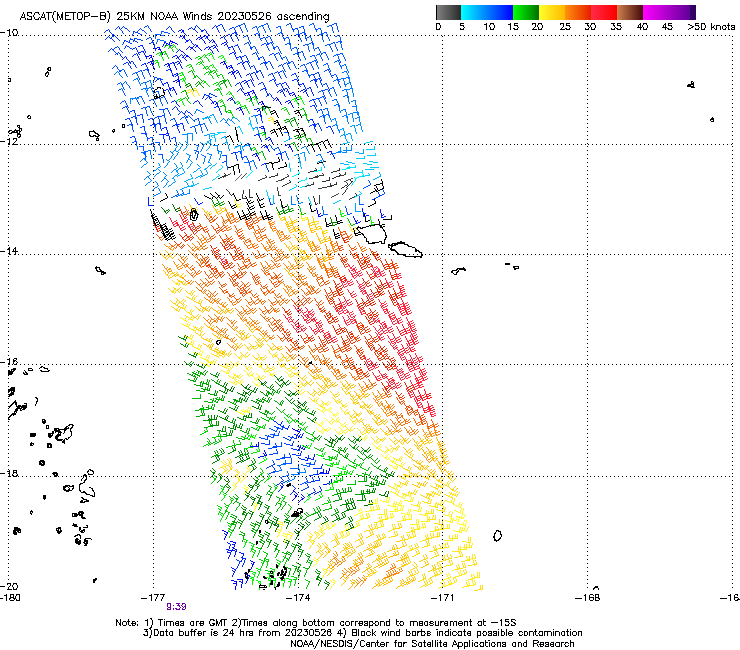
Microwave estimates of wind from the AMSR-2 instrument on GCOM-W1, above, show the development of strong winds just to the south of the Samoan island chain by the time of the descending pass on 26 May. A similar increase is apparent in the ASCAT winds, below, from MetopB! The peak winds have increased, and the areal extent of the strong winds has definitely expanded!
MetopB ASCAT winds at ca. 2100 UTC on 25 May and ca. 0900 UTC on 26 May 2023 (Click to enlarge)
The TROPICS constellation of satellites was augmented by a final launch of two cubesats from the Mahia Rocket Launch site at the south end of the Mahia Peninsula on the east coast of New Zealand’s North Island on 26 May 2023. GOES-18 visible imagery, above, stepping from 0320 to 0350 UTC on 26 March,... Read More
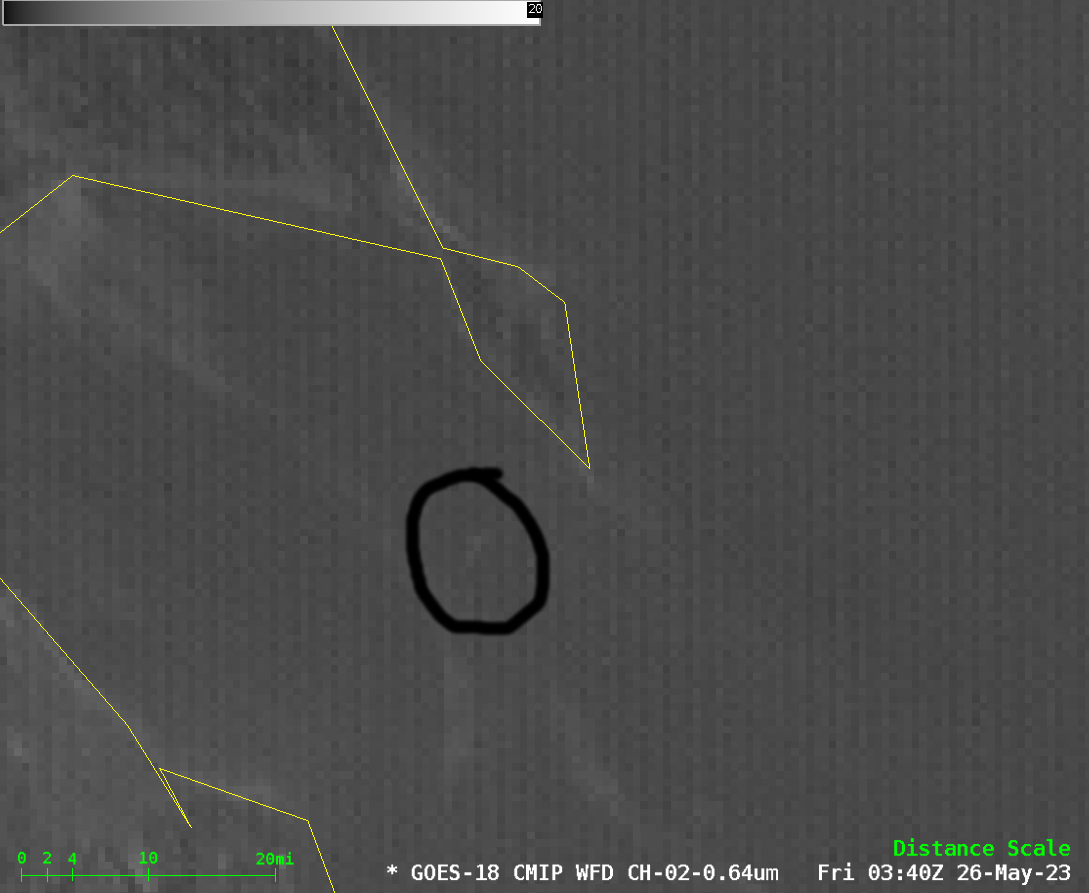
GOES-18 Band 2 Visible (0.64 µm) imagery, 0320 – 0350 UTC on 26 May 2023 (Click to enlarge) The Mahia peninsula is top center in the image (with poor map resolution) and the launch facility is at its southern point
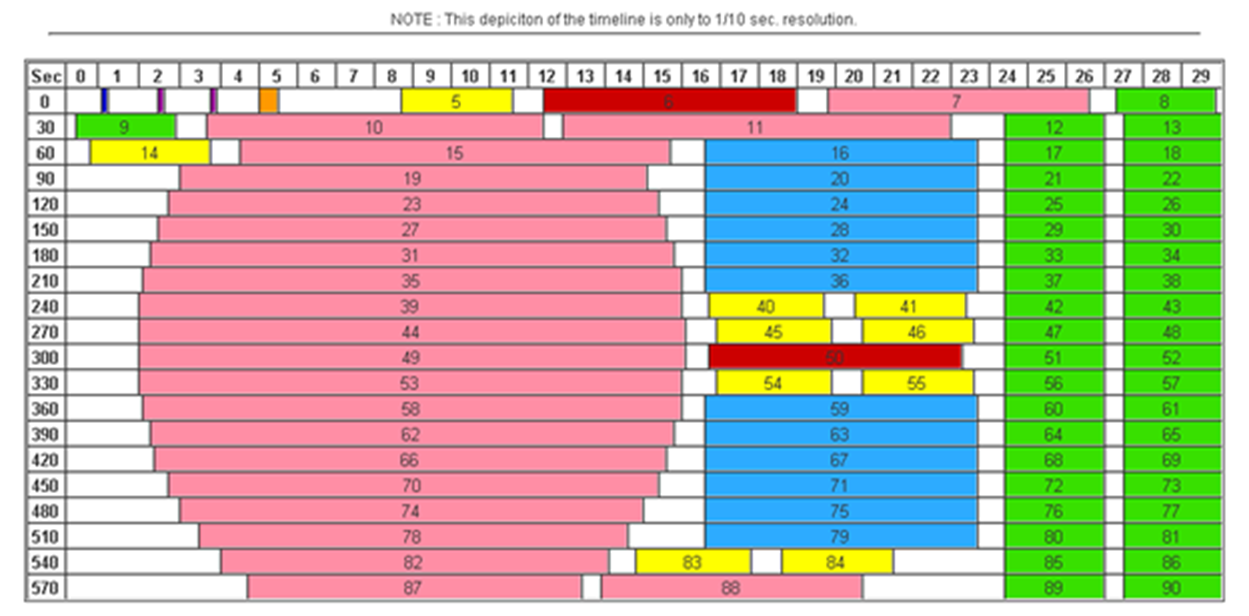
The TROPICS constellation of satellites was augmented by a final launch of two cubesats from the Mahia Rocket Launch site at the south end of the Mahia Peninsula on the east coast of New Zealand’s North Island on 26 May 2023. GOES-18 visible imagery, above, stepping from 0320 to 0350 UTC on 26 March, shows a smudge in the 0340 UTC imagery (highlighted below). What facts argue for this feature being associated with the launch? The smudge is there at the correct time: launch was at 1046 PM CDT or 0346 UTC on 26 May. The timestamp of the image, 0340 UTC, is when ABI starts scanning at the North Pole; the Mode 6 Scanning timeline (here) suggests scanning at 39oS, the latitude of the Mahia Launch facility, occurred between 0347 and 0348 UTC. Thus, the plume would be at considerable height in the image. The cubesats do travel west to east (see the figure at this page) so you should not expect the plume to be west of the launch site. However, Mahia, at 39.3° S, 177.9° E is far from the GOES-18 sub-satellite point (0oN, 137o W), so the westward displacement of the (possible) plume is likely an artifact of parallax (link) which for that location and a 50000′ height is close to 40km/25 miles southwestward of its true location.
GOES-18 Band 2 Visible (0.64 µm) imagery, 0340 UTC on 25 May 2023 (Click to enlarge)
Note: the reflectance range for GOES-18 visible imagery above has been altered for this post, from the default (0-130) to 1-20 to better highlight the possible plume.
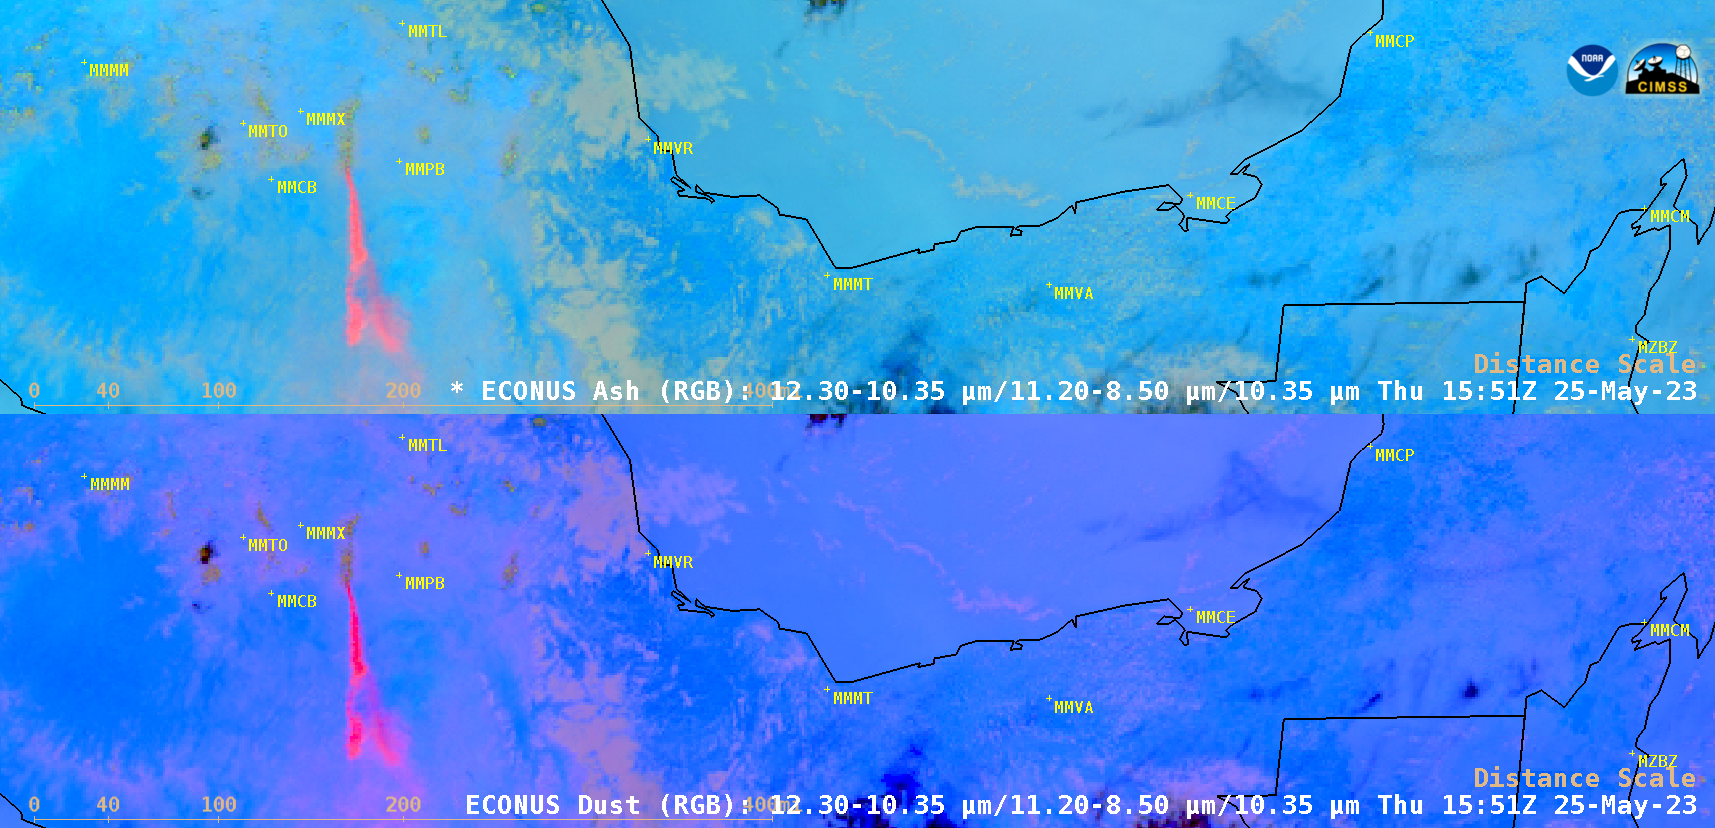
GOES-16 (GOES-East) Ash RGB images and Dust RGB images (above) showed numerous volcanic plumes emanating from Popocatépetl in central Mexico during the 5-day period from 21 May – 25 May 2023. On 21 May, the airport at Puebla (MMPB) was temporarily closed, due to the potential adverse impact of volcanic ash to... Read More
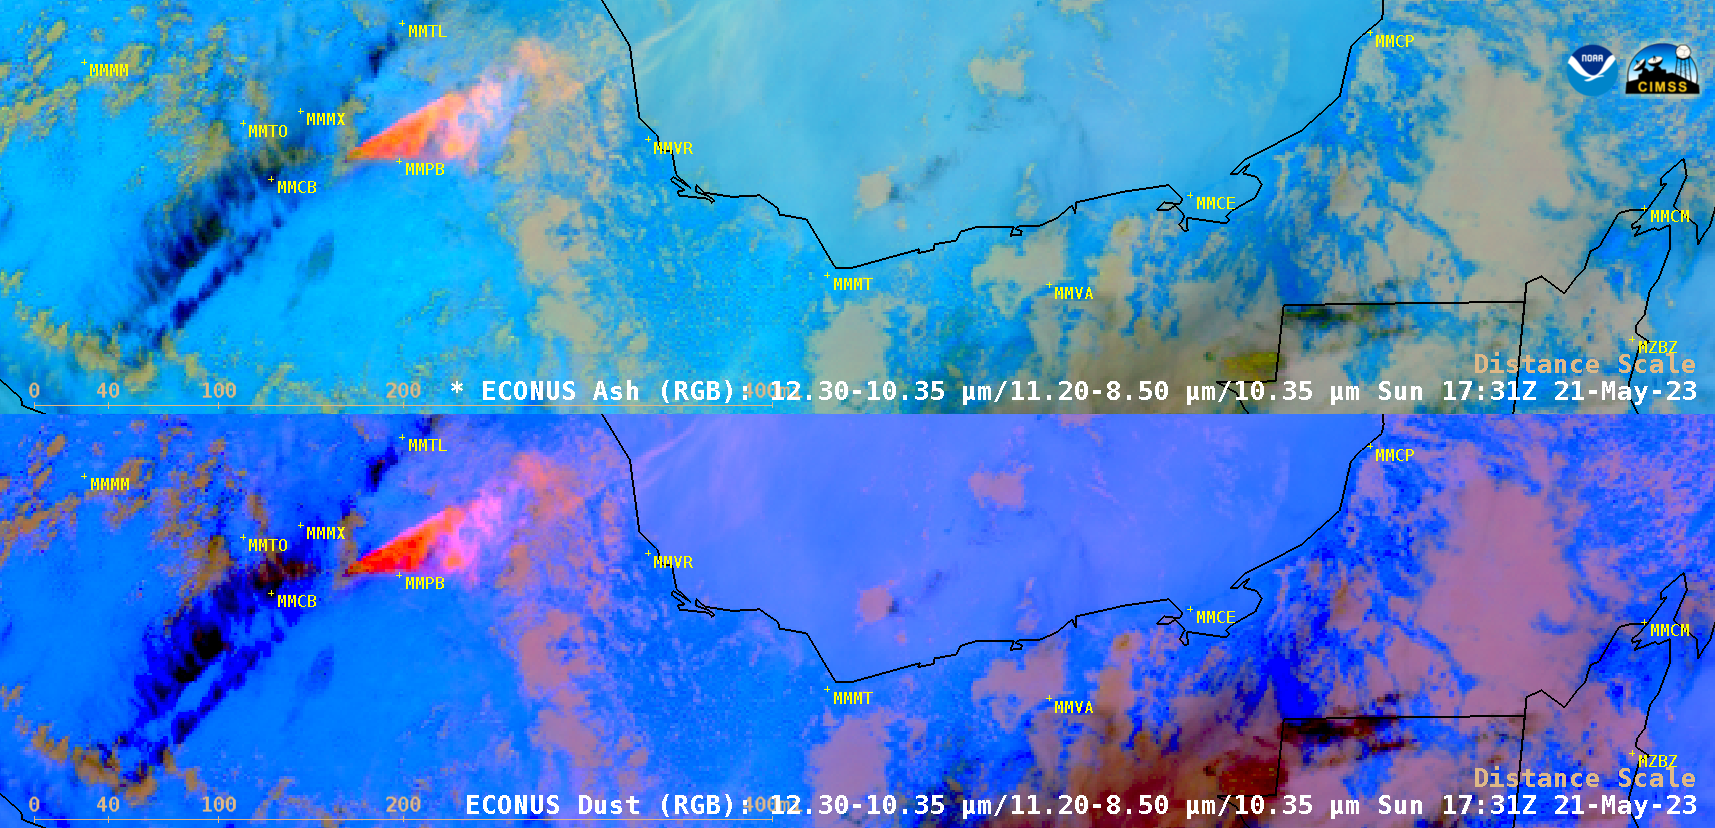
GOES-16 Ash RGB images (top) and Dust RGB images (bottom) [click to play MP4 animation]
GOES-16 (GOES-East)Ash RGB images and Dust RGB images (above) showed numerous volcanic plumes emanating from Popocatépetl in central Mexico during the 5-day period from 21 May – 25 May 2023. On 21 May, the airport at Puebla (MMPB) was temporarily closed, due to the potential adverse impact of volcanic ash to aviation (1731 UTC images) — and ash fall occurred within the city. At times the volcanic plumes were either partially or completely obscured by meteorological clouds, but for the most part the majority of eruptive events were well-sampled by the 5-minute GOES-16 imagery.
Even though the Ash RGB and Dust RGB products leverage the same ABI spectral bands, the various RGB components are scaled differently — which in this case led to the ash plumes exhibiting a more notable signature in the Dust RGB images (brighter shades of pink to magenta).


