
GOES-16 (GOES-East) Shortwave Infrared (3.9 µm) and Fire Power derived product images during the 5-day period from 27 May – 31 May 2023 (above) showed the thermal signature of wildfires burning in far southern Nova Scotia — which forced the evacuation of 40% of the residents in the area southwest of Shelburne (near airport... Read More
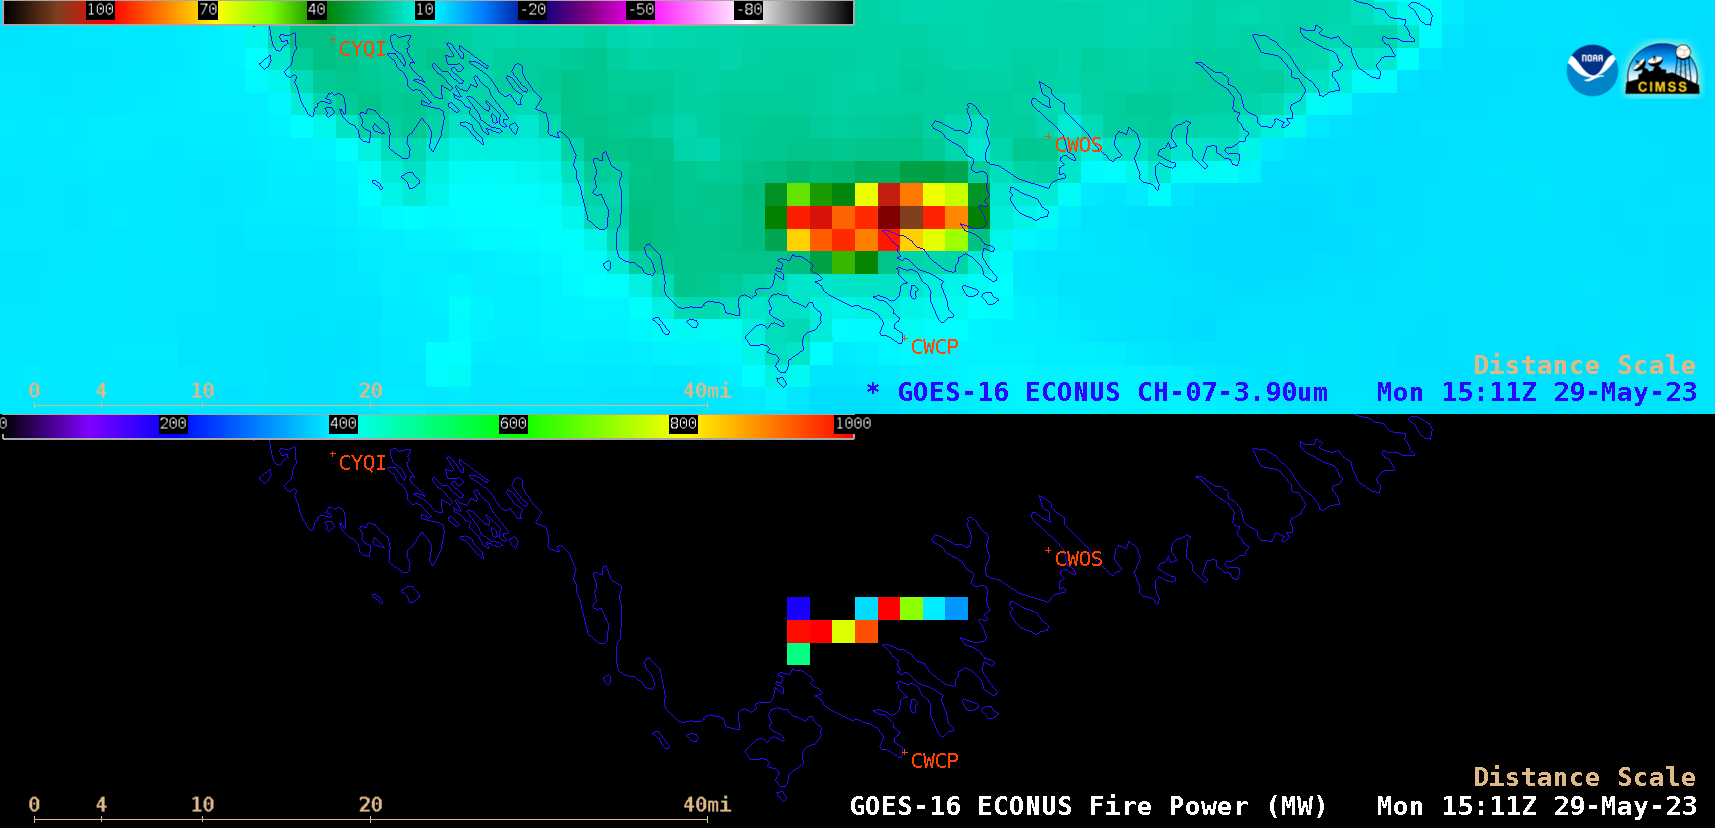
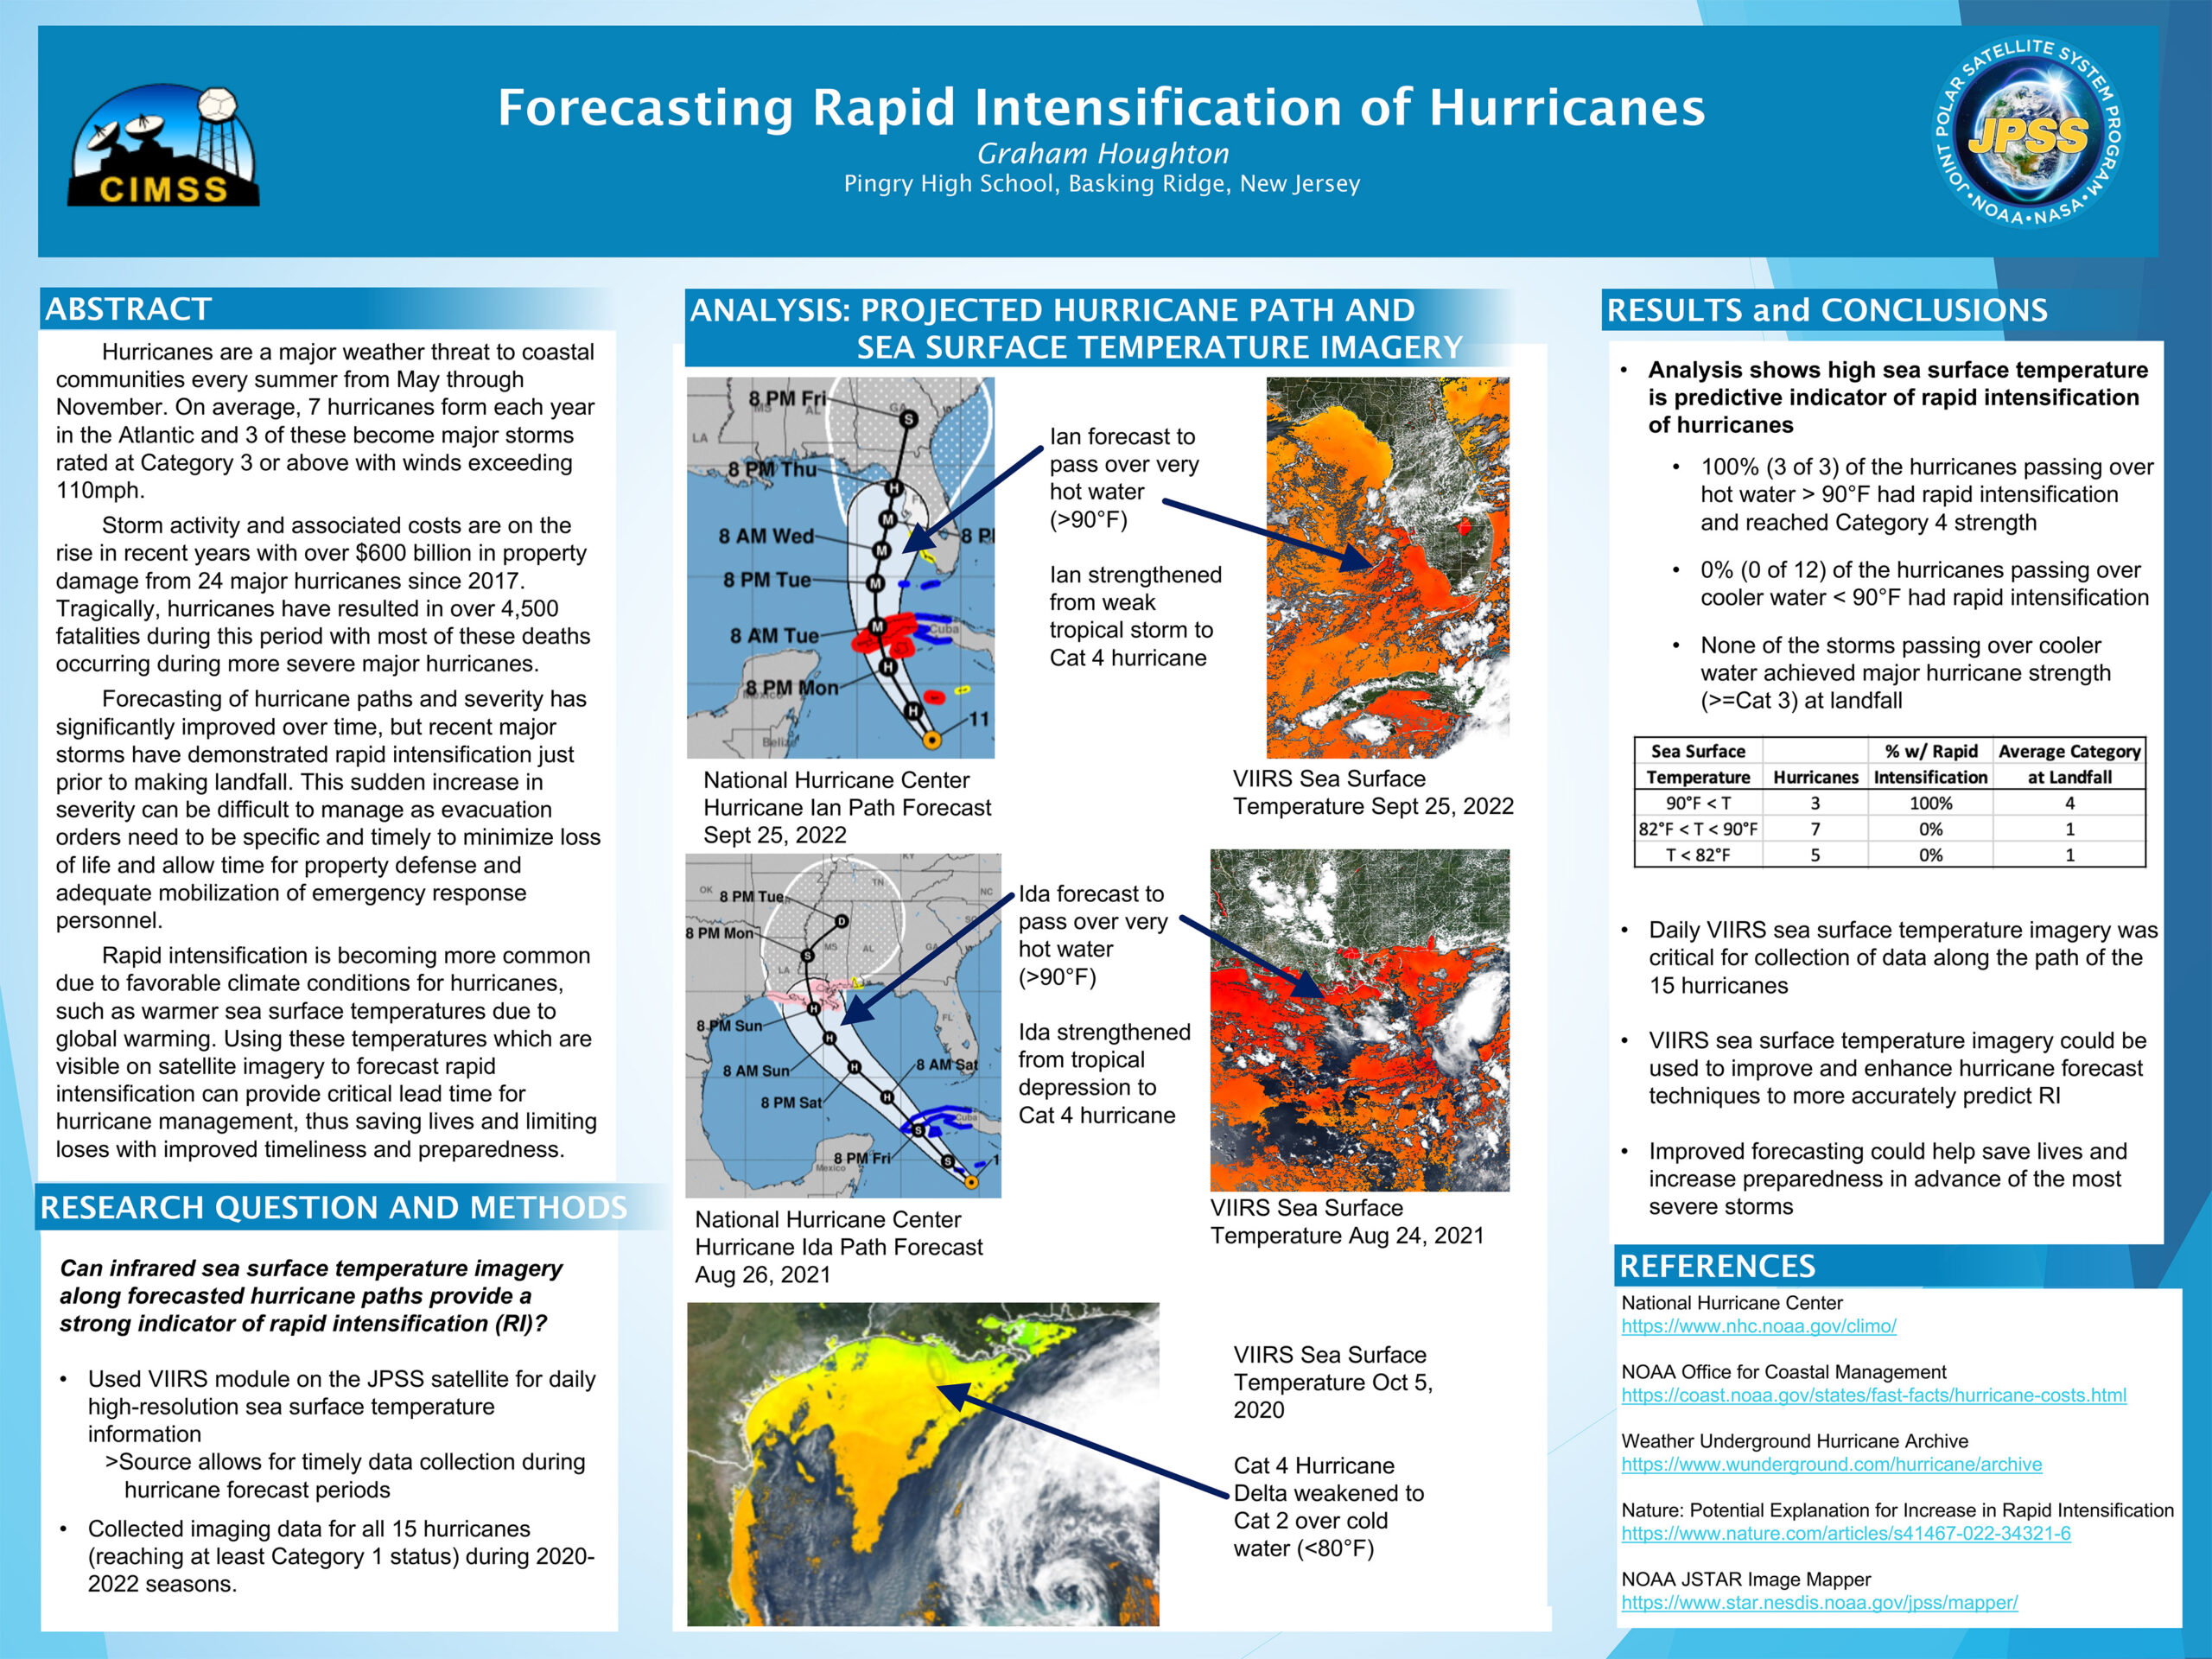
GOES-16 Shortwave Infrared (3.9 µm) images (top) and Fire Power derived product (bottom), 27-31 May [click to play animated GIF | MP4]
GOES-16
(GOES-East) Shortwave Infrared (
3.9 µm) and Fire Power derived product images during the 5-day period from
27 May –
31 May 2023 (above) showed the thermal signature of wildfires burning in far southern Nova Scotia — which forced the evacuation of 40% of the residents in the area southwest of Shelburne (near airport identifier CWOS). 3.9 µm infrared brightness temperatures occasionally reached 135ºC (not far below the 137.71ºC saturation temperature of the GOES-16
ABI Band 7 detectors), with Fire Power values exceeding 2700 MW at times (the Fire Power derived product is a component of the
Fire Detection and Characterization Algorithm). On
28 May, strong westerly winds within the warm sector of a midlatitude cyclone caused a rapid eastward expansion of the fire’s thermal signature.
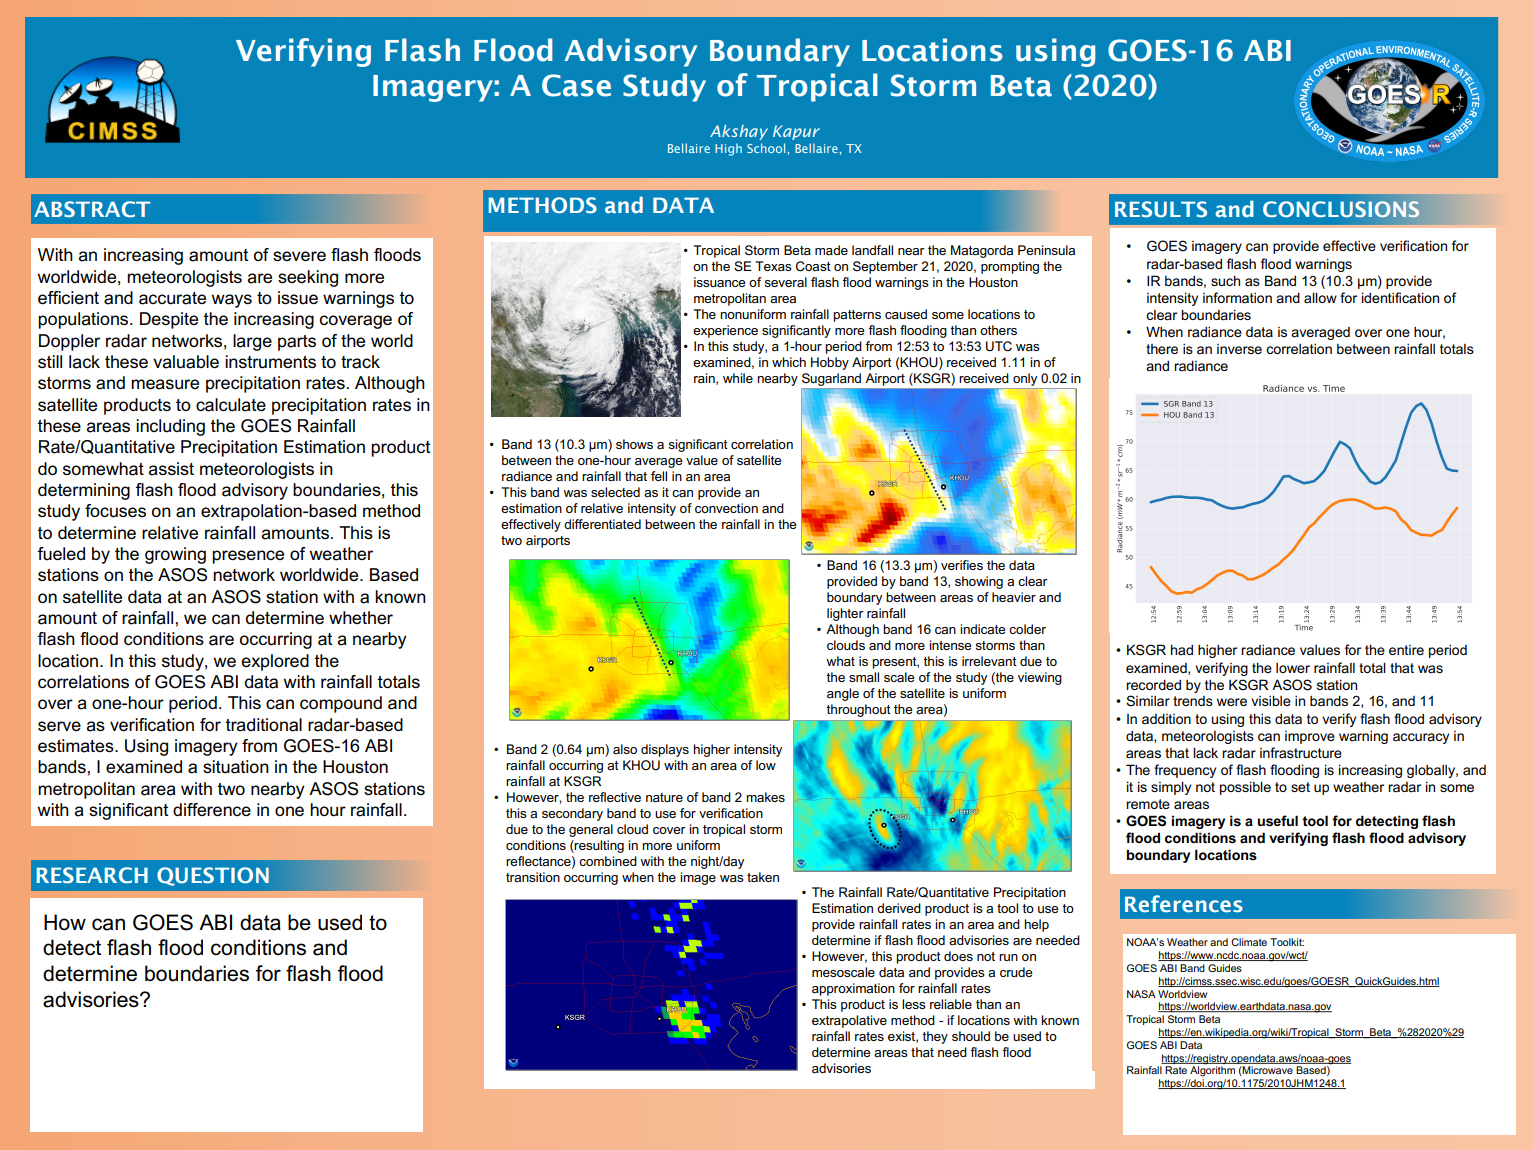
A sequence of GOES-16 True Color RGB and Nighttime Microphysics RGB images during 27-31 May from the CSPP GeoSphere site (below) showed the varying daytime smoke transport along with the fire’s nocturnal thermal anomaly (darker shades of purple) during that same 5-day period.
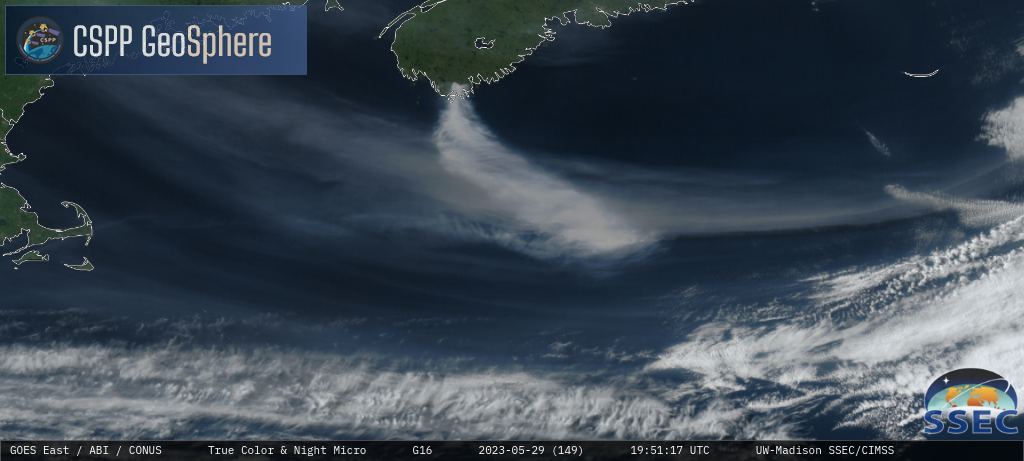
GOES-16 True Color RGB and Nighttime Microphysics RGB images, 27-31 May [click to play MP4 animation]
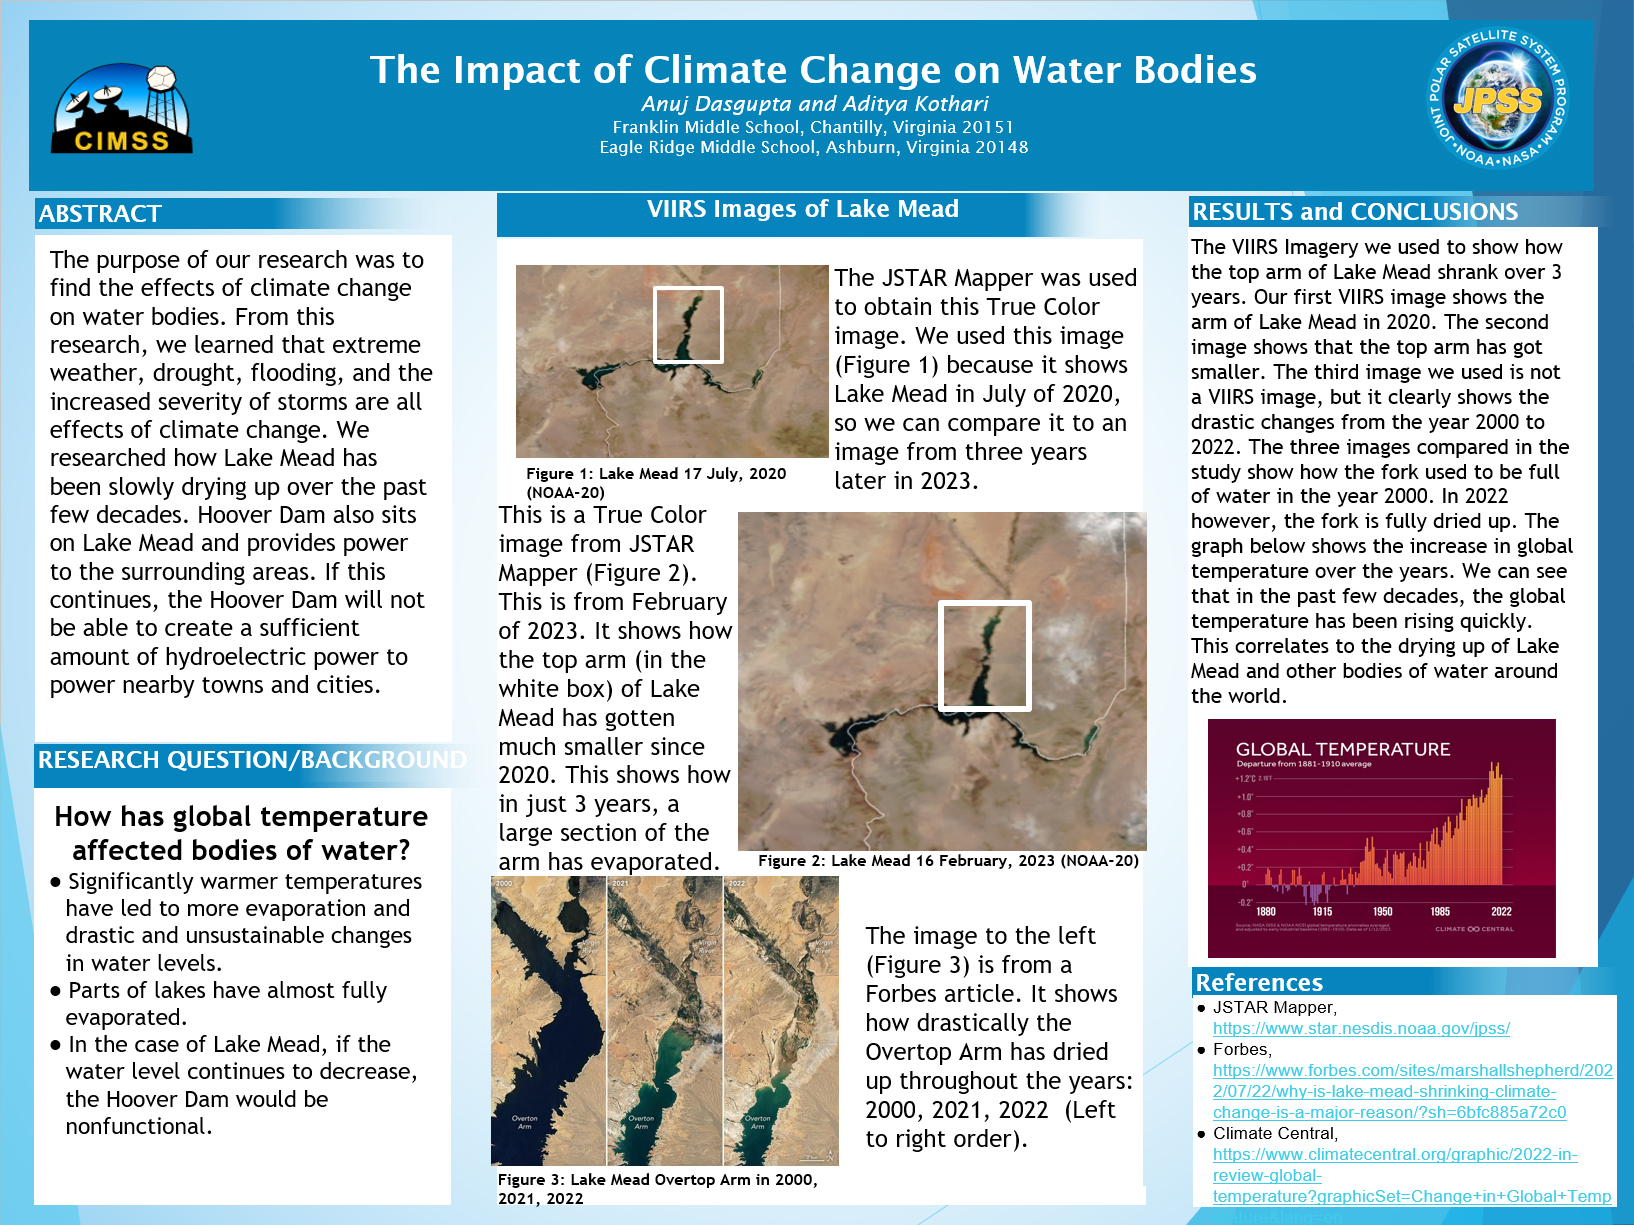
In a toggle between NOAA-20 VIIRS True Color RGB and False Color RGB images valid at 1700 UTC on 31 May
(below), individual smoke plume point sources could be seen in the True Color RGB image, while the fire burn scar (darker shades of brown) and active fires (brighter shades of pink) were evident in the False Color RGB image. VIIRS data used to create these images were downloaded and processed via the CIMSS/SSEC Direct Broadcast ground station.
NOAA-20 VIIRS True Color RGB and False Color RGB images valid at 1700 UTC on 31 May [click to enlarge]
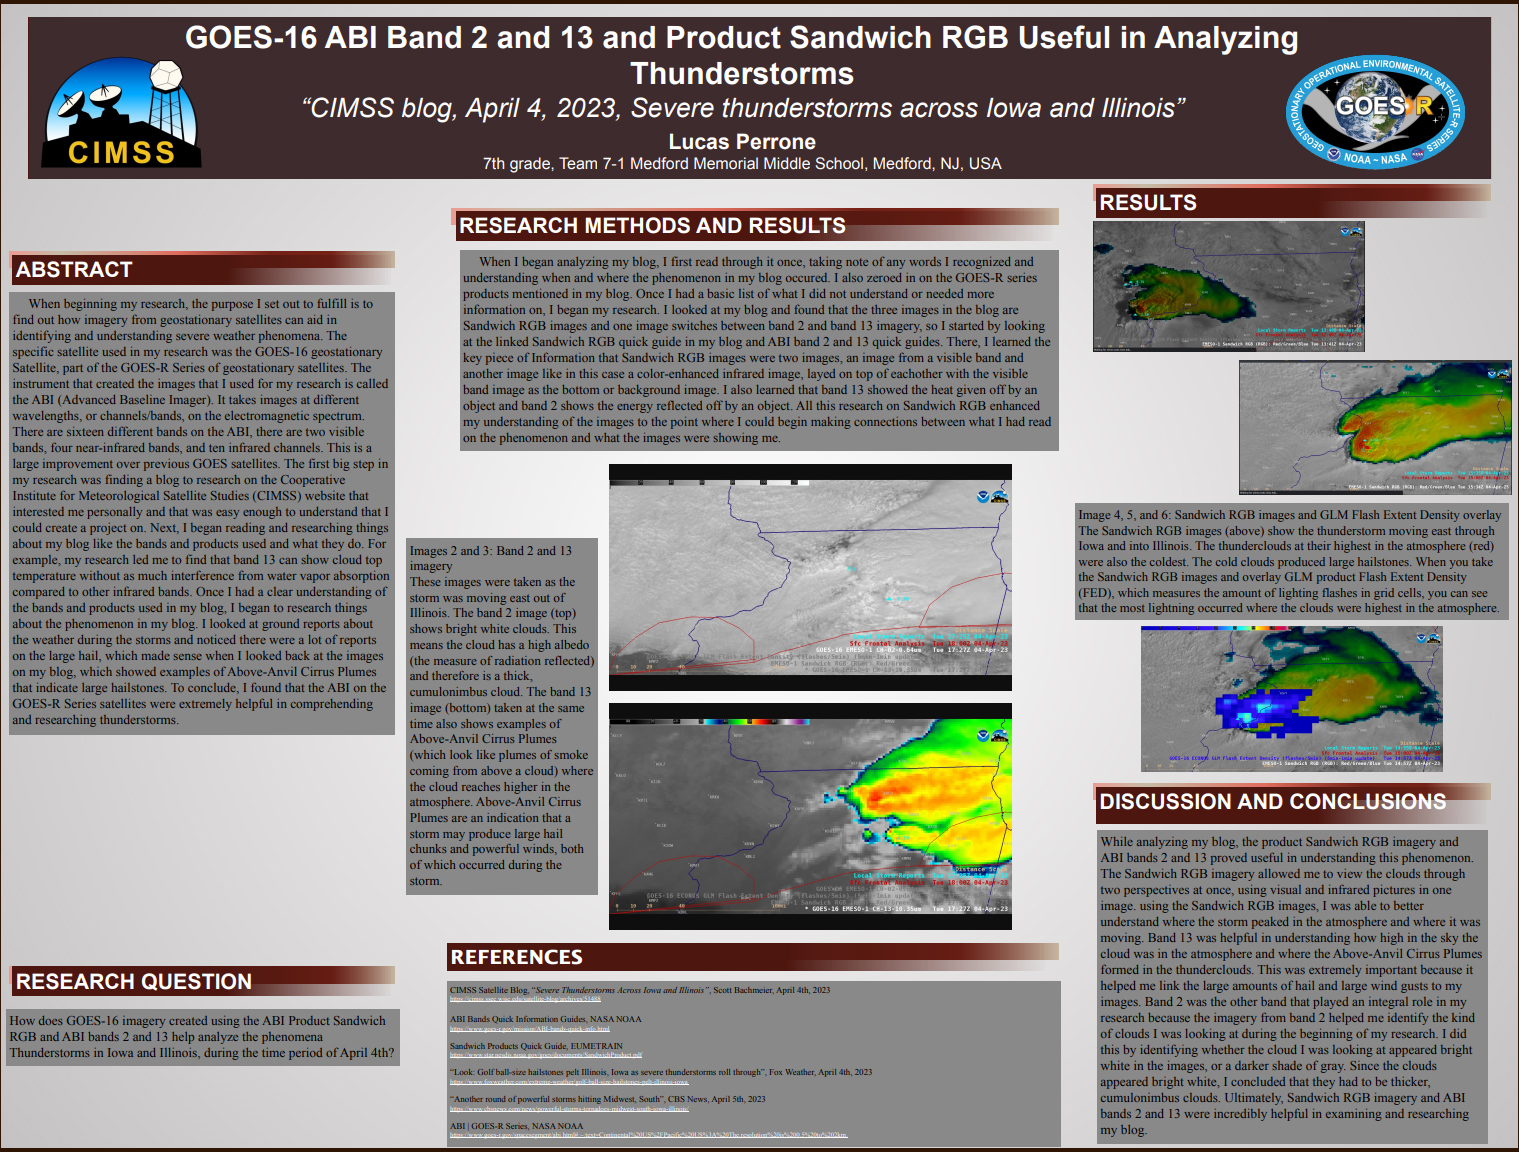
During the preceding nighttime hours, a toggle between Suomi-NPP VIIRS Day/Night Band (0.7 µm) and Shortwave Infrared (3.74 µm) images
(below) showed the nocturnal glow and thermal signature of the fires at 0626 UTC on 31 May.
Suomi-NPP VIIRS Day/Night Band (0.7 µm) and Shortwave Infrared (3.74 µm) images valid at 0626 UTC on 31 May [click to enlarge]
View only this post
Read Less


