This website works best with a newer web browser such as Chrome, Firefox, Safari or Microsoft
Edge. Internet Explorer is not supported by this website.
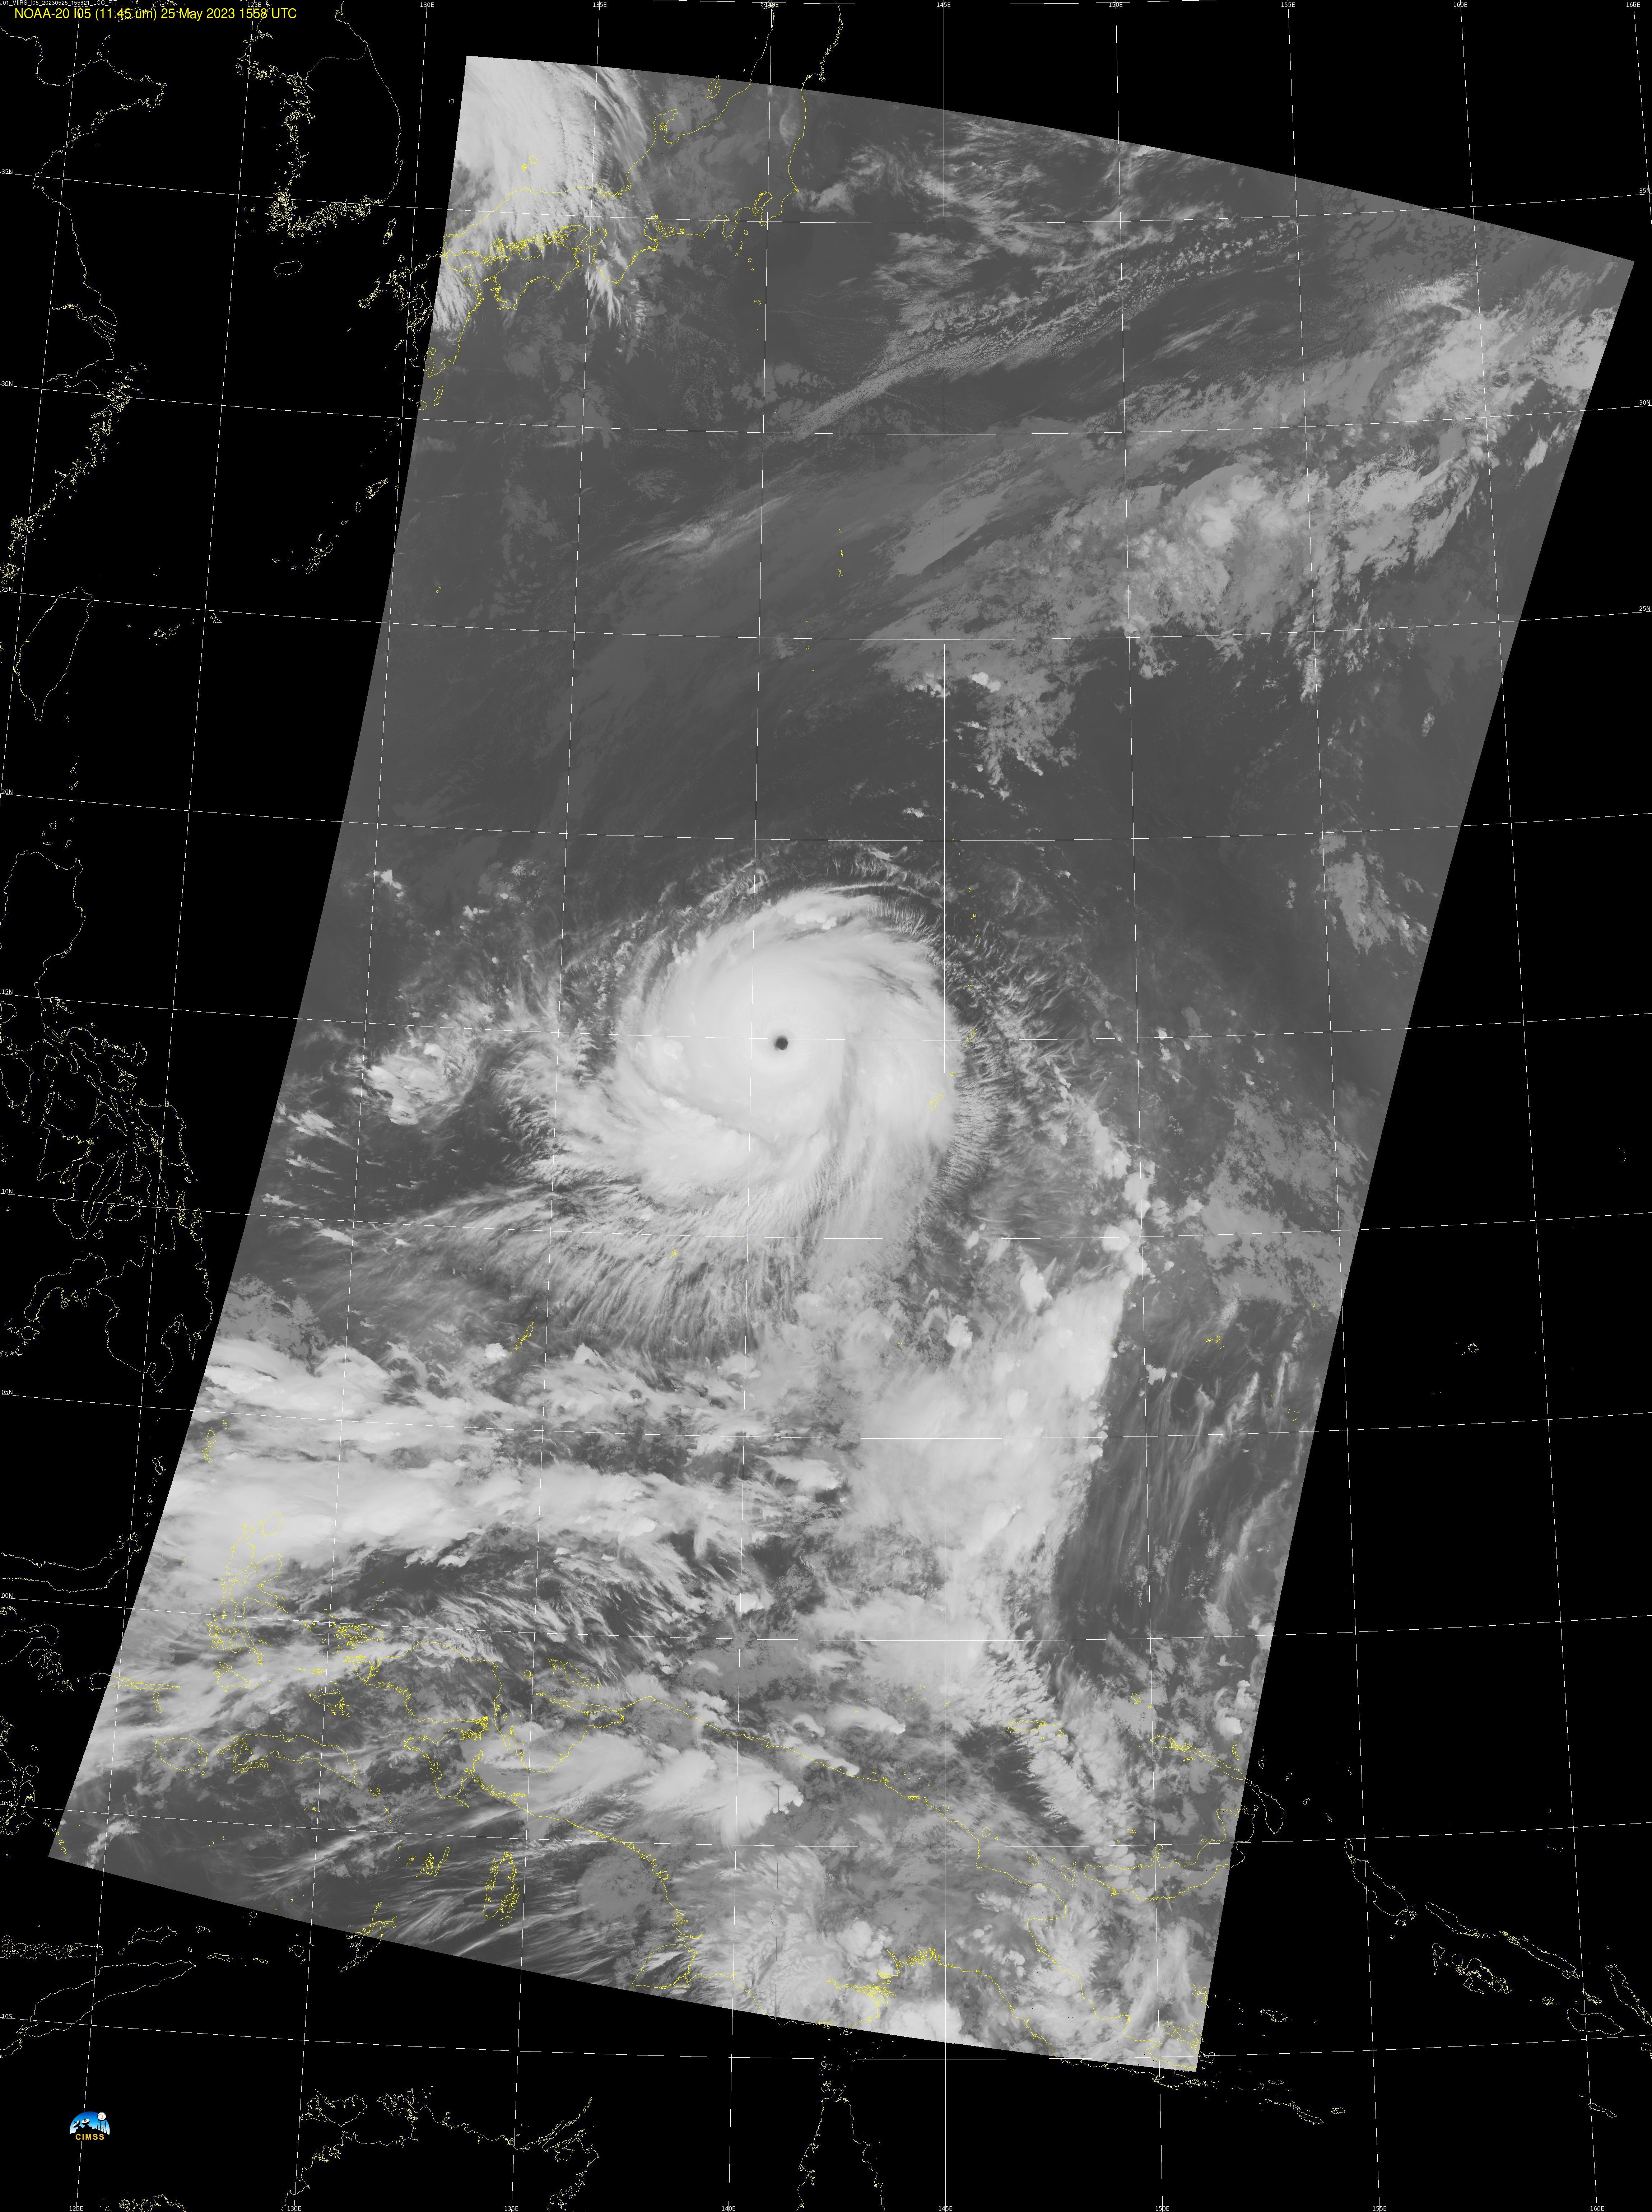
Direct Broadcast data from the antenna on Guam (processed with CSPP data) at 1558 UTC on 25 May show the structure of a very strong typhoon. Mawar at 1800 UTC was a Super Typhoon with sustained winds of 155 knots. (Blog Post). The toggle above shows I05 (11.45 µm)Read More
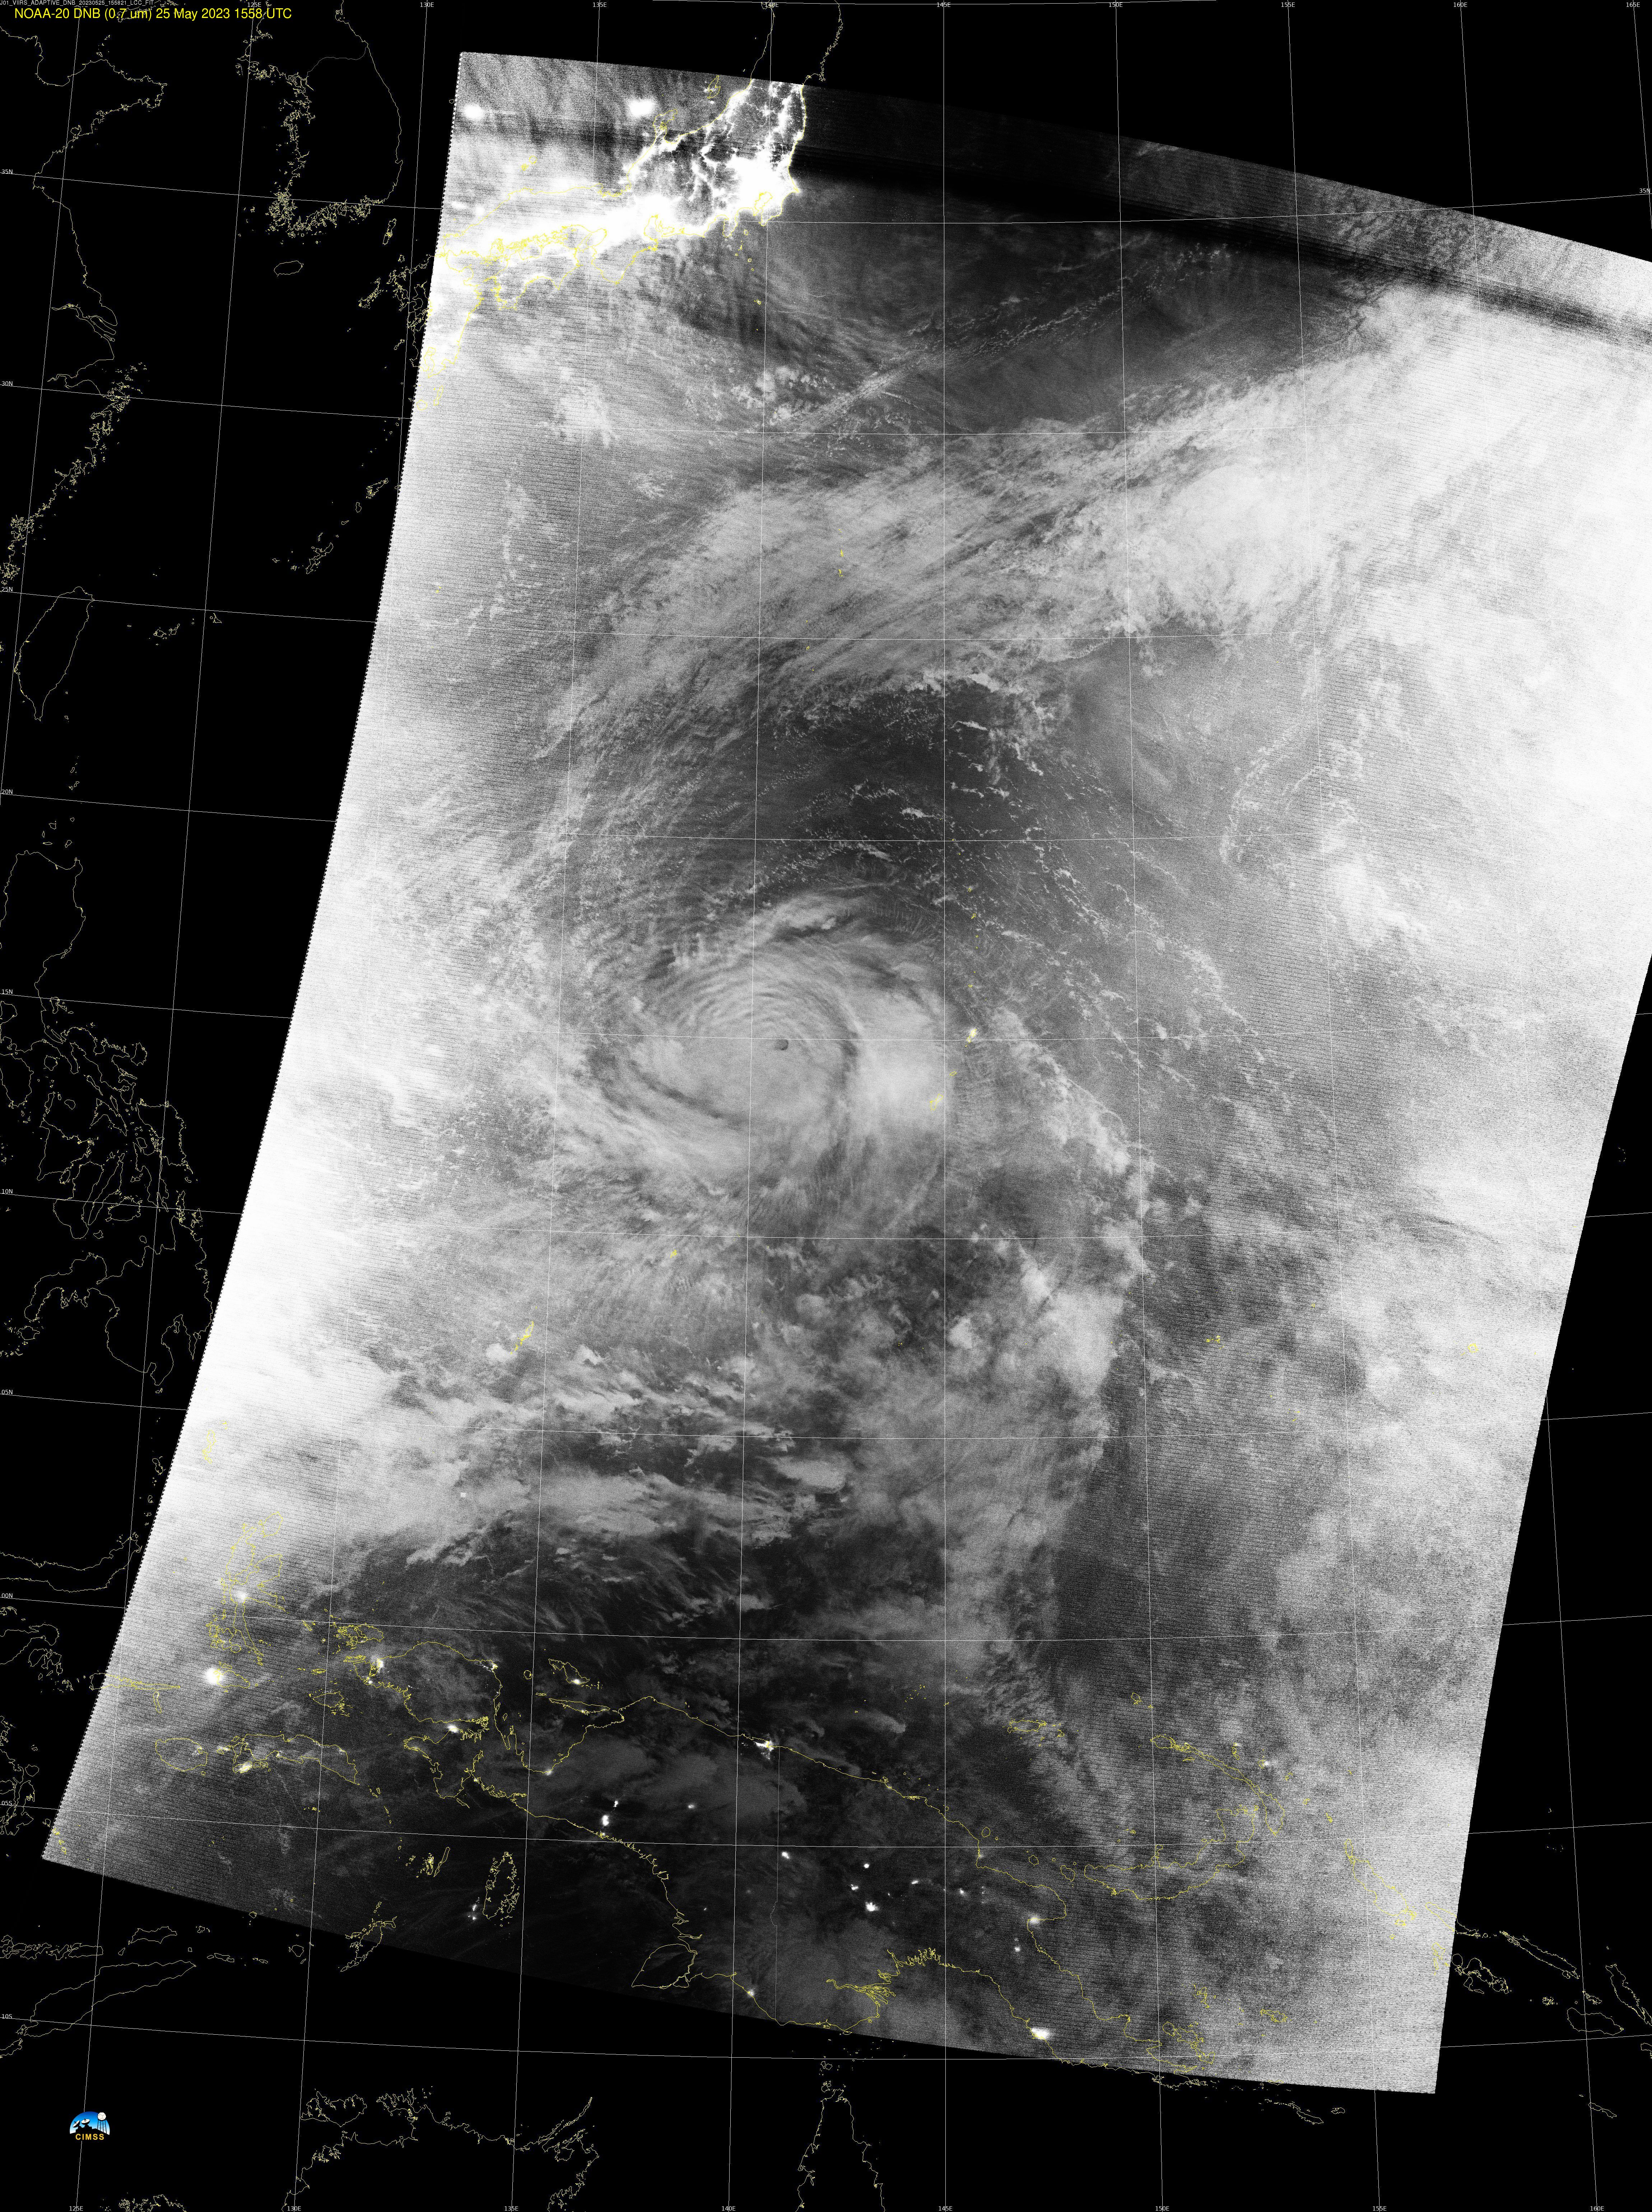
NOAA-20 Day Night Band visible (0.70 µm) and I05 infrared (11.45 µm) imagery at 1558 UTC on 25 May 2023 (Click to enlarge)
Direct Broadcast data from the antenna on Guam (processed with CSPP data) at 1558 UTC on 25 May show the structure of a very strong typhoon. Mawar at 1800 UTC was a Super Typhoon with sustained winds of 155 knots. (Blog Post). The toggle above shows I05 (11.45 µm)and Day Night Band visible (0.70 µm) imagery. There are (again) indications of mesospheric gravity waves in the Day Night Band imagery (i.e., concentric light/dark bands surrounding the storm, especially west and north of the storm). The 11.45 infrared imagery shows a very warm eye. In both images, the symmetric nature of the storm is apparent, and strong convection in the outer bands.
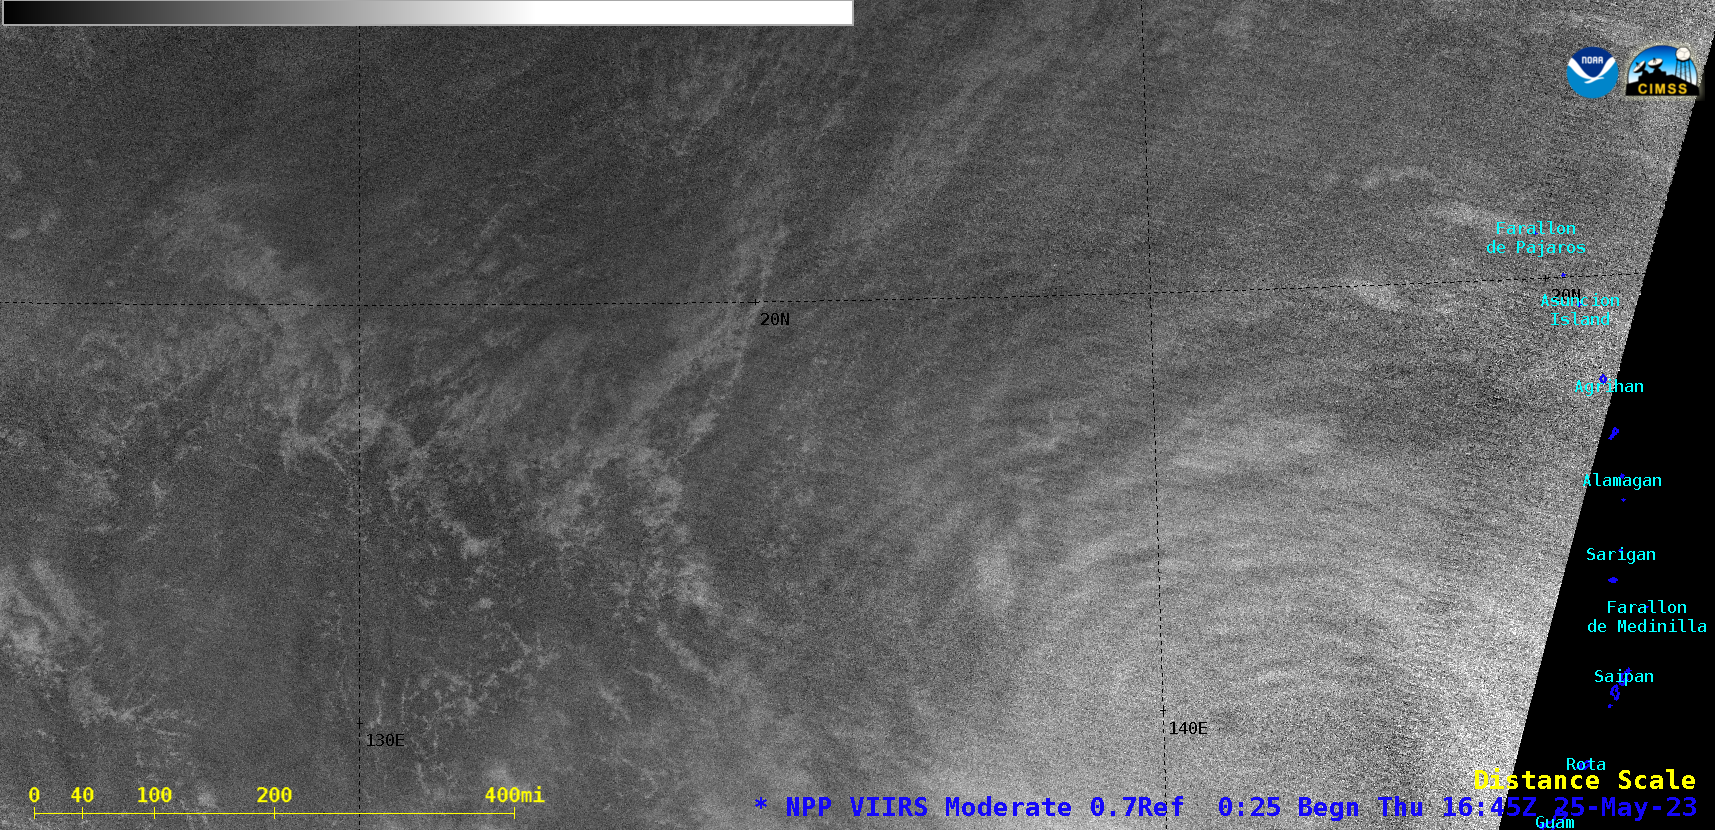
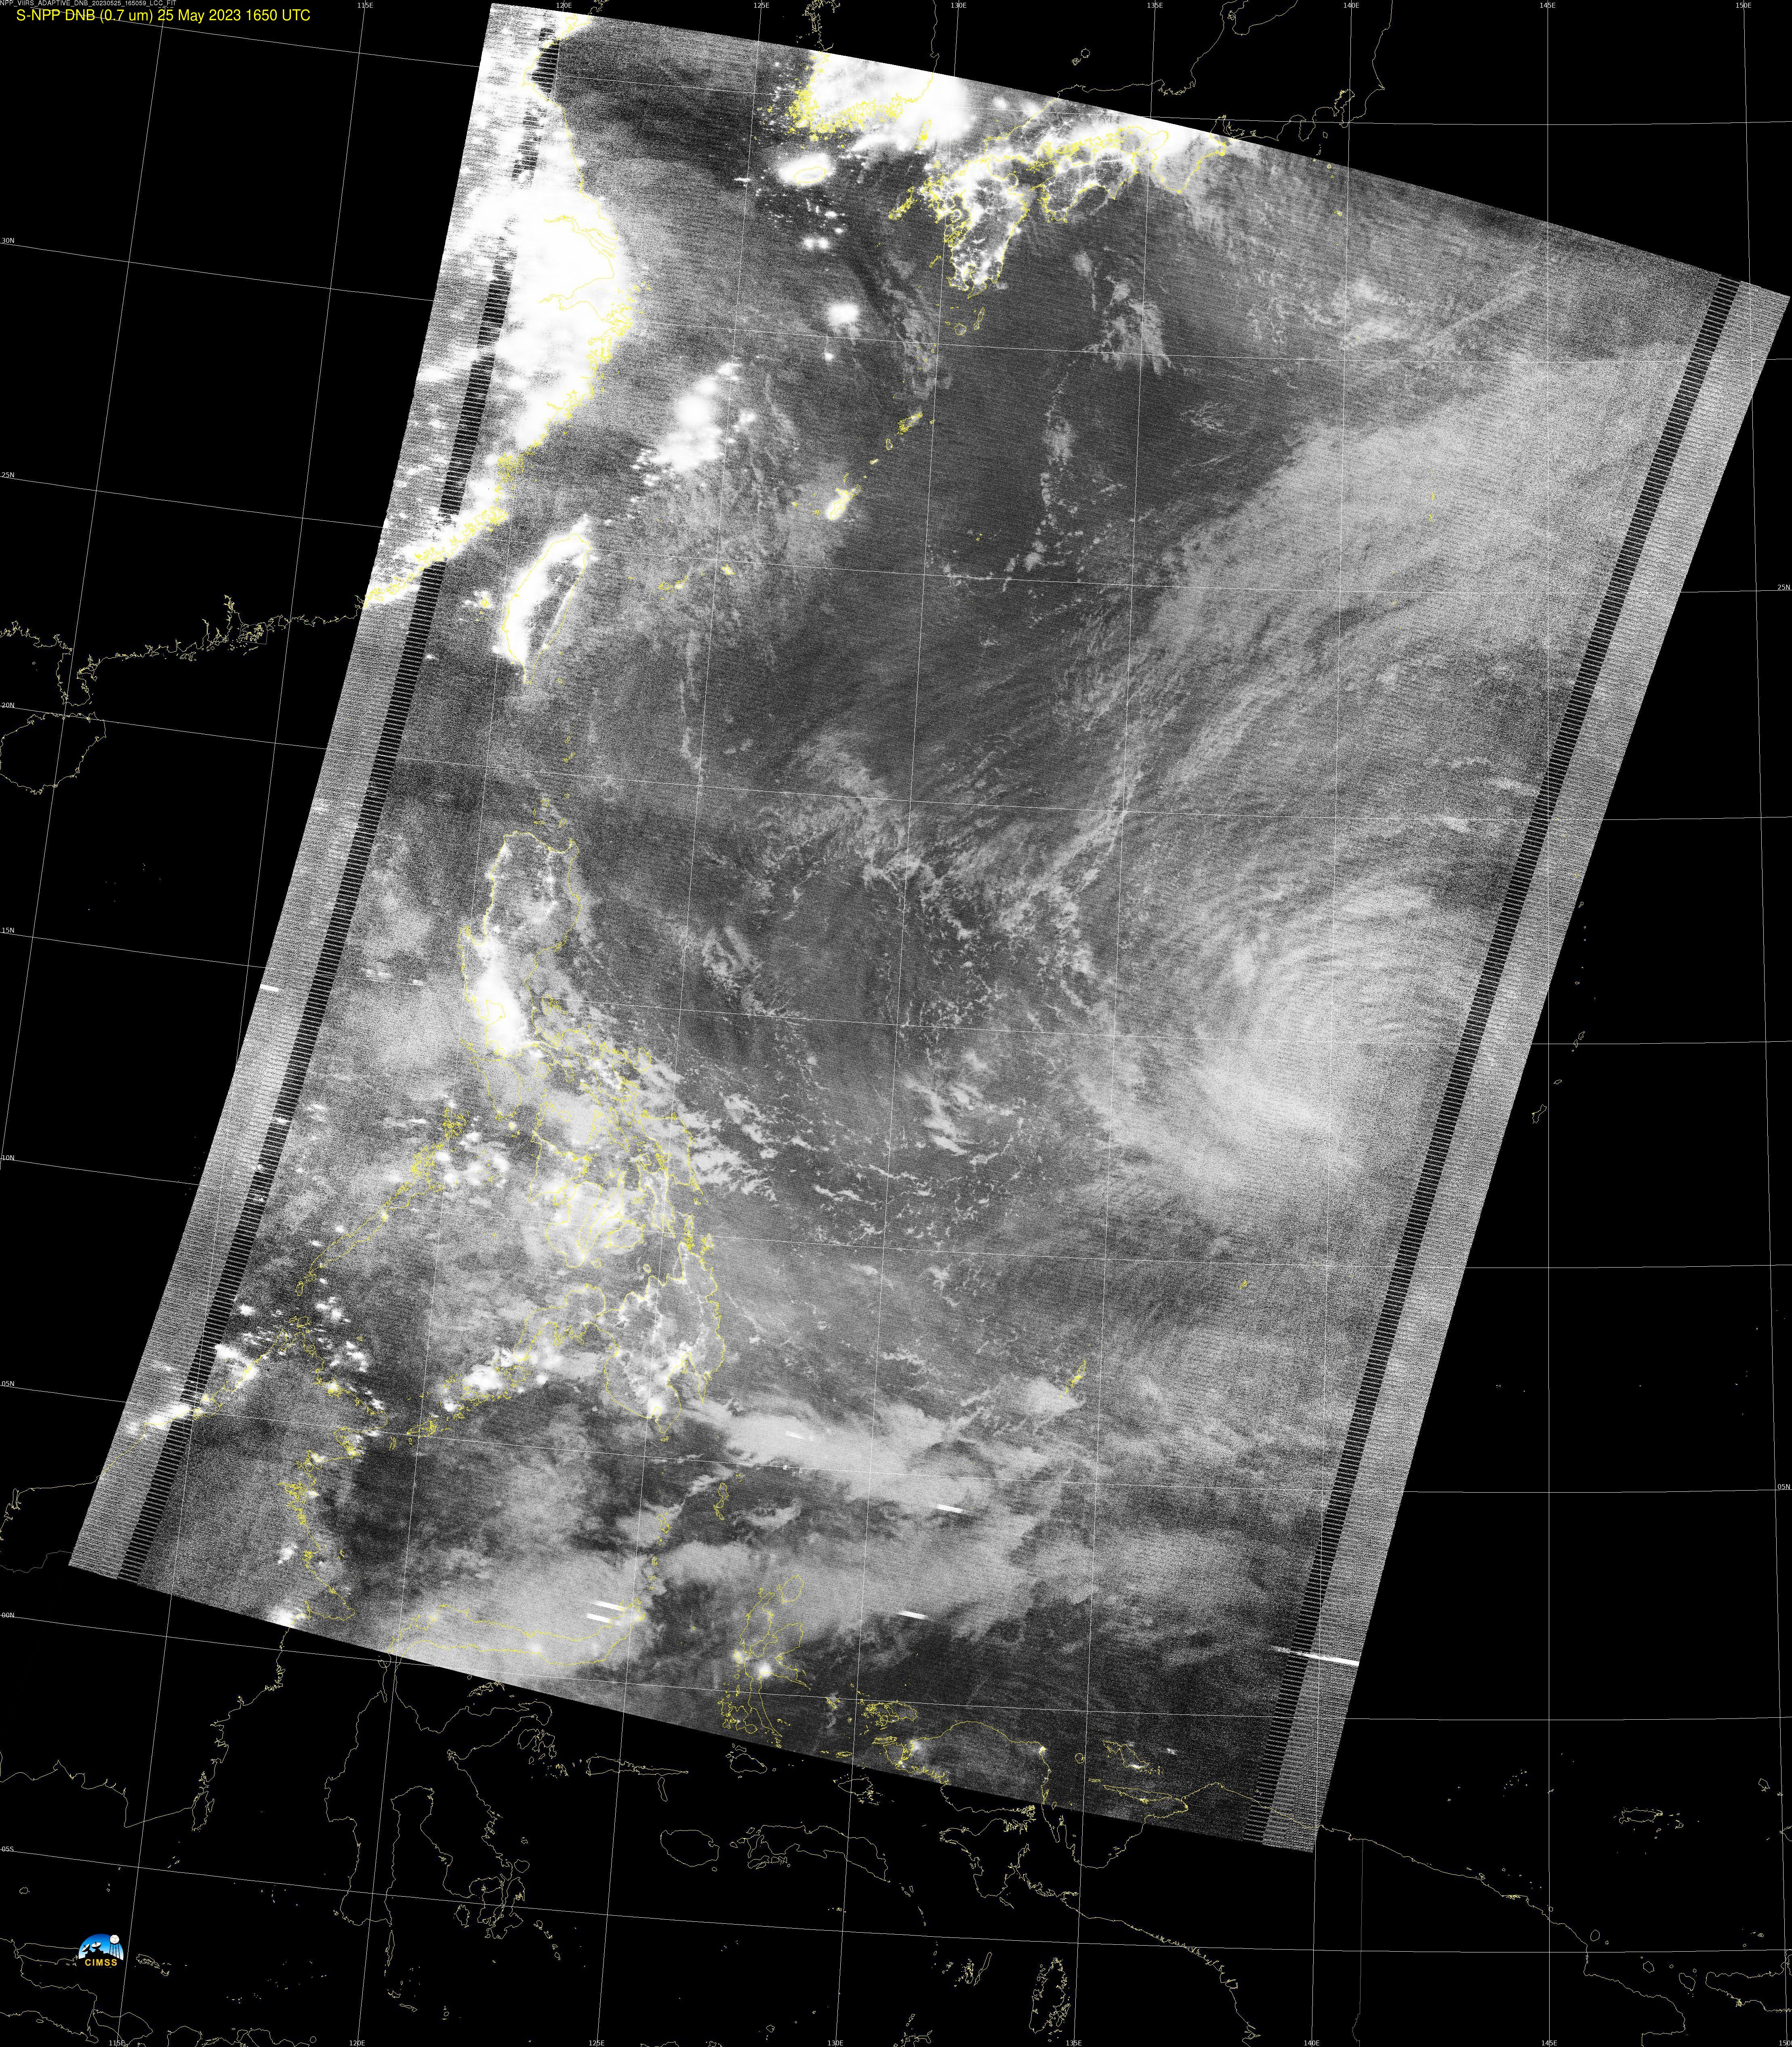
At 1650 UTC, Suomi NPP provided I05 and Day Night Band data, shown below. The Mesospheric Gravity Waves are perhaps more noteable in the Suomi NPP Day Night imagery.
Suomi-NPP Day Night Band visible (0.70 µm) and I05 infrared (11.45 µm) imagery at 1650 UTC on 25 May 2023 (Click to enlarge)
Thanks to Douglas Schumacher, SSEC/CIMSS, for the imagery!
Target Sector (2.5-minute interval) JMA Himawari-9 Visible and Infrared images (above) covered the period +/- 2 hours when Super Typhoon Mawar reached Category 5 intensity at 0600 UTC on 25 May 2023. Mesovortices within the eye were evident in Visible imagery, with the eye exhibiting a “stadium effect” geometry (two signatures that are often associated with... Read More
JMA Himawari-9 “Red” Visible (0.64 µm, top) and “Clean” Infrared Window (10.4 µm, bottom) images [click to play animated GIF | MP4]
Target Sector (2.5-minute interval) JMA Himawari-9 Visible and Infrared images (above) covered the period +/- 2 hours when Super Typhoon Mawar reached Category 5 intensity at 0600 UTC on 25 May 2023. Mesovortices within the eye were evident in Visible imagery, with the eye exhibiting a “stadium effect” geometry (two signatures that are often associated with intense tropical cyclones).
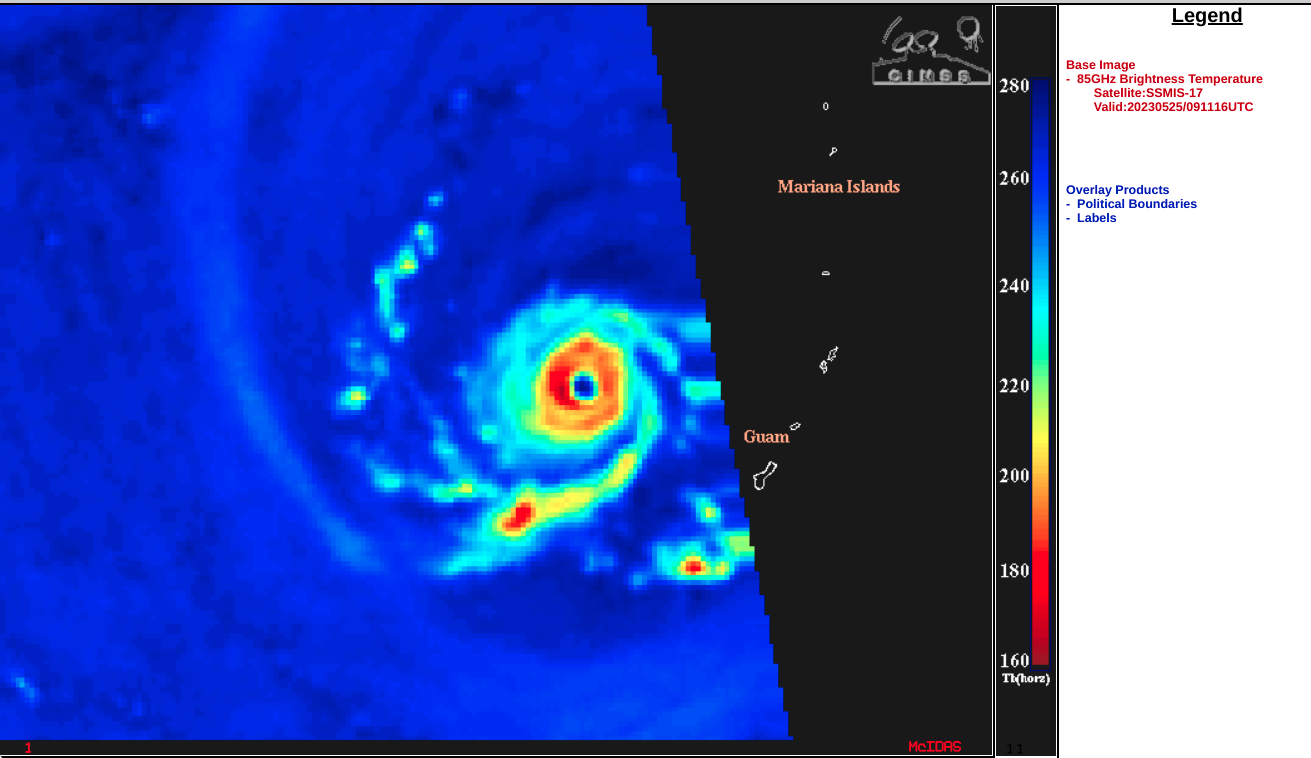
DMSP-17 SSMIS Microwave (85 GHz) image at 0911 UTC [click to enlarge]
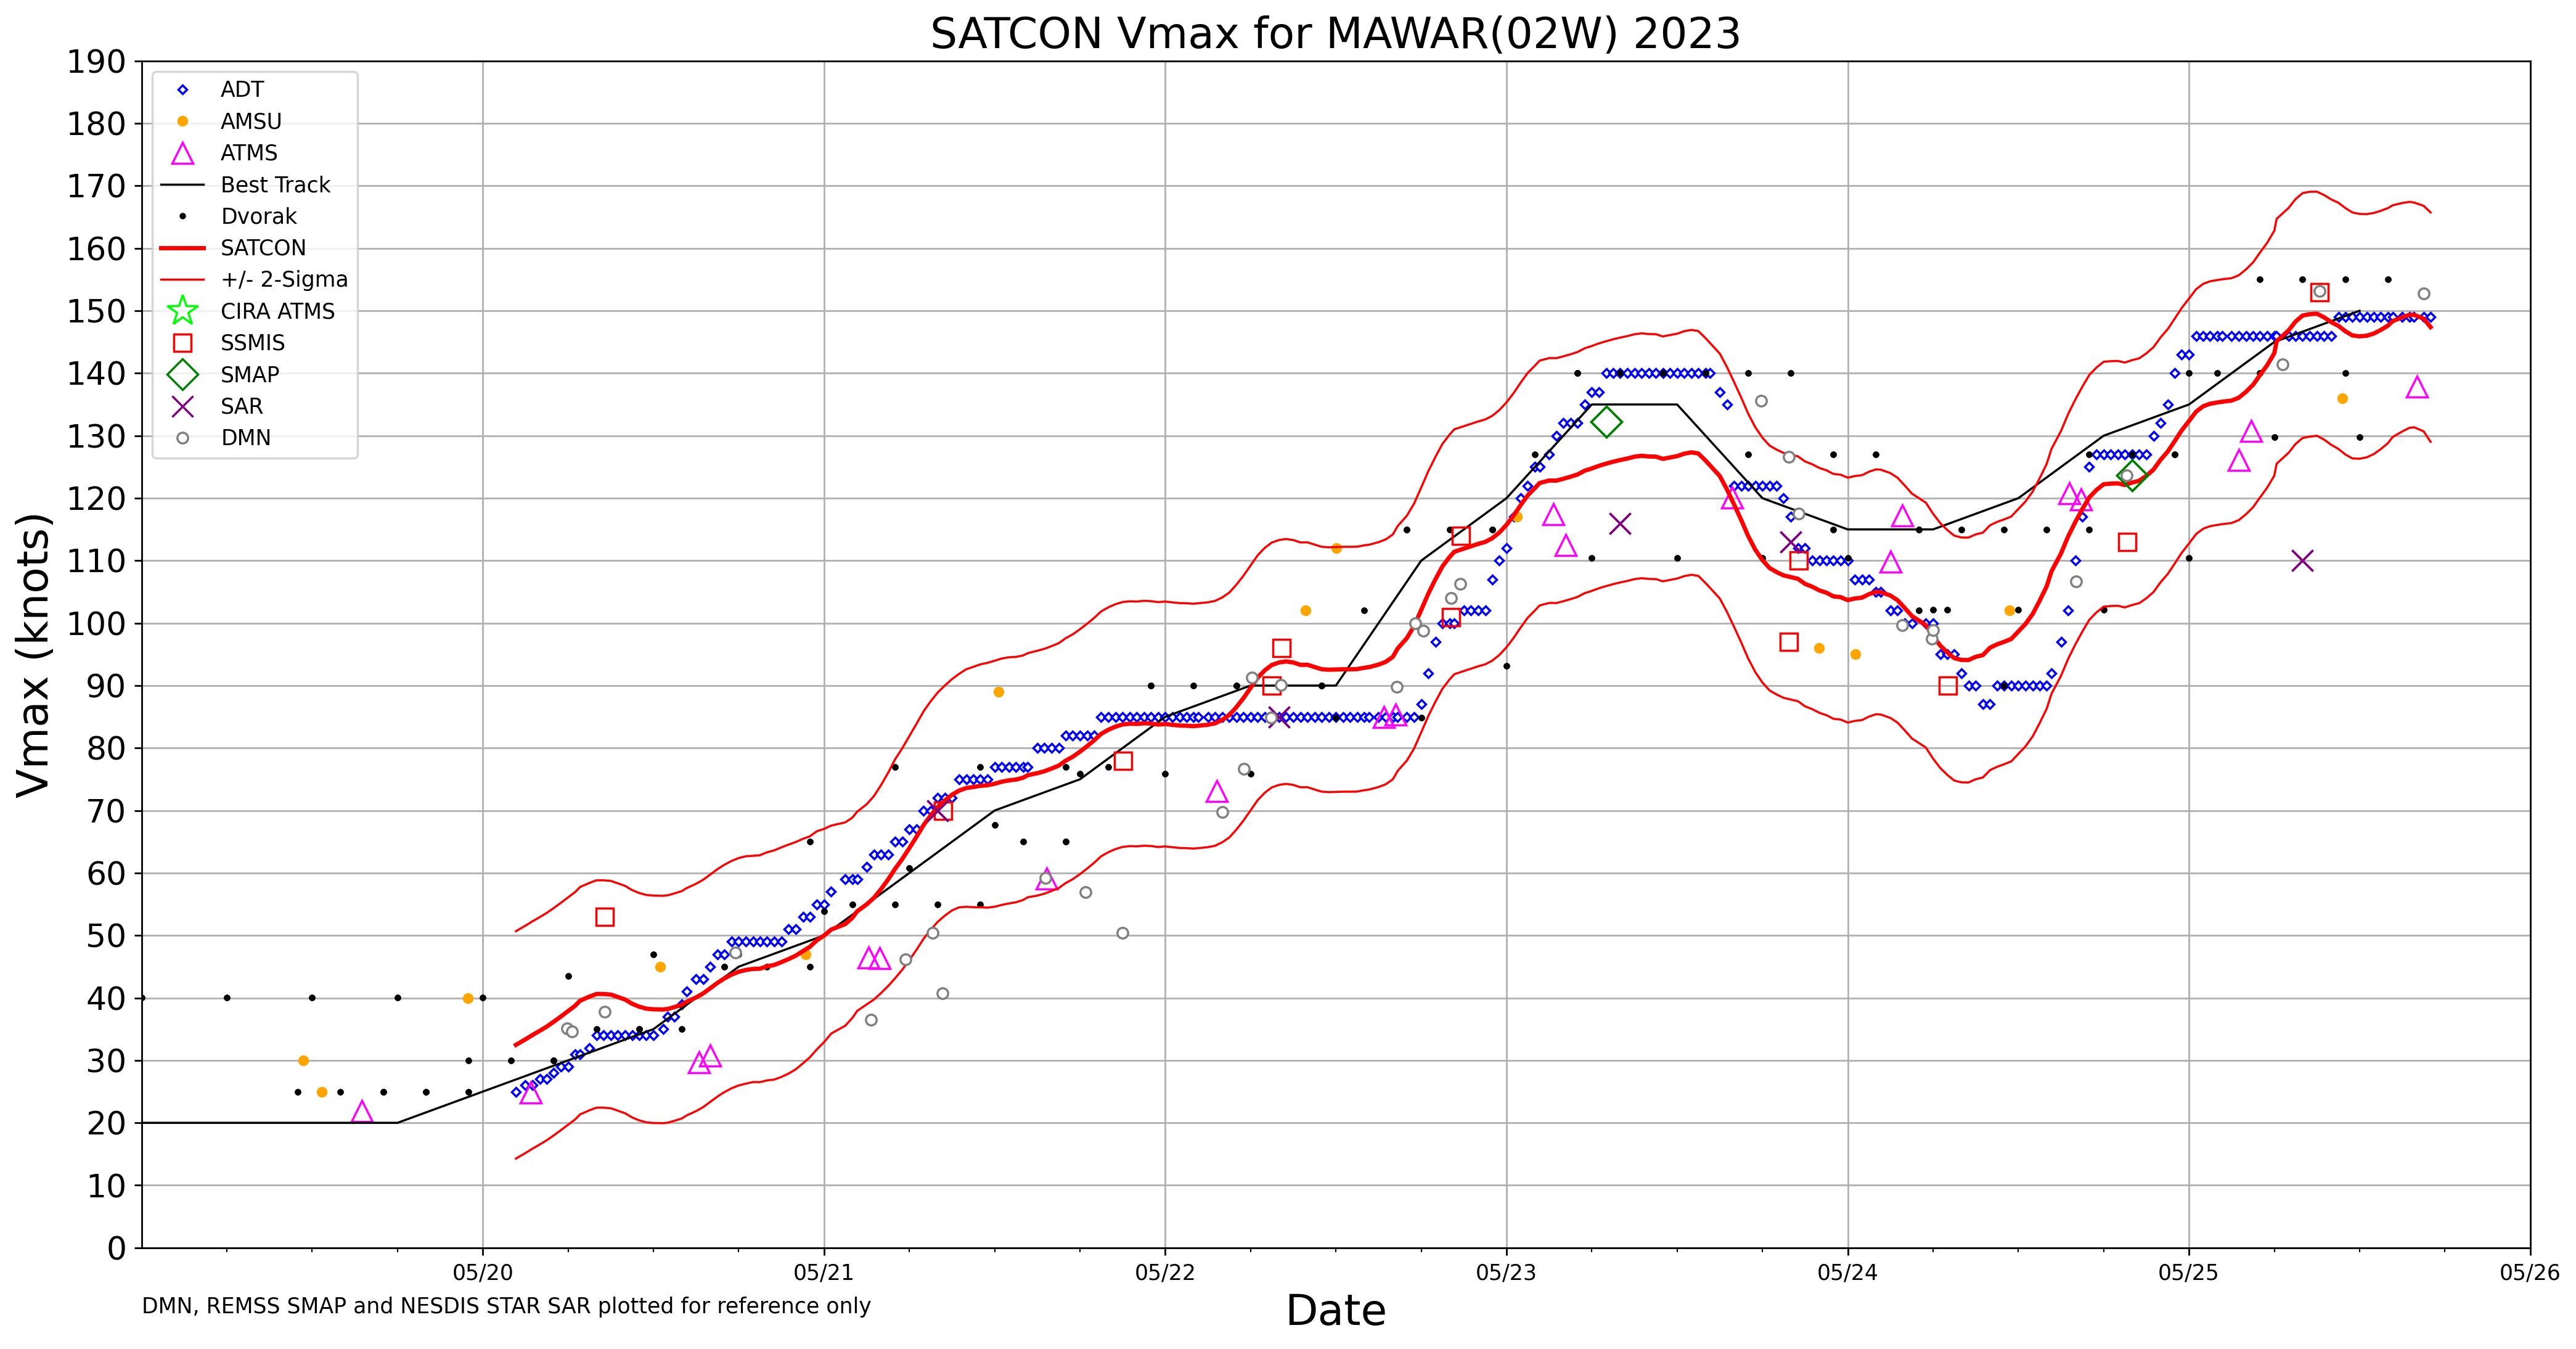
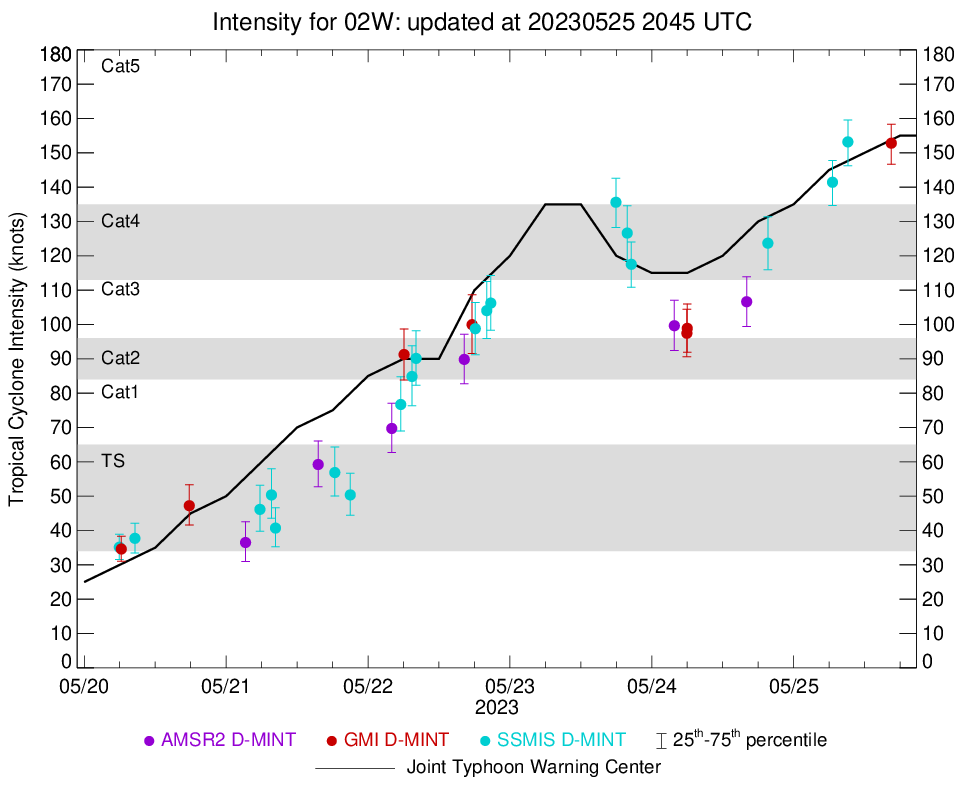
A DMSP-17 SSMIS Microwave (85 GHz) image at 0911 UTC from the CIMSS Tropical Cyclones site (above) showed Mawar to the west of Guam, with a well-defined, completely closed eyewall along with a spiral band wrapping into the storm center from the south. Later in the day, Mawar further intensified to 155 knots at 1800 UTC (JTWC advisory | ADT | SATCON | D-MINT | D-PRINT) — and a DMSP-18 SSMIS Microwave image at 1905 UTC (below) revealed a distinct pair of spiral bands.
DMSP-18 SSMIS Microwave (85 GHz) image at 1905 UTC [click to enlarge]
As also mentioned in this blog post, a Suomi-NPP VIIRS Day/Night Band (0.7 µm) image valid at 1655 UTC(below) revealed mesospheric airglow waves (reference) radiating hundreds of miles northward through westward away from Mawar — these vertically-propagating gravity waves were generated by deep convection within Mawar’s eyewall.
Suomi-NPP VIIRS Day/Night Band (0.7 µm) image, valid at 1655 UTC on 25 May [click to enlarge]
A long animation of Himawari-9 “Clean” Infrared Window (10.4 µm) images (below) showed that the eye of Mawar exhibited a small amount of trochoidal motion during the day.
JMA Himawari-9 “Clean” Infrared Window (10.4 µm) images [click to play animated GIF | MP4]
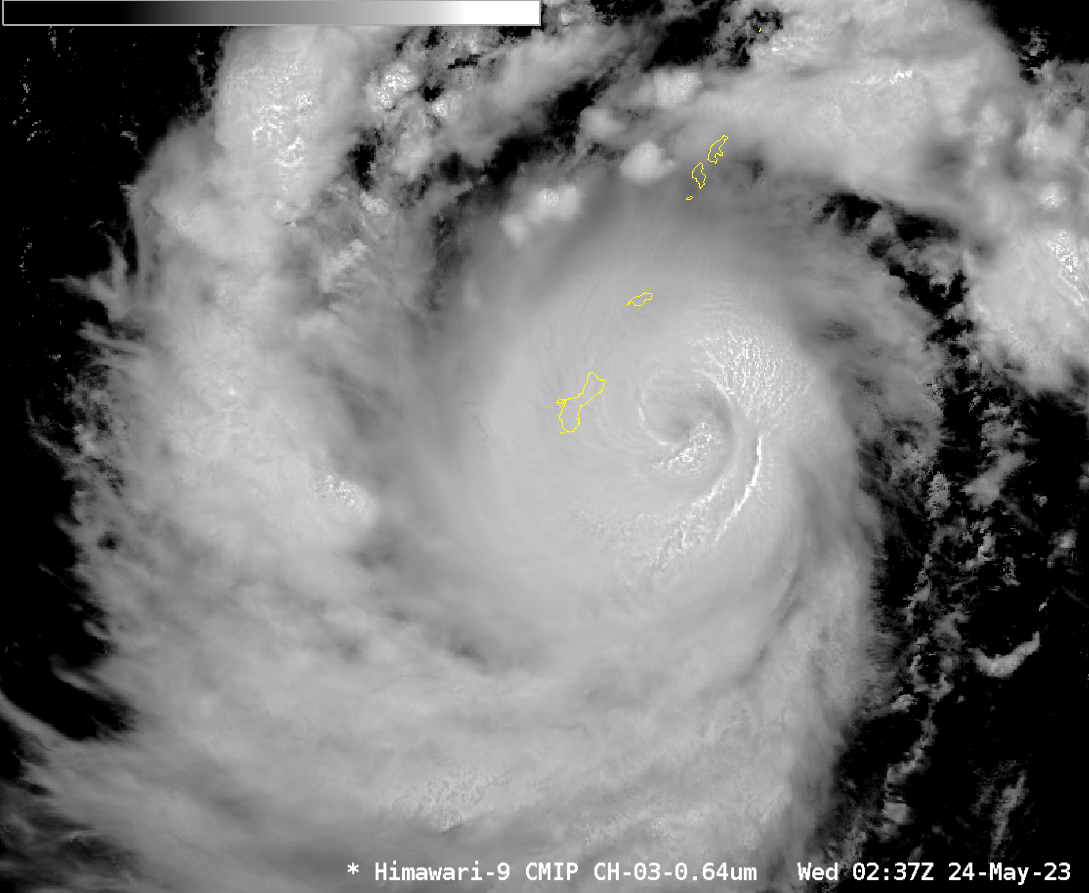
Typhoon Mawar wobbled north during the day on 24 May and moved through the Rota channel between the islands of Guam to the south and Rota to the north, as shown in the animation of Himawari-9 Target Sector Band 3 (Visible, 0.64 µm) imagery above. The track path from the... Read More
Himawari-9 Visible imagery (Band 3, 0.64 µm), 2102 UTC 23 May 2023 through 0820 UTC 24 May 2023
Typhoon Mawar wobbled north during the day on 24 May and moved through the Rota channel between the islands of Guam to the south and Rota to the north, as shown in the animation of Himawari-9 Target Sector Band 3 (Visible, 0.64 µm) imagery above. The track path from the Joint Typhoon Warning Center, below, shows the 0900 UTC position just north of Ritidian Point on Guam. Typhoon conditions are widespread over Guam however with widespread heavy rain, winds and lightning.
Mawar’s path approaching Guam and through the Rota Channel. Source: JTWC (Click to enlarge)
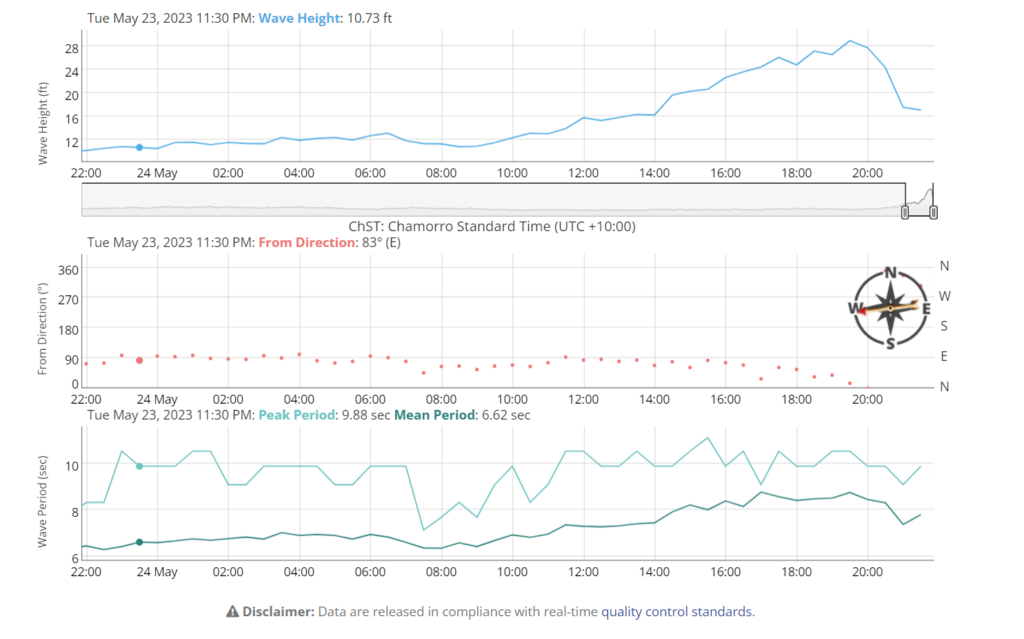
Waves at the Ritidian Buoy exceeded 28 feet in height!
Time series of wave information at Ritidian Buoy, times in CHST
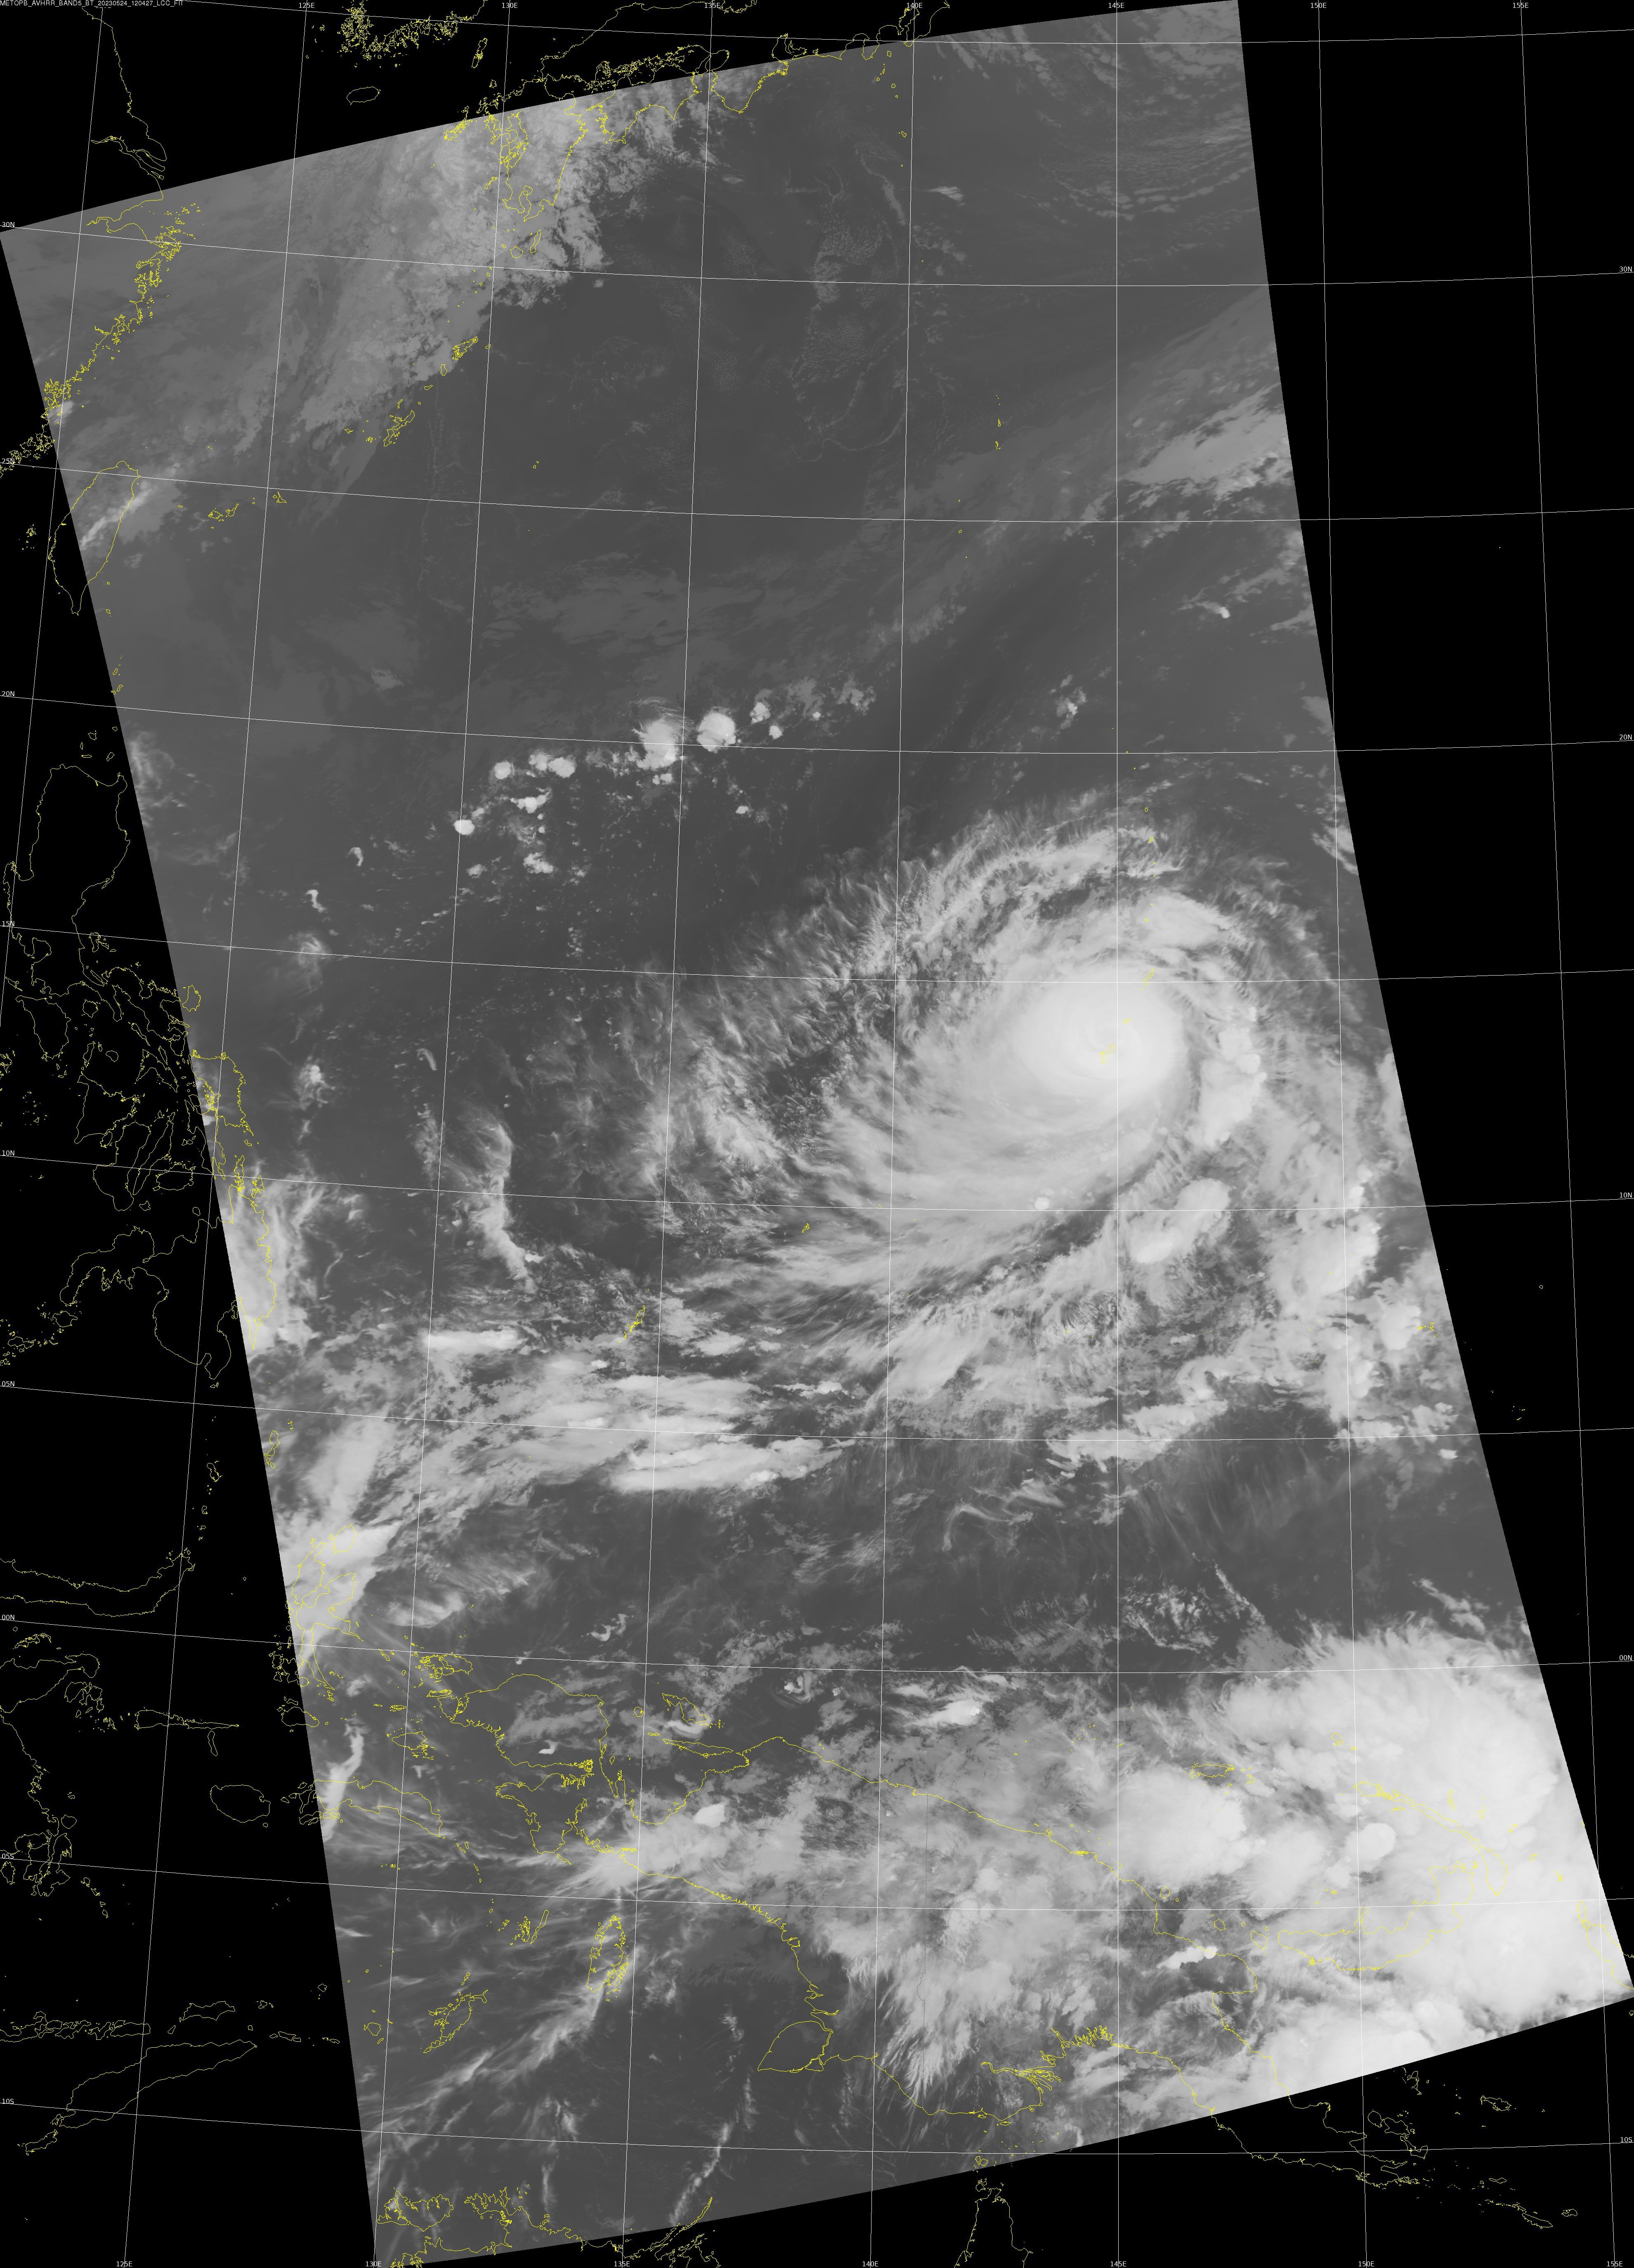
There is a Direct Broadcast antenna at the forecast office in Guam, and it collected imagery during the storm. The image below, from MetopB, shows 12 µm brightness temperatures at 1205 UTC on 24 May 2023. At this time, typhoon winds continued to affect the island although the center of the eye was
MetopB AVHRR imagery (Band 5, 12.0 µm) at 1205 UTC on 24 May 2023 (click to enlarge)
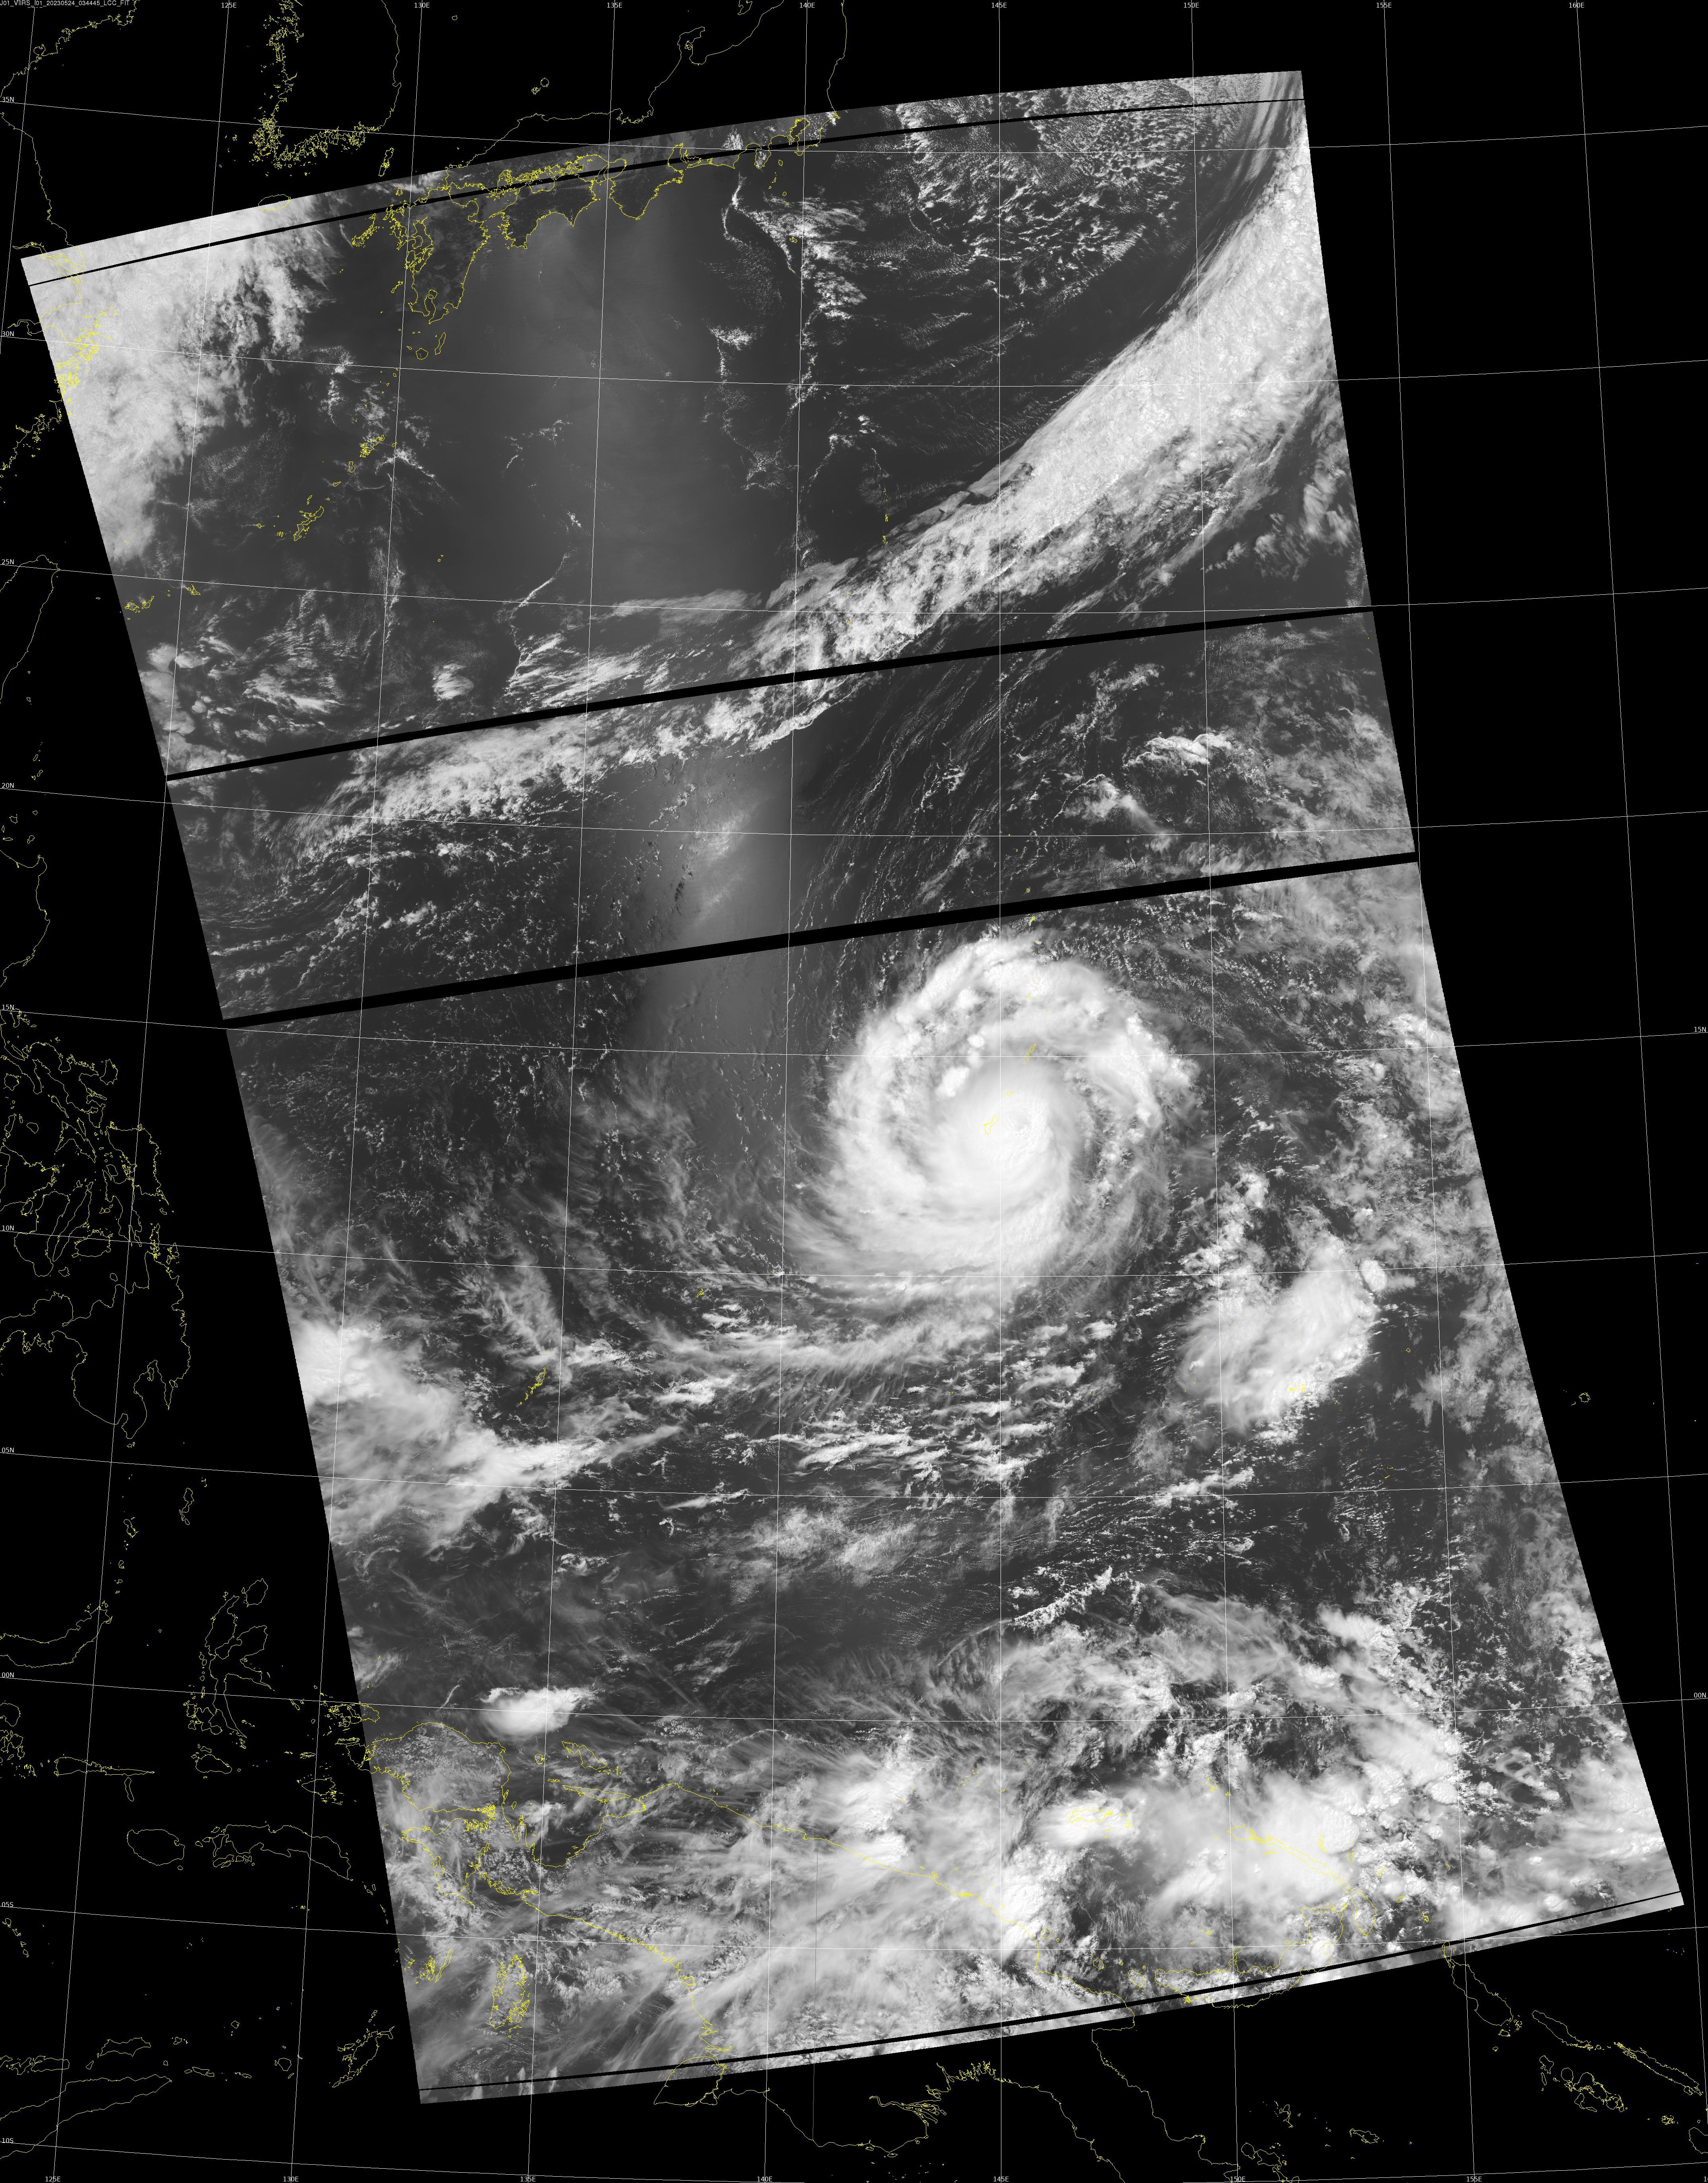
NOAA-20 overflew the storm shortly after 0300 UTC on 24 May 2023, and the Day Night band imagery from that pass is shown below. At that time, the storm was still east of Guam.
NOAA-20 Day Night Band visible imagery (0.7 µm), 0344 UTC on 24 May 2023 (Click to enlarge)
From a NOAA Email: The first in-person Satellite Proving Ground experiment at the Hazardous Weather Testbed (HWT) in Norman OK since 2019 is underway! We have 7 NWS forecasters helping to evaluate 5 products that involve satellite data, focusing specifically on severe storms and their environment. One of the products... Read More
From a NOAA Email: The first in-person Satellite Proving Ground experiment at the Hazardous Weather Testbed (HWT) in Norman OK since 2019 is underway! We have 7 NWS forecasters helping to evaluate 5 products that involve satellite data, focusing specifically on severe storms and their environment. One of the products being evaluated is output from a model that has been initialized with assimilated Polar Hyperspectral Soundings (both infrared and microwave) from NOAA-20 and NOAA-21 and from MetopB and MetopC. Forecaster-developed blog posts on the various products, including PHSnMWnABI model output (PHS for short) can be found at this site: https://goesrhwt.blogspot.com. Model output for HWT is within AWIPS, but it is also available online here.
Consider the GOES-16 Clean Window Infrared (Band 13, 10.3 µm) image below from 2200 UTC on 23 May 2023 (the color bar has been altered from the default; the coldest cloud top temperature is -80oC rather than the default -109oC). The strongest convection is over eastern New Mexico, but scattered convection is occurring throughout the state, and it also spreads into west Texas.
GOES-16 Clean Window Infrared (10.3 µm) imagery, 2201 UTC on 23 May 2023 with 2200 UTC MRMS Composite Reflectivity (Click to enlarge)
Three-hour forecasts from the 1900 UTC model run are designed to alert a forecaster to regions where significant weather might occur. That is, it is a short-range situational awareness tool. Because of the addition of temperature and moisture information from the Polar Orbiters (likely MetopB/MetopC for this time), a more accurate initialization is likely. What kind of information can be viewed?
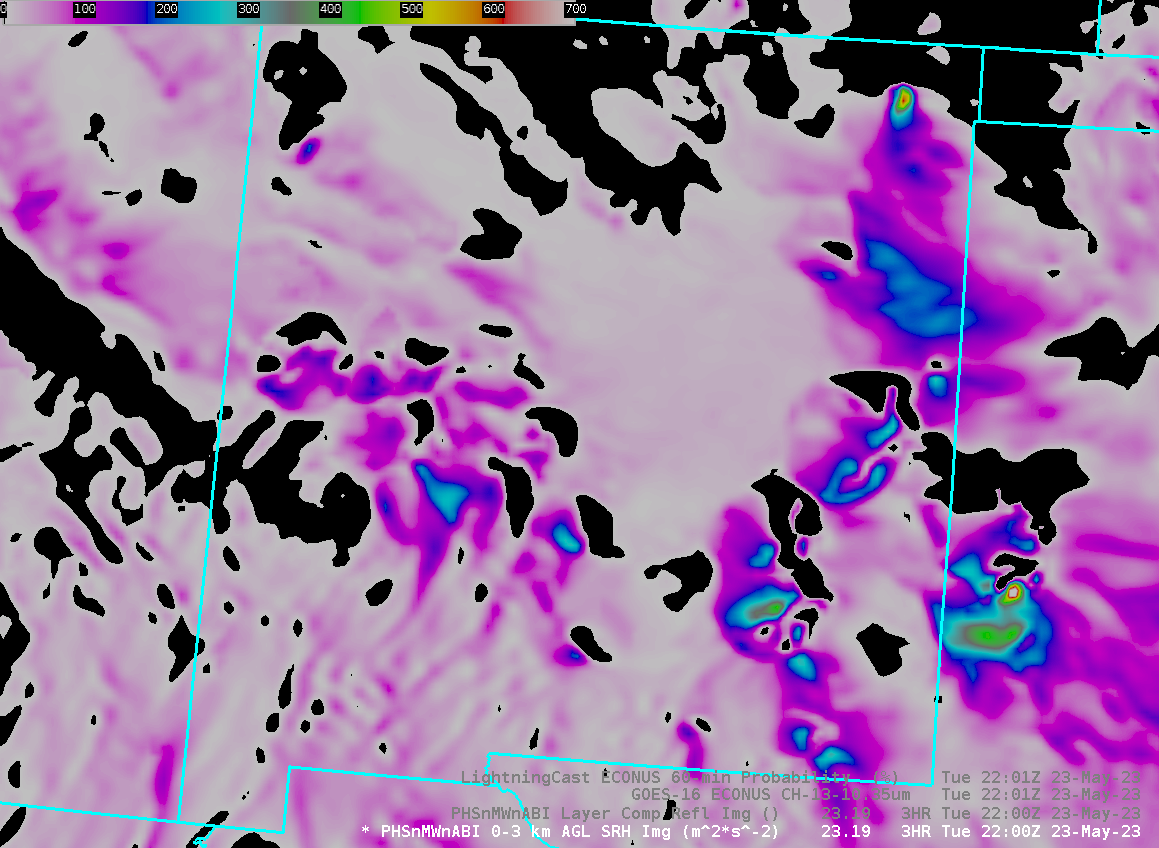
The toggle below compares the Band 13 infrared imagery to low-level storm-relative helicity in the 0-3 km layer. The agreement between the two images varies. The strongest convection over eastern New Mexico and over west Texas has a good counterpart in the helicity fields. Weaker convection through the central part of New Mexico also has corresponding signals in the helicity field. It’s not a perfect one-to-one relationship however.
GOES-16 Clean Window Infrared (10.3 µm) imagery, 2201 UTC on 23 May 2023 with a 3-h forecast of 0-3 km storm-relative helicity from the PHSnMWnABI modeling system (Click to enlarge)
Model composite reflectivity fields, below, suggest that the modeled storm in west-central Texas is the most vigorous at this timestep.
A comparison of the two radar fields at 2200 UTC, observed and simulated, is below. Both show active and more widespread convection over eastern New Mexico and west Texas, with scattered convection over the rest of New Mexico.
MRMS Composite Reflectivity at 2200 UTC on 23 May 2023 and a 3-h forecast of Composite Reflectivity from the PHSnMWnABI modeling system (Click to enlarge)
The in-person HWT Experiment runs through Friday 26 May. After a one-week break (that includes Memorial Day), two remote weeks occur, from 5-9 June and from 12-16 June.


