This website works best with a newer web browser such as Chrome, Firefox, Safari or Microsoft
Edge. Internet Explorer is not supported by this website.
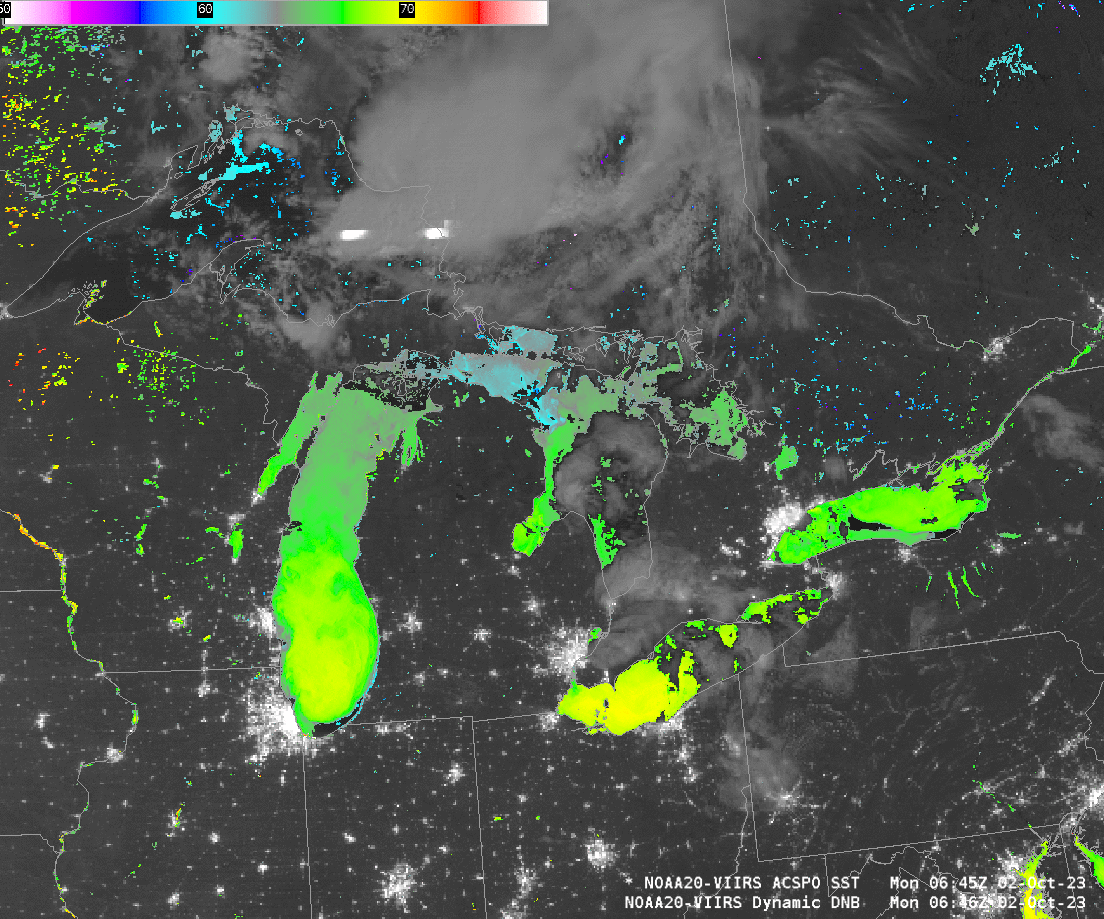
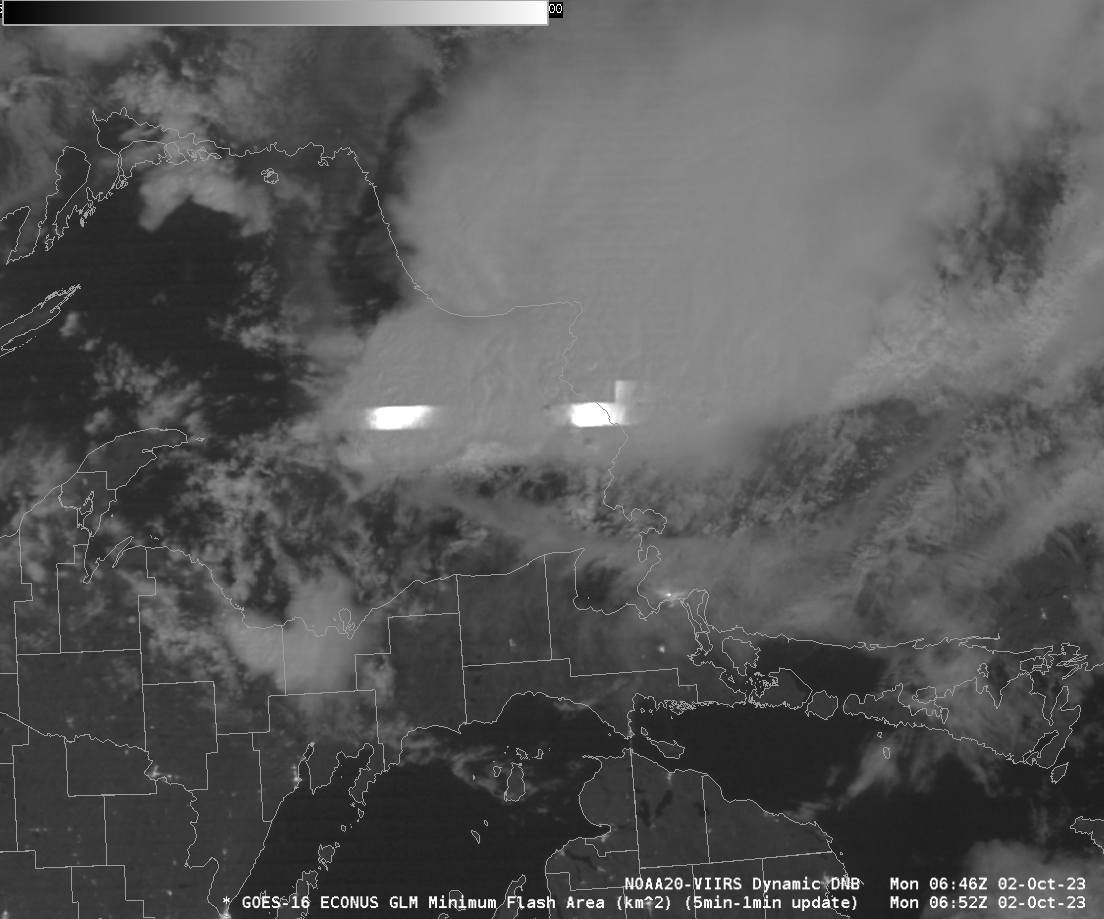
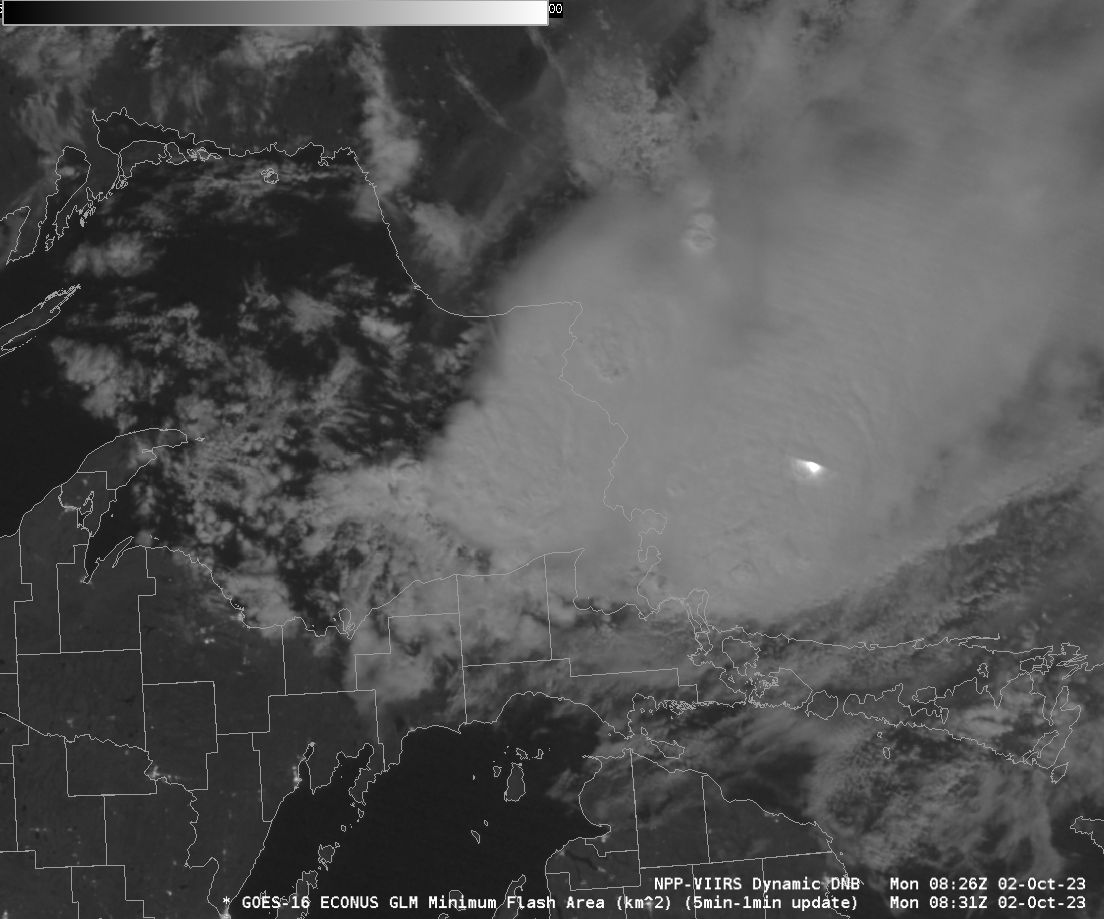
NOAA-20 viewed the (mostly clear) Great Lakes twice early in the morning on 2 October 2023, as shown above. Day Night Band imagery shows convection moving from eastern Lake Superior (lightning strokes are apparent as bright smears in the images) into Ontario. (Day Night Band imagery shows great detail owing... Read More
VIIRS Day Night Band visible (0.7 µm) imagery and ACSPO-derived Lake Surface Temperatures. 0645 and 0825 UTC on 2 October 2023 (Click to enlarge)
NOAA-20 viewed the (mostly clear) Great Lakes twice early in the morning on 2 October 2023, as shown above. Day Night Band imagery shows convection moving from eastern Lake Superior (lightning strokes are apparent as bright smears in the images) into Ontario. (Day Night Band imagery shows great detail owing to a waning gibbous moon with >90% illuminated! [source]) The Advanced Clear-Sky Processing for Oceans (ACSPO) “Sea” surface temperature algorithm applied to VIIRS data shows surface water temperatures peaking at around 70oF in Lakes Erie and Michigan (yellow in the enhancement used). Lake-wide temperatures are a bit above normal for early October (Lake Michigan ; Lake Erie ; both from this website), a testament to the recent warm weather in the Great Lakes states. VIIRS Day Night Band imagery also reveals river valley fog over Pennsylvania (and elsewhere).
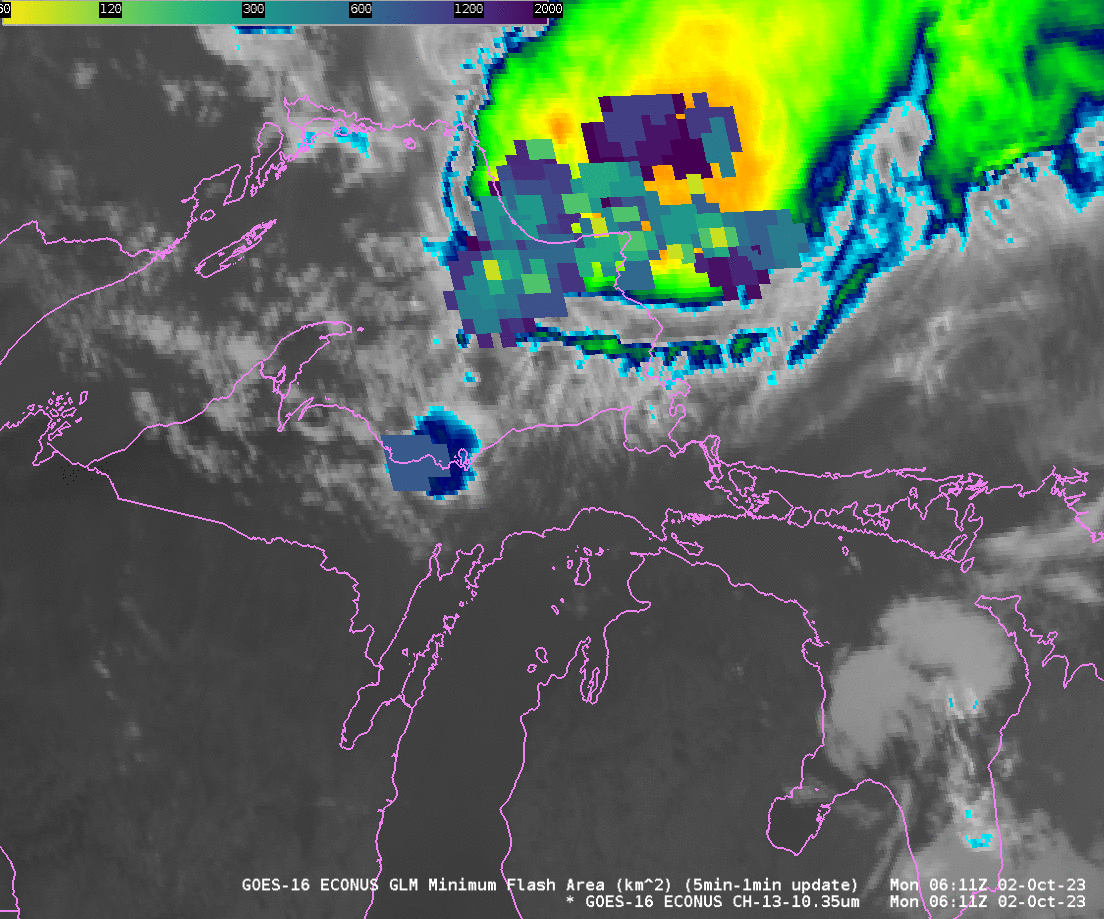
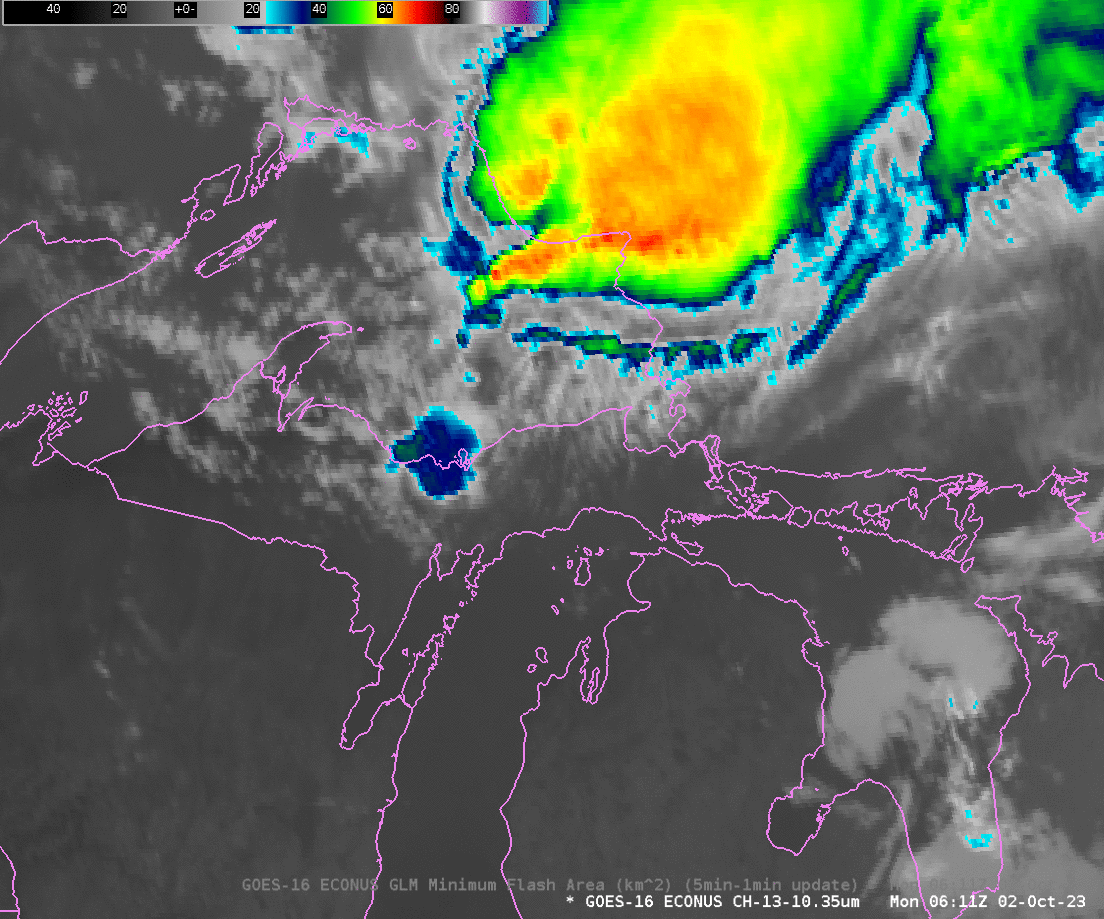
GOES-16 also viewed the convection over Lake Superior. Minimum Flash Area imagery, overlain below on top GOES-16 Band 13 imagery (Click here for an animation of just Band 13 imagery) showed persistent lightning; some of the strokes within the cirrus were quite large in area (purple in the enhancement used).
GOES-16 Clean Window infrared imagery (Band 13, 10.3 µm), 0611-0926 UTC on 2 October 2023 (Click to enlarge)
The image below compares the 5-minute accumulation of Minimum Flash Area at 0652 UTC with the Day Night Band image — that was scanning over Lake Superior at about that time (as determined from the NOAA-20 orbits at this SSEC site). (Here’s a toggle of the same images shown in the comparison below). The light smears in the Day Night Band image might correspond to two small MFA signals displaced north of the signal in the NOAA-20 image, as might be expected because of a parallax shift. The Day Night Band/GLM MFA toggle for the later overpass, at 0831 UTC, does not show a distinct GLM signal were the Day Night Band shows a bright emission.
VIIRS imagery and products are available from CIMSS via an LDM feed. You can also view the imagery at the CIMSS VIIRS Imagery Viewer (or at the Direct Broadcast site here).
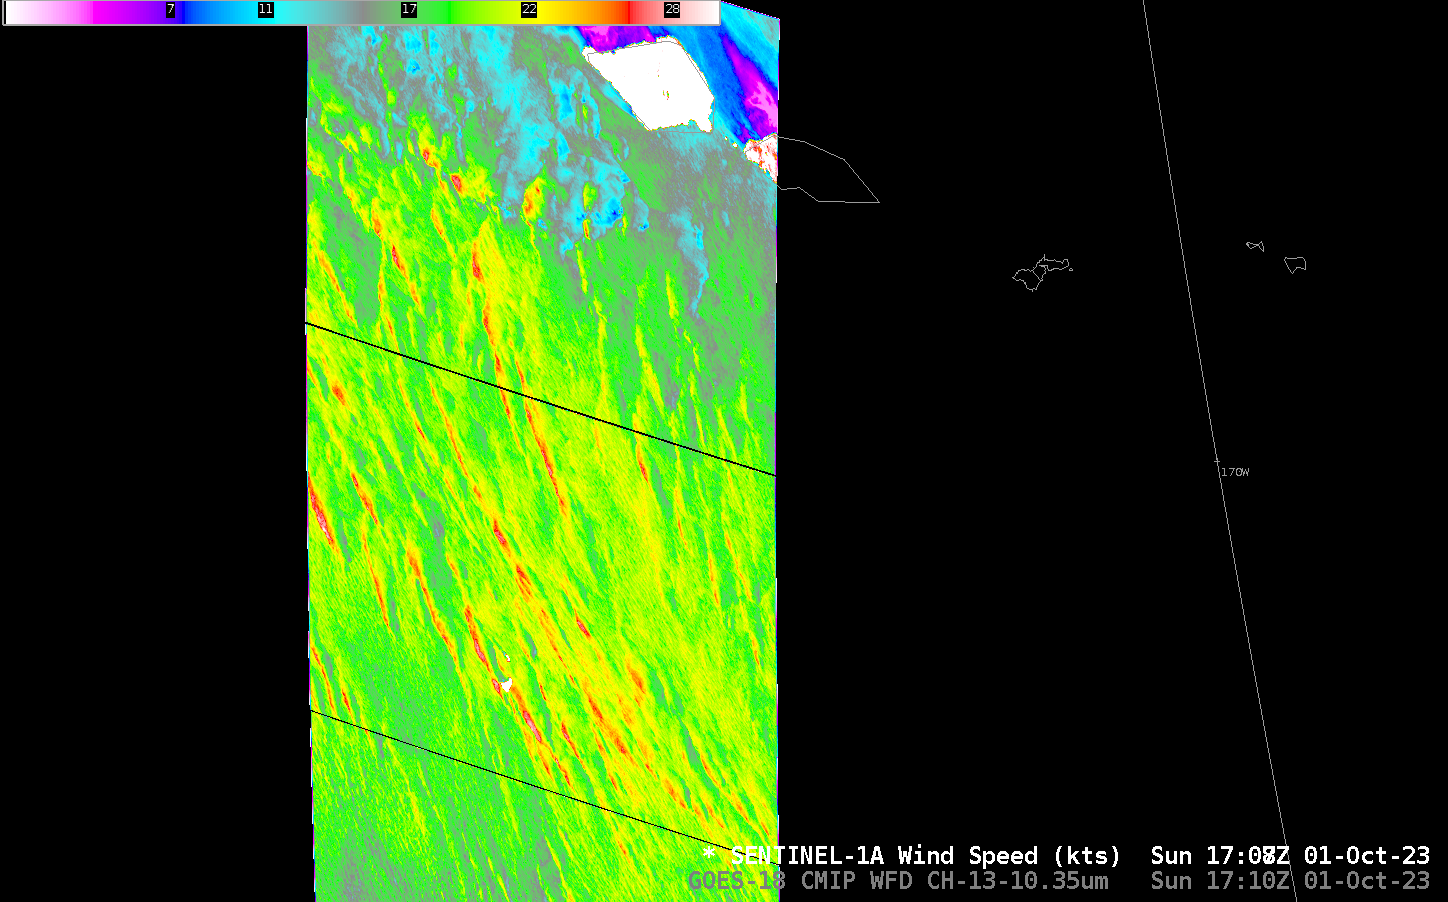
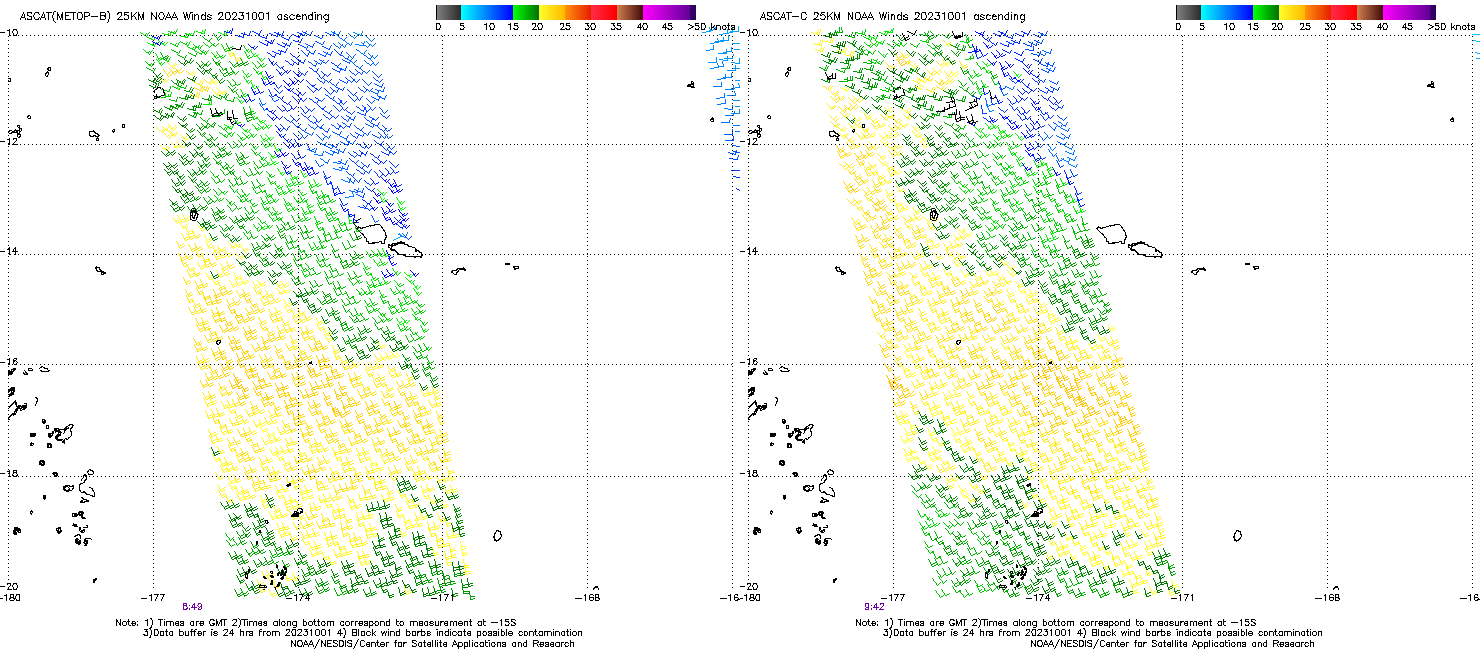
Sentinel-1A overflew the country of Savai’i and the south Pacific to its south on 1 October 2023 (Click here to view the scene at the OceanDataLab website; data are also available at NOAA/STAR’s SAR data website). A benefit of the SAR data is its remarkable horizontal resolution, manifest above as very narrow regions of... Read More
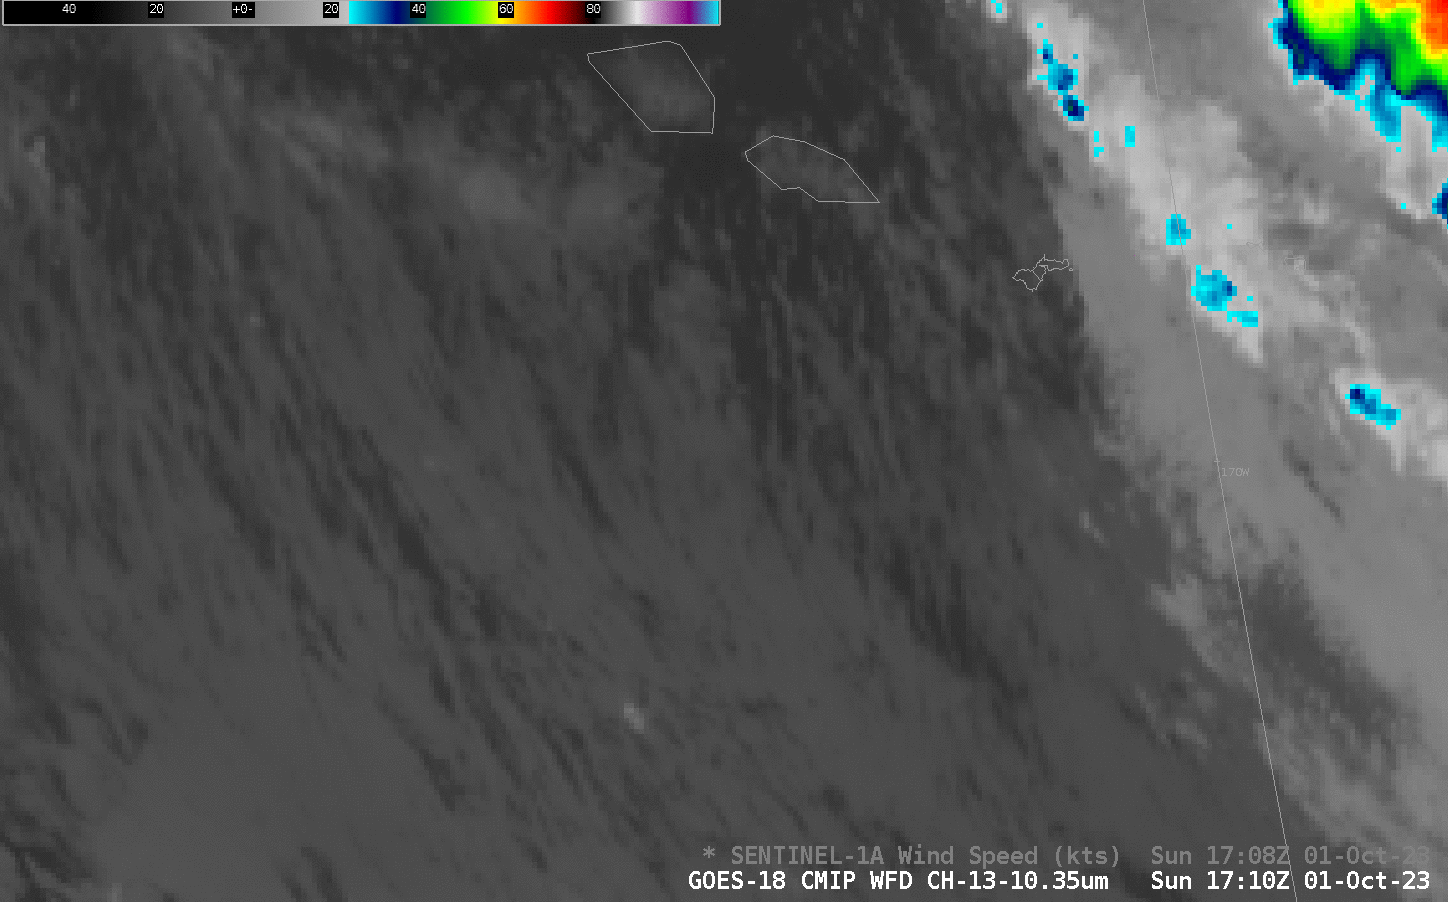
GOES-18 Clean window infrared (Band 13, 10.3 µm) imagery with Sentinel-1A wind speeds (knots) at 1708 UTC on 1 October 2023 (Click to enlarge)
Sentinel-1A overflew the country of Savai’i and the south Pacific to its south on 1 October 2023 (Click here to view the scene at the OceanDataLab website; data are also available at NOAA/STAR’s SAR data website). A benefit of the SAR data is its remarkable horizontal resolution, manifest above as very narrow regions of strongest winds (nearly 30 knots, red in the enhancement used) within a broad region of 20-knot winds (green and yellow in the enhancement used). The southern edge of this scene is 16.8oS, and the arcs of stronger wind start at about 14.3oS. Metop-B and Metop-C sampled the region on 1 October, as shown below, two Advanced Scatterometer (ASCAT) views from the ascending passes (near 0900 UTC) and descending passes (near 2000 UTC).
ASCAT winds from MetopB (left, 0849 UTC) and MetopC (right, 0942 UTC) on 1 October 2023 (Click to enlarge)
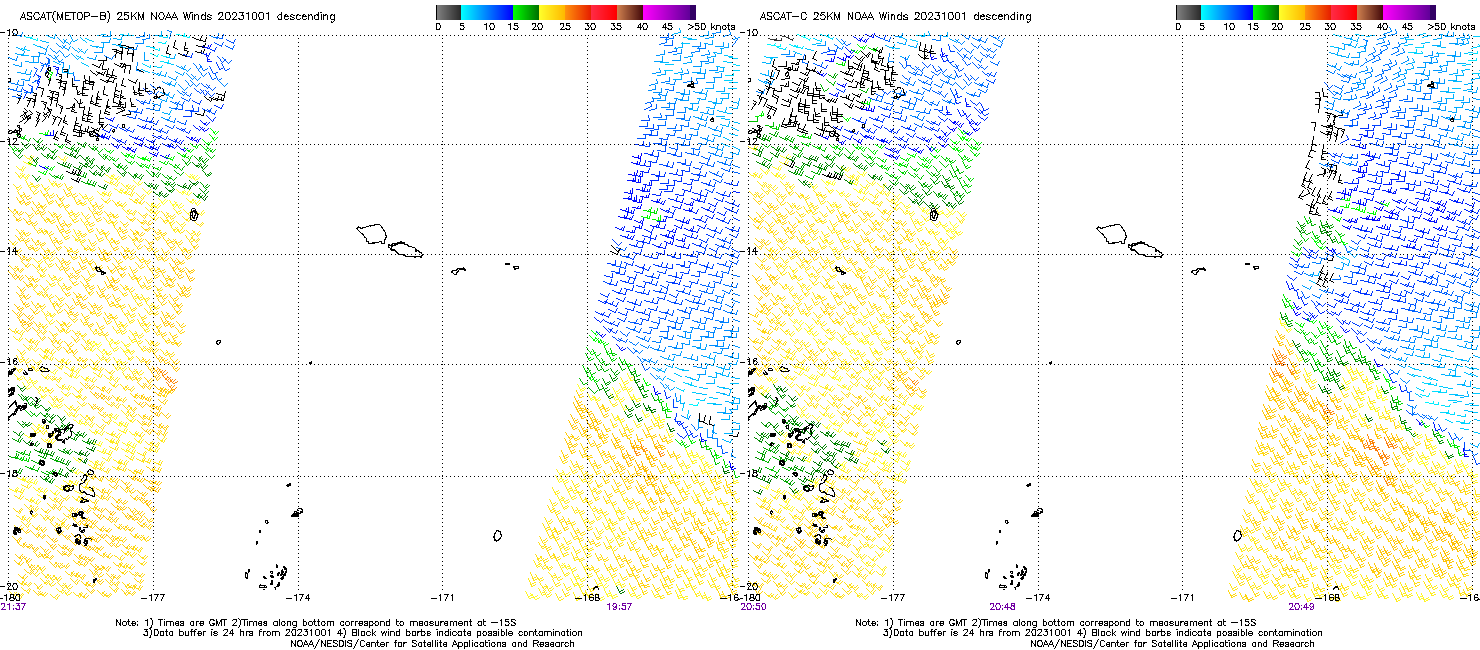
The ca. 2000 UTC ASCAT observations shown below don’t really sample the region (between 14o and 17o S) sampled by SAR data above. One might be tempted to draw a line from the eastern to western swaths of strongest winds to anticipate winds of 20-25 knots to the south of Samoa, that is, an expansion northward of the observed winds at ca. 0900 UTC shown above. Peak ASCAT winds are 25 knots however, in contrast to the 30-knot SAR observations.
ASCAT winds from MetopB (left, 1937 UTC) and MetopC (right, 2049 UTC) on 1 October 2023 (Click to enlarge)
Ascending (morning) and Descending (afternoon) passes on 1 and 2 October, below, show the expansion of strong winds from south of Samoa to north of Samoa. Note also at the end the appearance of weaker winds downwind of Savai’i, Opolu and Tutuila due to the islands blocking the wind.
ASCAT winds from MetopB (left) and MetopC (right) on 1 and 2 October 2023 (click to enlarge)
Consider the horizontal scale of the wind observations you are using as you interpret them.
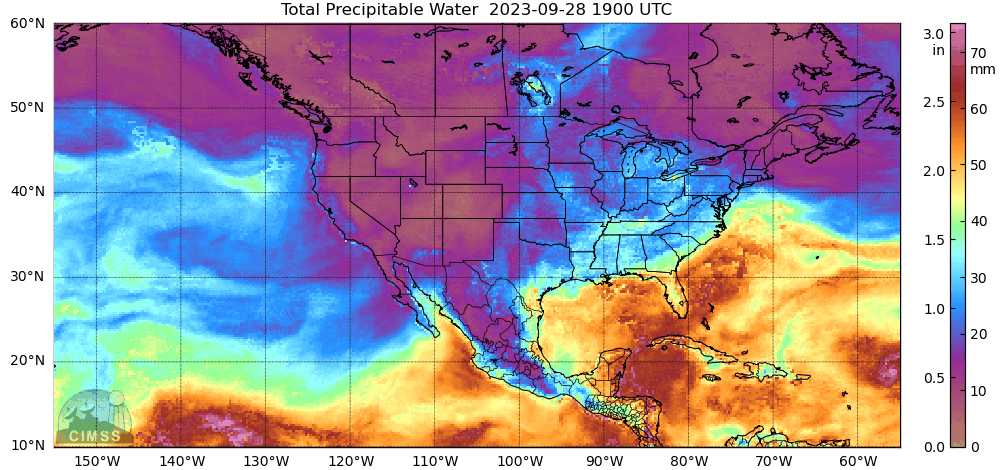
MIMIC Total Precipitable Water, 1900 UTC 28 September – 1800 UTC 29 September 2023 (Click to enlarge)
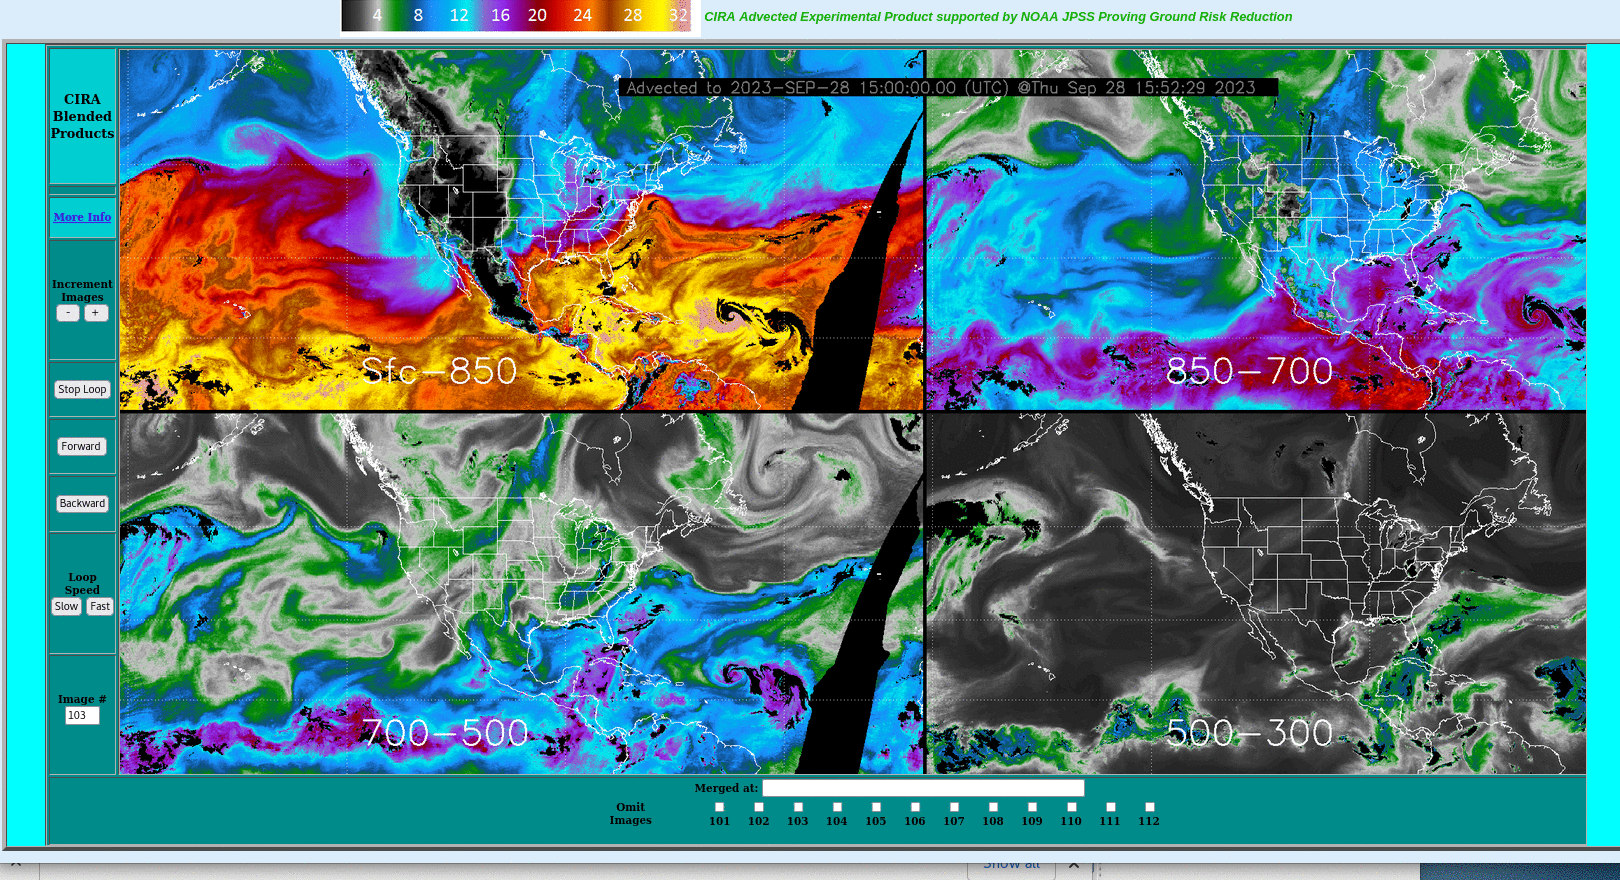
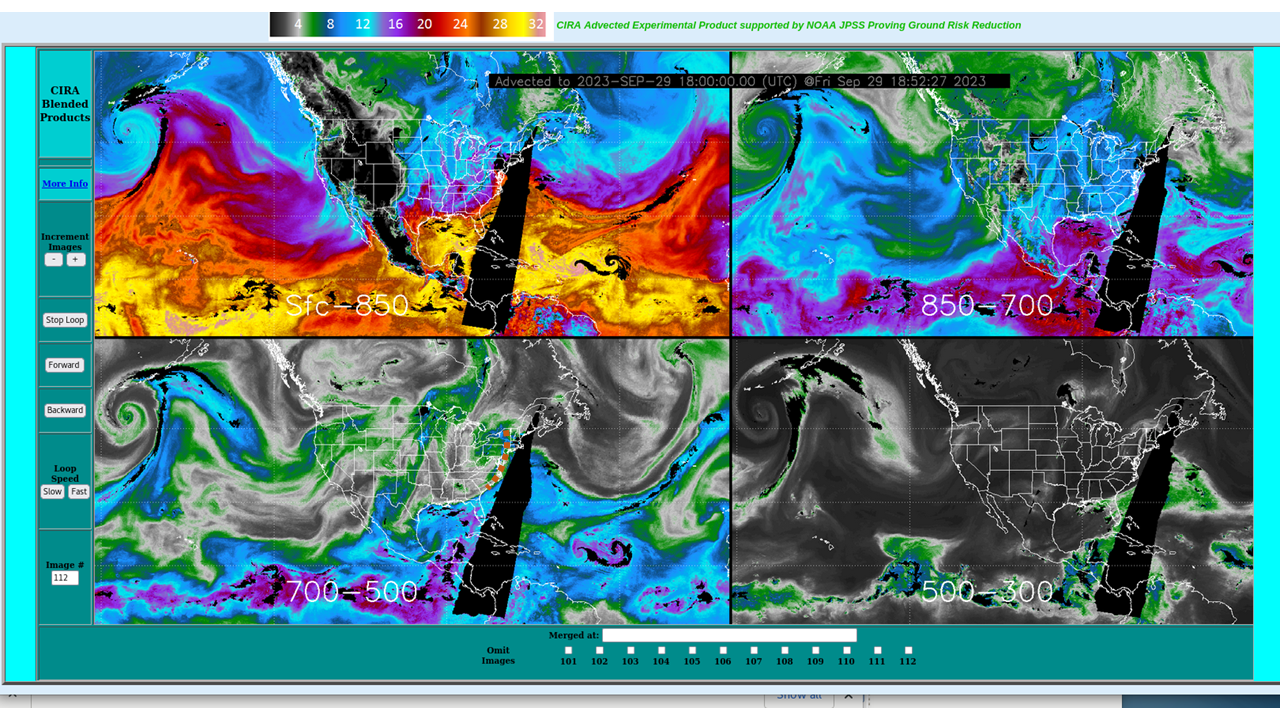
Persistent rains over the New York City metropolitan area have caused urban flooding on 29 September (29 September is the wettest day since 1948 in NYC well!). MIMIC TPW, above (source), shows moisture moving inland from the Atlantic Ocean. It’s often the case that heavy rain is accompanied by advection of moisture at multiple layers in the atmosphere; the Advected Layer Precipitable Water product, below (source), identifies two sources of moisture moving over metropolitan New York: moisture from the Atlantic is moving towards New York in the layer from the Surface to 850 mb; moisture from the Great Lakes is moving towards New York in the 700-500 mb layer, accompanying what appears to be a mid-level impulse. The edge of that feature from 700-500 mb is close to New York at 1800 UTC, the end of the animation, as shown in this annotated image (see the dotted orange line in the lower left image).
Advected Layer Precipitable Water at 3-hour time steps,. 1500 UTC/28 September 2023 – 1800 UTC/29 September 2023 (Click to enlarge)
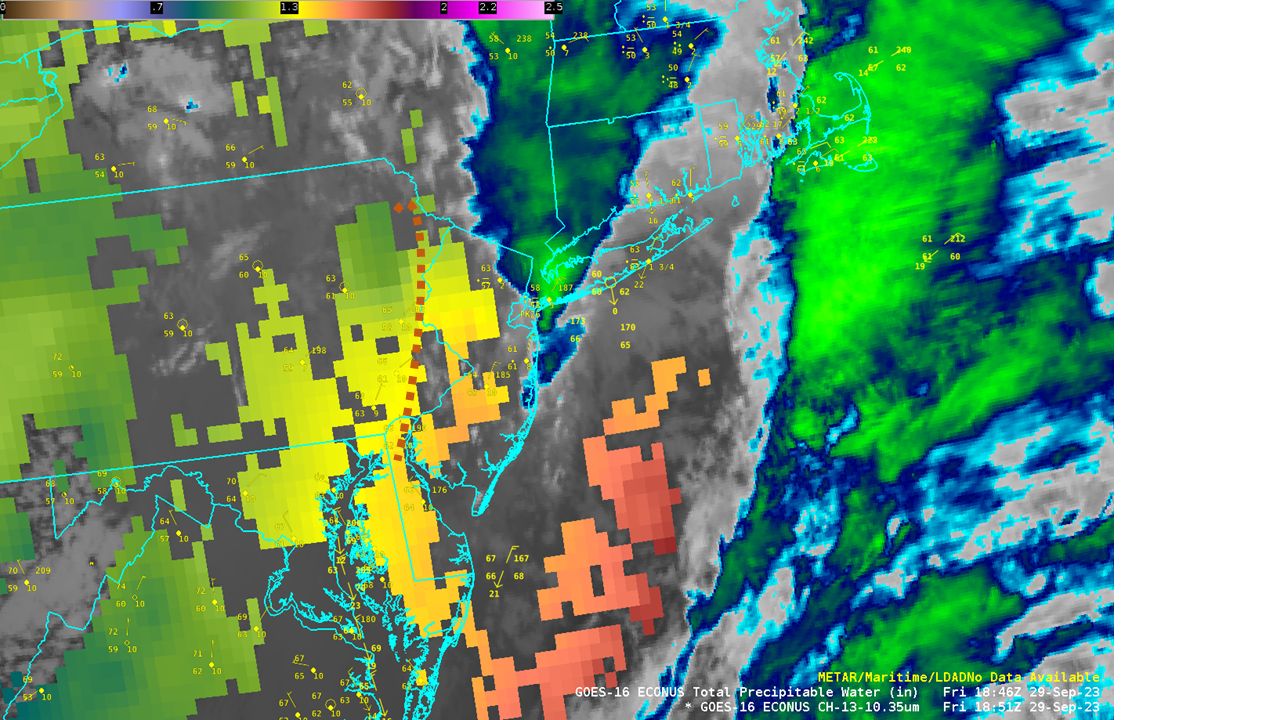
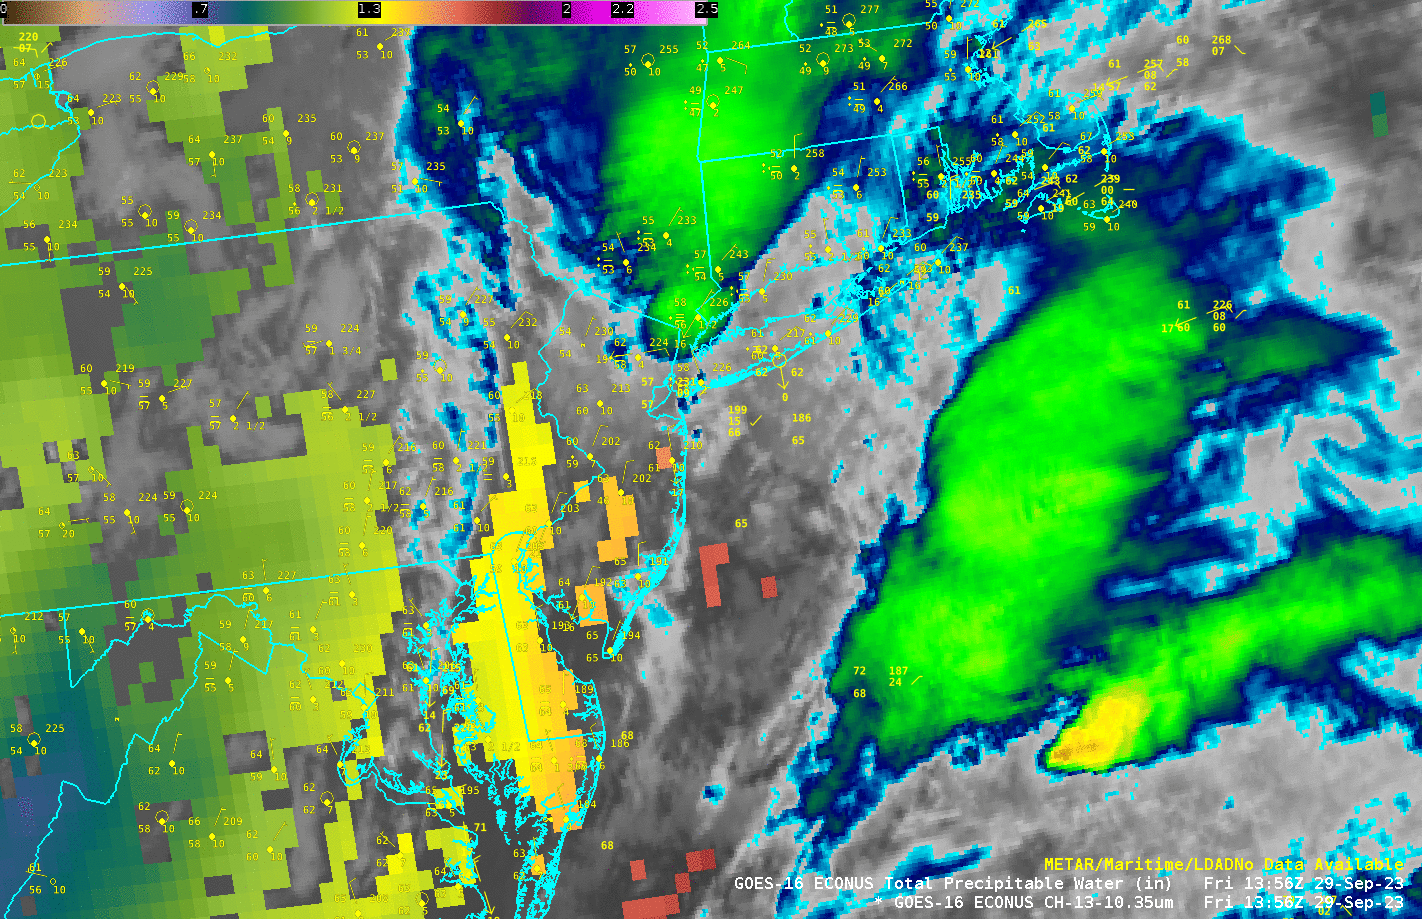
GOES-16 imagery, below, shows persistent redevelopment of convection over western Long Island/metropolitan New York City. As in the ALPW fields, a boundary is approaching metropolitan New York City by the end of the animation (1851 UTC). Perhaps the passage of that boundary will lessen the likelihood of convective redevelopment (caveat: your blogger is not a paid forecaster!) Abundant moisture (values exceeding 1.6″) is to the southeast of New Jersey (reddish orange in the enhancement), with more modest values (1.3-1.4 inches, yellow in the enhancement used) over New Jersey/eastern Pennsylvania.
GOES-16 Clean Window infrared (Band 13, 10.3 µm), Total Precipitable Water (in clear skies), and surface observations, 1356 – 1851 UTC, 29 September 2023 (Click to enlarge)
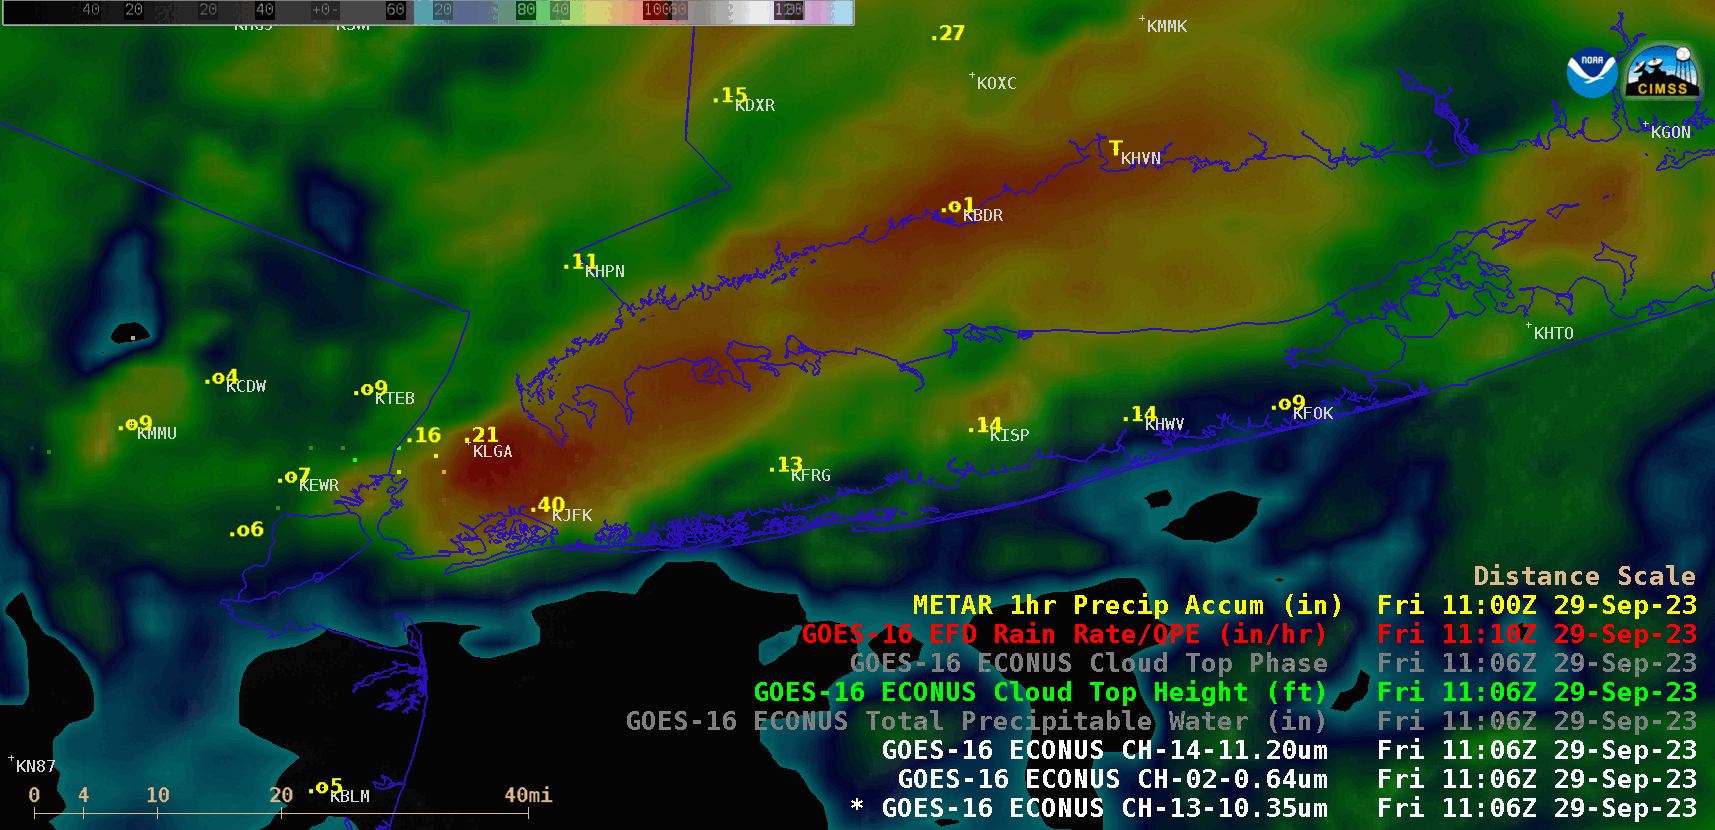
GOES-16 Visible/Infrared Sandwich RGB images with METAR 1-hour Precipitation Accumulation reports plotted in yellow, from 1106-2201 UTC (courtesy Scott Bachmeier, CIMSS) [click to play animated GIF | MP4]
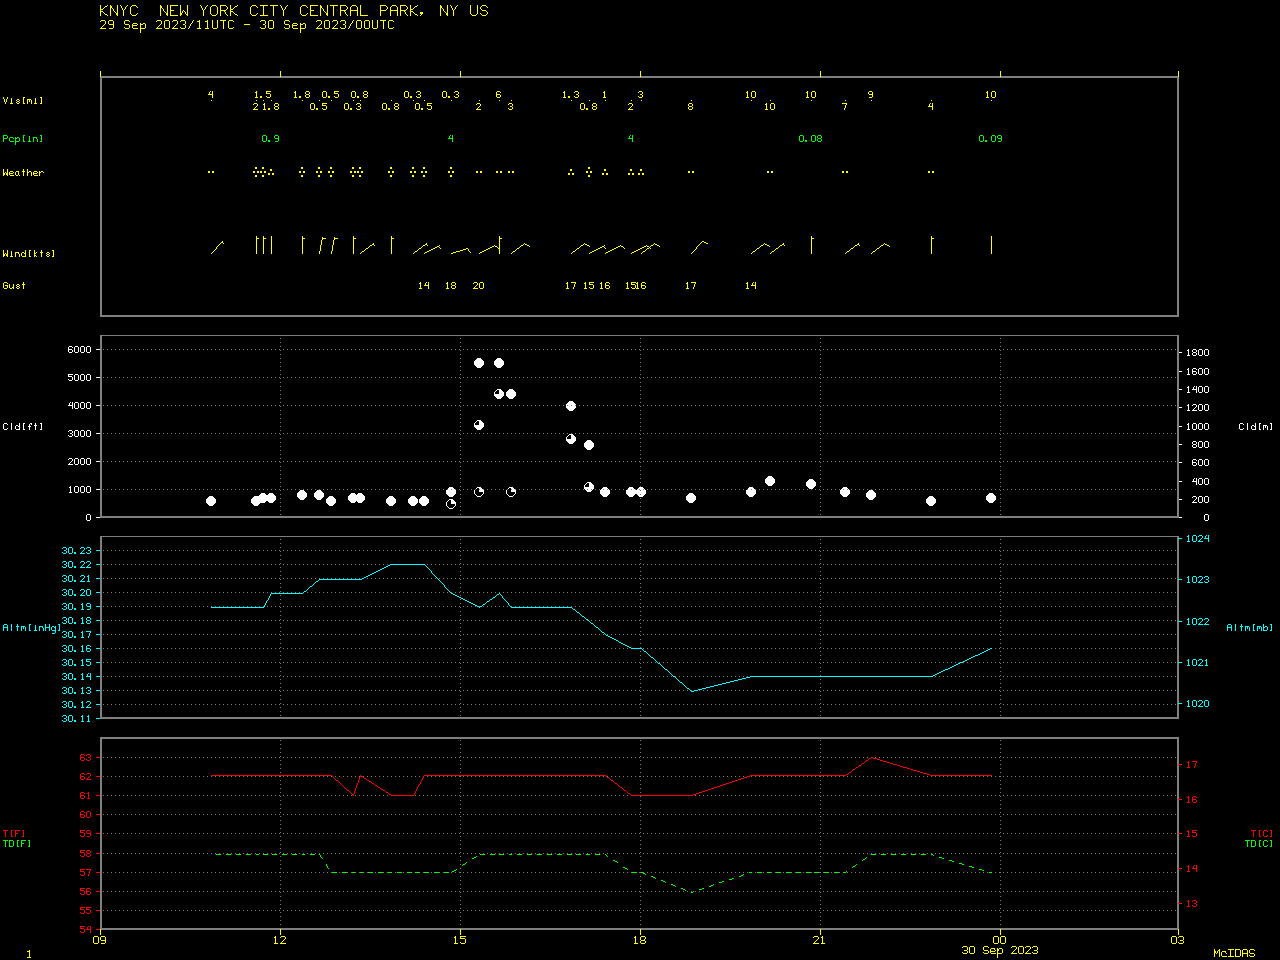
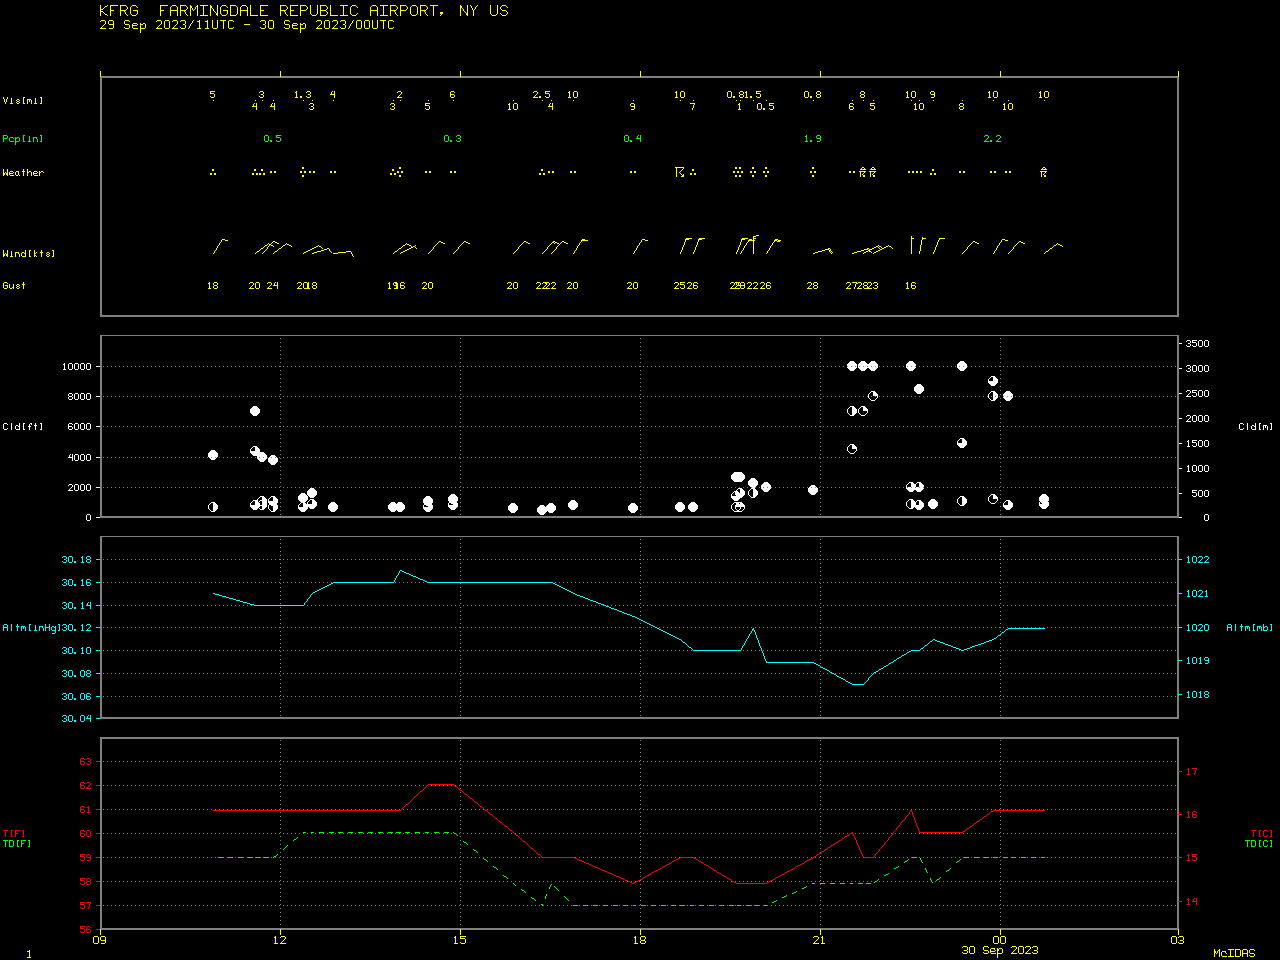
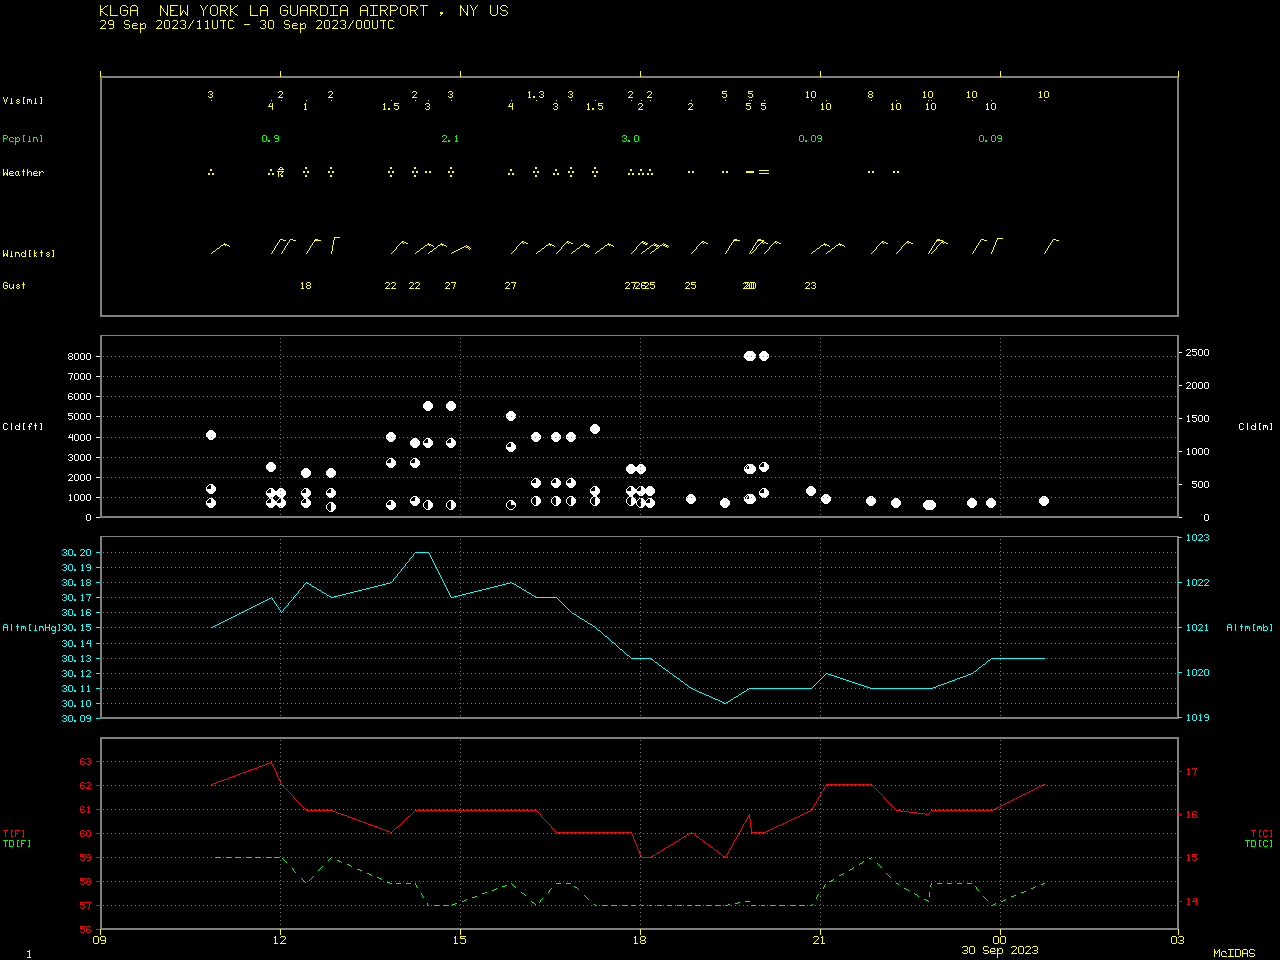
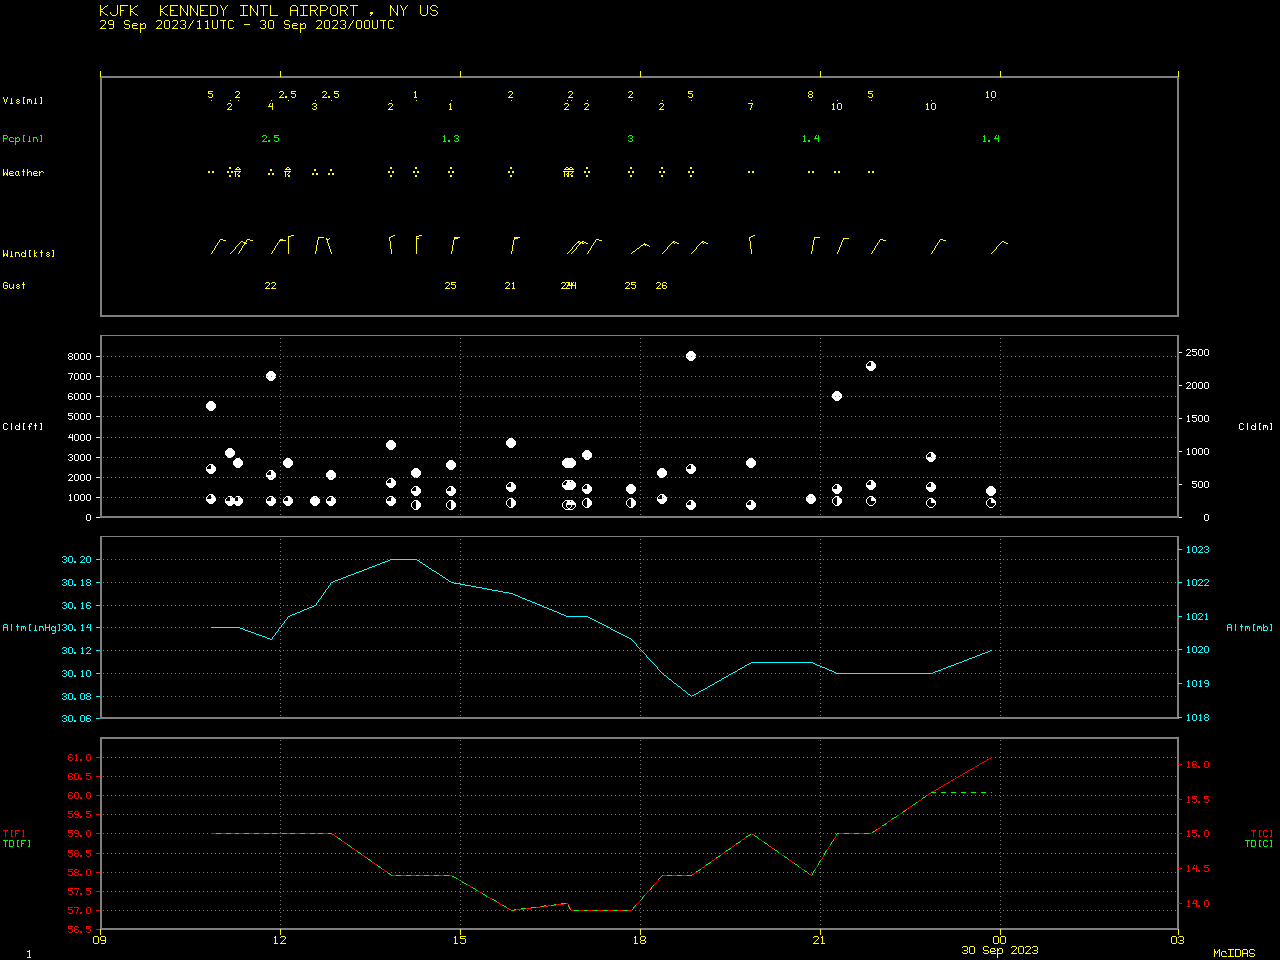
GOES-16 Visible/Infrared Sandwich RGB images (above) provided a closer look at the NYC area — METAR 1-hour Precipitation Accumulations were as high as 1.96 inches at Central Park (surface observations), 1.42 inches at Farmingdale (KFRG, surface observations), 1.40 inches at La Guardia Airport (KLGA, surface observations) and 1.24 inches at Kennedy International Airport (KJFK, surface observations). Such rainfall rates contributed to the high precipitation totals across the region, with amounts exceeding 9 inches in the NYC area.
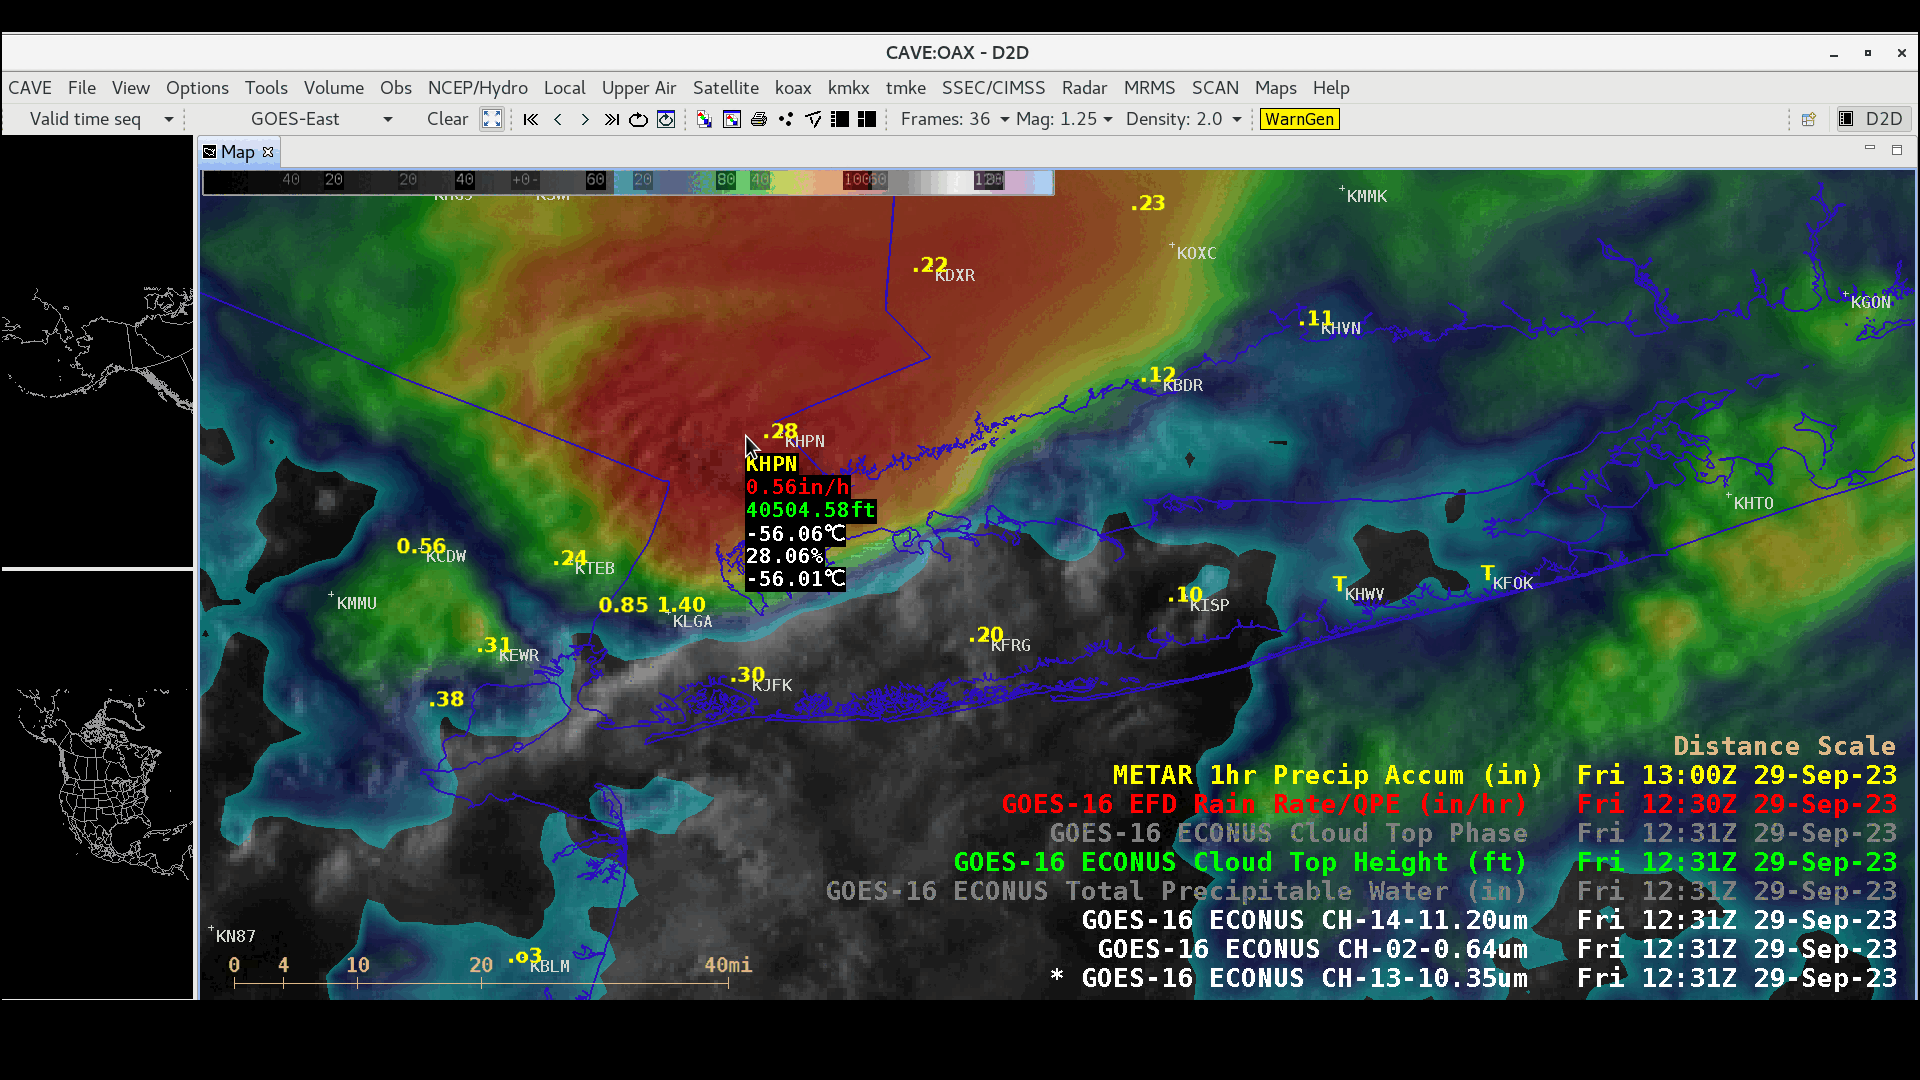
GOES-16 Visible/Infrared Sandwich RGBs with cursor sampling of the associated Rainfall Rate and Cloud Top Height derived products (below) displayed Rainfall Rates of 0.56 to 0.67 inch per hour for 3 consecutive 5-minute images — associated with the thunderstorm that was passing over/near La Guardia Airport KLGA (where the 1-hour METAR Precipitation Accumulation at 1300 UTC was 1.40 inches). Taking parallax into account, the ~40 kft cloud tops were actually located about 16 km (10 miles) to the south (closer to KLGA).
GOES-16 Visible/Infrared Sandwich RGB images with cursor sampling of Rainfall Rate (red) and Cloud Top Height (green), from 1231-1241 UTC (courtesy Scott Bachmeier, CIMSS) [click to enlarge]
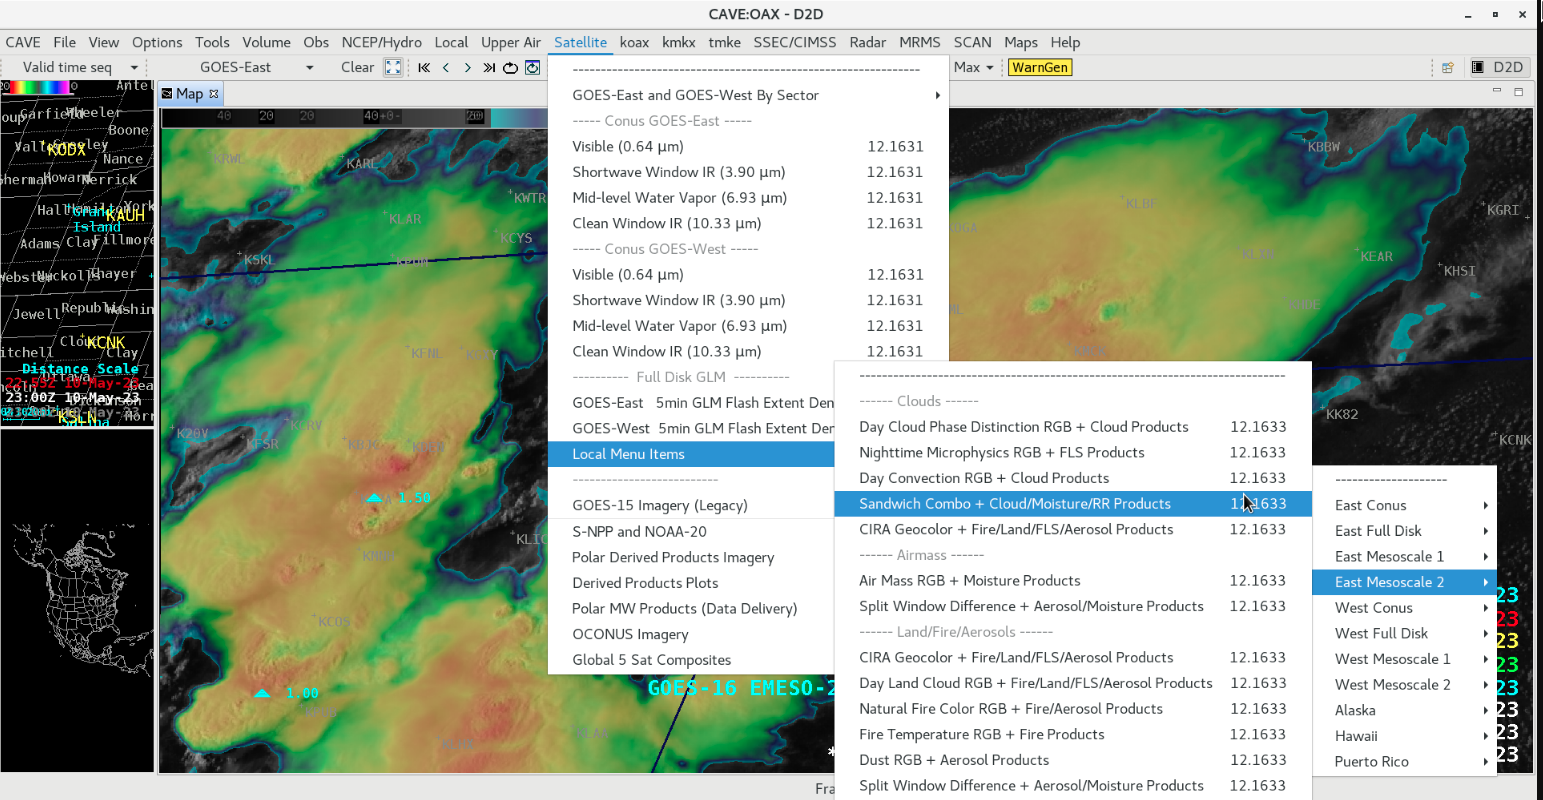
AWIPS cursor sampling of GOES Level 2 derived products associated with a variety of RGBs is available via “Satellite -> Local Menu Items“. This technique of sampling satellite-derived rainfall rates could prove to be helpful in areas where radar coverage is poor (or unavailable).
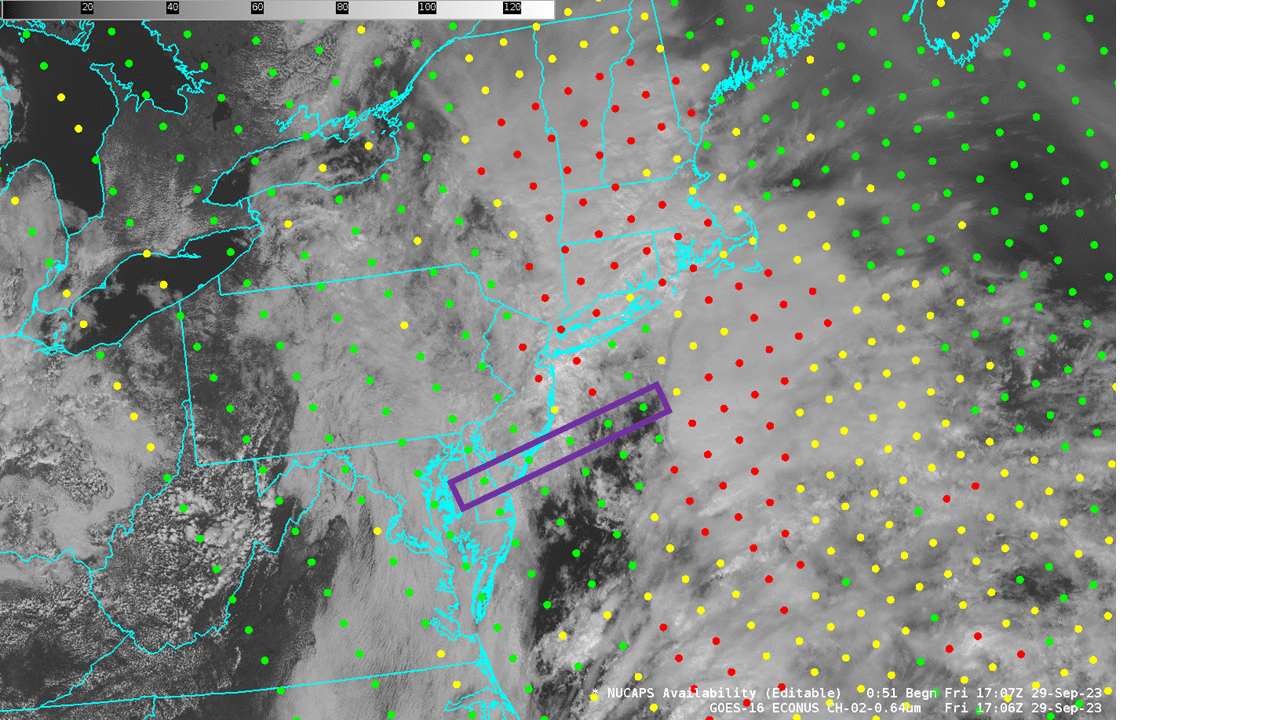
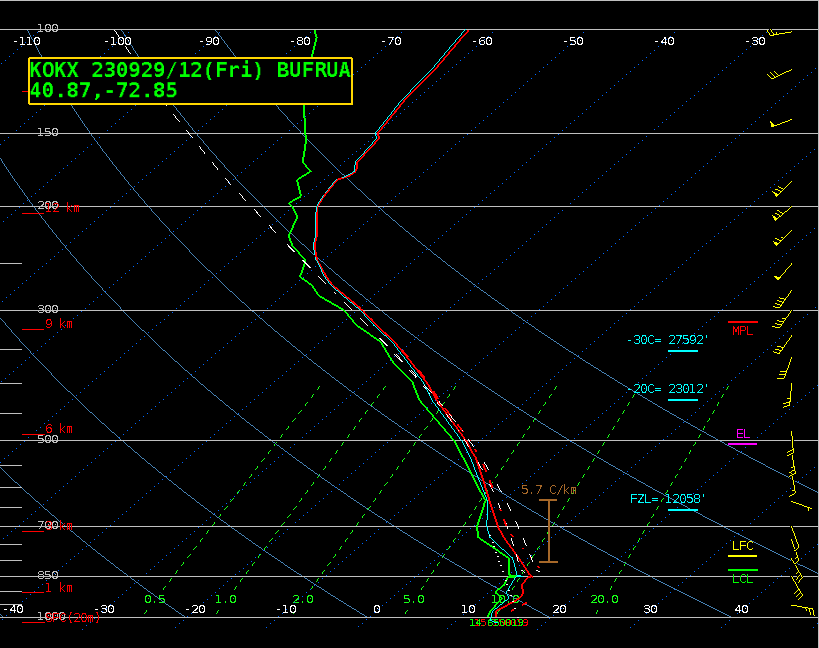
NOAA-20 overflew New York just before 1800 UTC on 29 September 2023. In the Sounding Availability Plot below, a line of NUCAPS profiles stretching east-northeastward from the central DelMarva peninsula are plotted in green — meaning the infrared retrieval converged to a solution — and boxed in purple. The individual profiles are shown in the animation, with locations indicated. The 3 easternmost soundings show a profile very similar to the 1200 UTC sounding at Upton, NY (also available here); that is, nearly moist adiabatic and close to saturation.
NOAA-20 NUCAPS profiles at location as indicated, ca. 1800 UTC on 29 September 2023 (Click to enlarge)
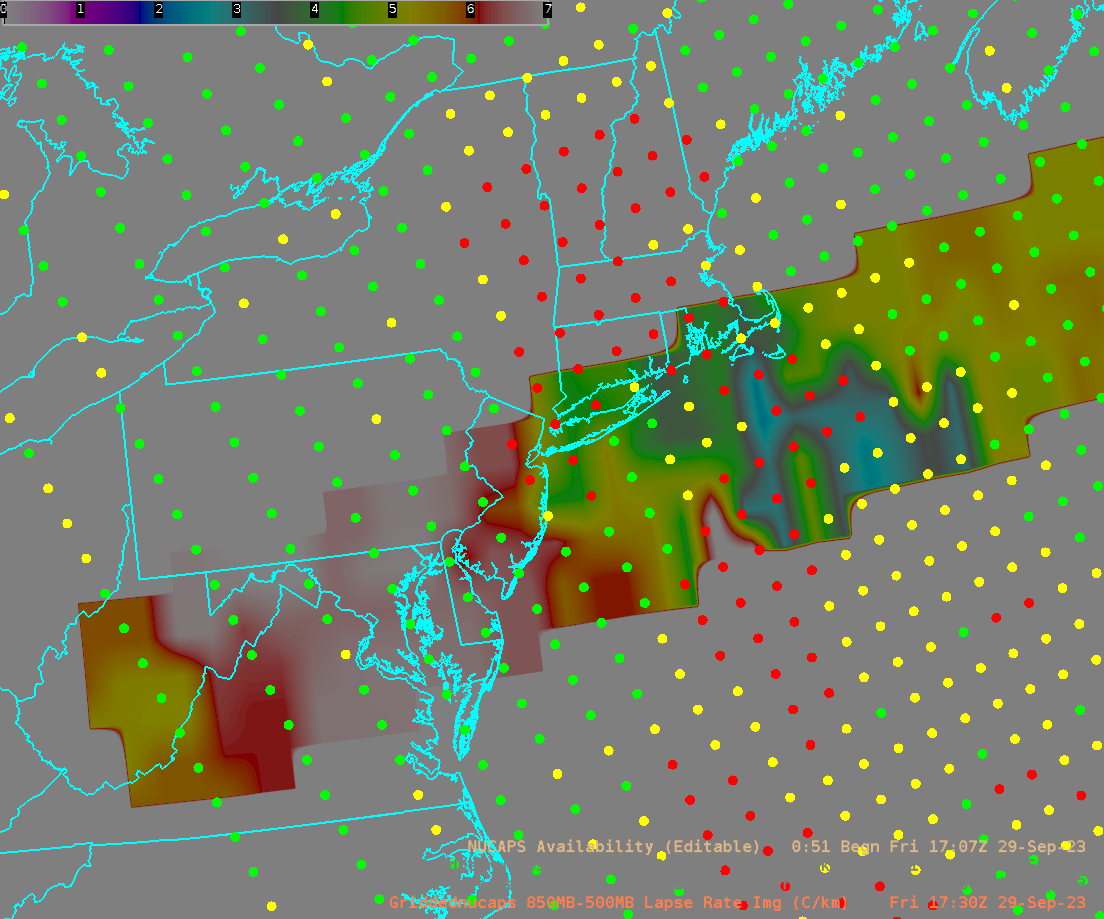
NUCAPS profiles can be horizontally interpolated to a grid. The 850-500 mb lapse rate computed from those fields is shown below. The most unstable air stretches back into northern Virginia.
NOAA-20 NUCAPS gridded estimates of 850-500 mb Lapse Rates, 1730 UTC on 29 September 2023 (Click to enlarge)
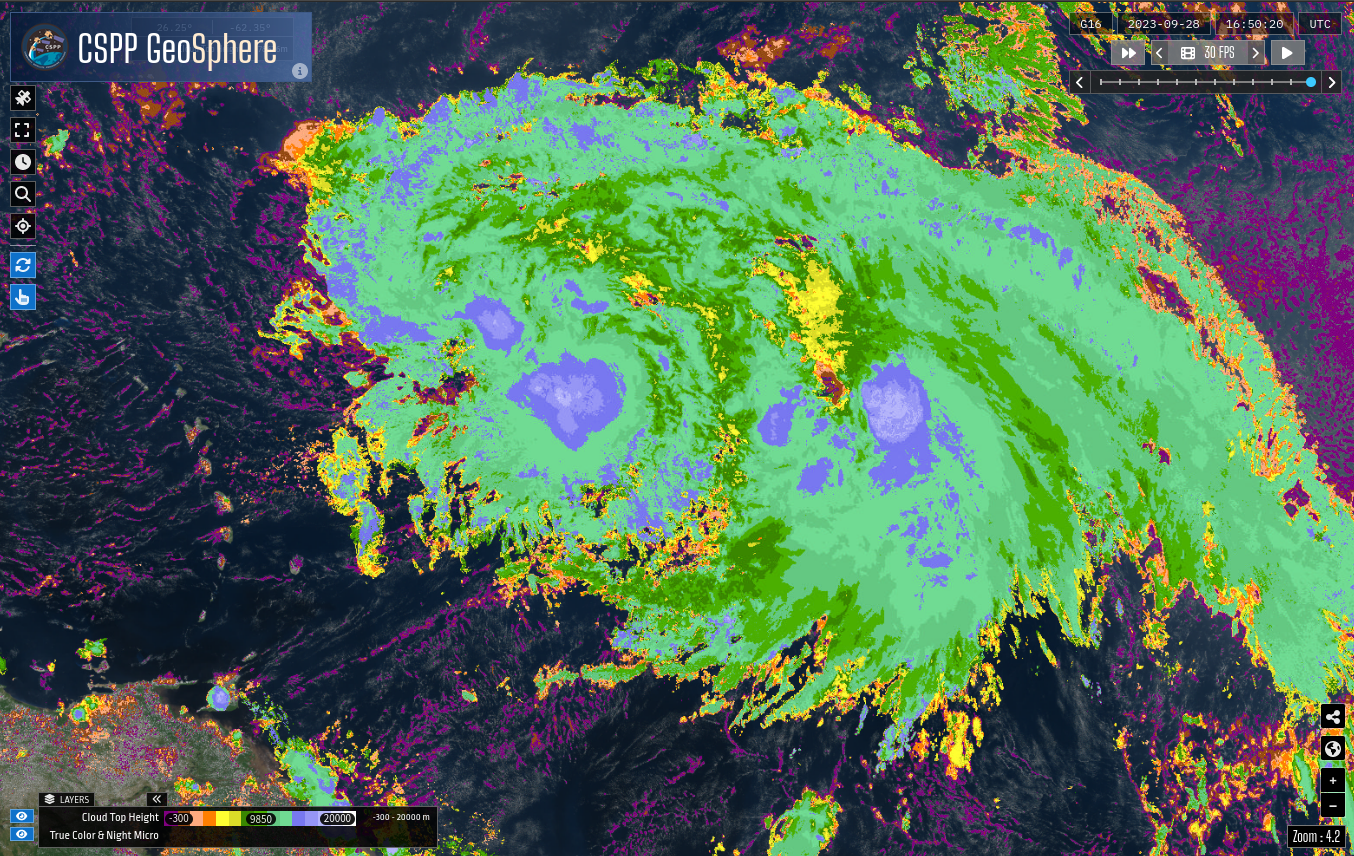
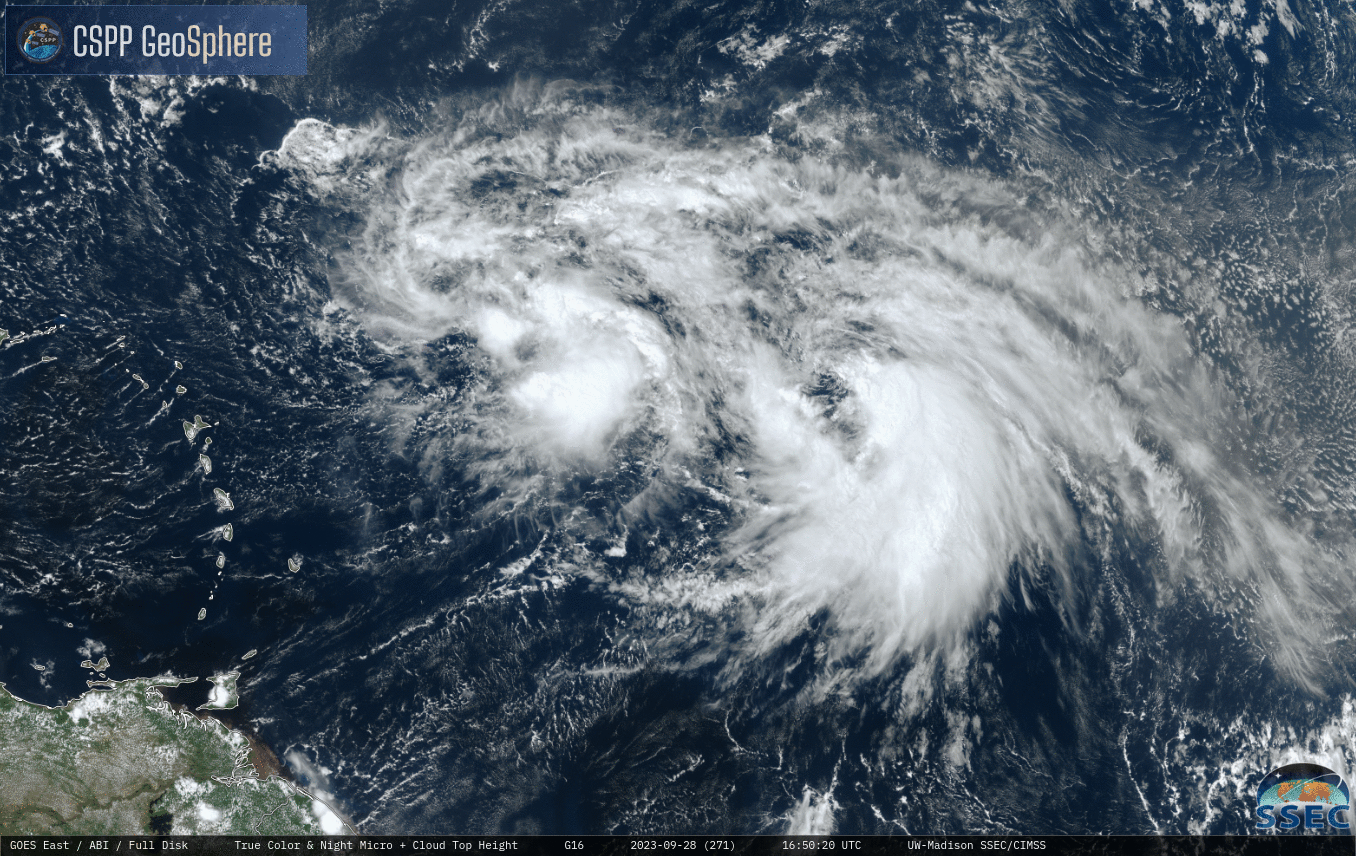
Scientists at CIMSS are putting a test version of the CSPP Geosphere site through its paces. The new version includes Level 2 products (Cloud Top Height, Cloud Top Pressure; both can be displayed using geo2grid software) — at full ABI resolution. The True-Color animation above shows Tropical Storms Phillipe and Rina... Read More
GOES-16 True-Color imagery, 1500-1650 UTC on 28 September 2023
Scientists at CIMSS are putting a test version of the CSPP Geosphere site through its paces. The new version includes Level 2 products (Cloud Top Height, Cloud Top Pressure; both can be displayed using geo2grid software) — at full ABI resolution. The True-Color animation above shows Tropical Storms Phillipe and Rina in close proximity over the tropical Atlantic Ocean. (Rina’s exposed low-level circulation is very apparent!) The animation below include a Cloud Top Height overlay, with a scale shown. Cloud Top Heights over Rina peak at around 16000 m; those over Phillipe include values exceeding 17000 m
GOES-16 True-Color imagery and Level 2 Cloud Top Height, 1500-1650 UTC on 28 September 2023
A toggle between the two images at 1650 UTC is shown below. Screen controls are not saved when imagery are exported, but those controls can be seen in this screenshot.
GOES-16 True Color and Cloud Top Heights, 1650 UTC on 28 September 2023 (Click to enlarge)
Stay tuned for an announcement for the update to CSPP Geosphere!


