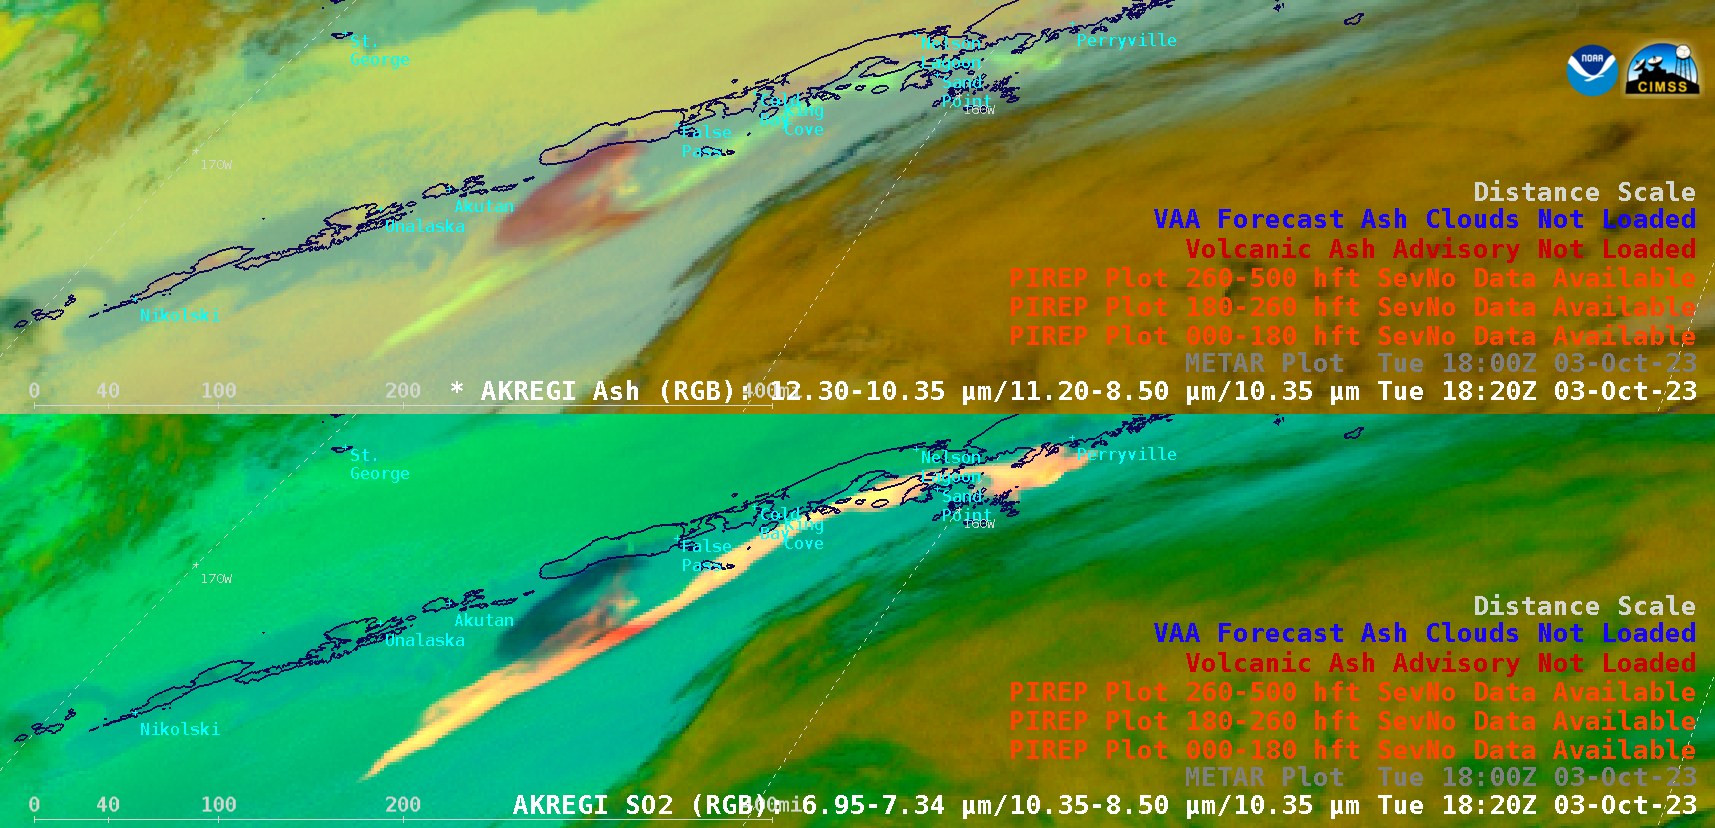
GOES-18 (GOES-West) SO2 RGB and Ash RGB images (above) showed the complex transport of a volcanic cloud produced by an explosive eruption of Mount Shishaldin that began around 1350 UTC on 03 October 2023. The bulk of the higher-altitude volcanic cloud was rich in SO2 (shades of yellow in both RGB types), while a smaller mid-level portion that had... Read More

GOES-18 Ash RGB images (top) and SO2 RGB images (bottom), with plots of Pilot Reports and Volcanic Ash Advisory/Forecast polygons, from 1250-1910 UTC [click to play animated GIF | MP4]
GOES-18
(GOES-West) SO2 RGB and
Ash RGB images
(above) showed the complex transport of a volcanic cloud produced by an explosive eruption of
Mount Shishaldin that began around 1350 UTC on 03 October 2023. The bulk of the higher-altitude volcanic cloud was rich in SO2 (shades of yellow in both RGB types), while a smaller mid-level portion that had high ash content exhibited shades of reddish-brown in the Ash RGB (and shades of blue to pink in the SO2 RGB images).
2 Pilot Reports (PIREPs) issued shortly after the eruption onset indicated an ash height of 21000 ft at 1400 UTC, and 40000 ft at 1446 UTC (below).
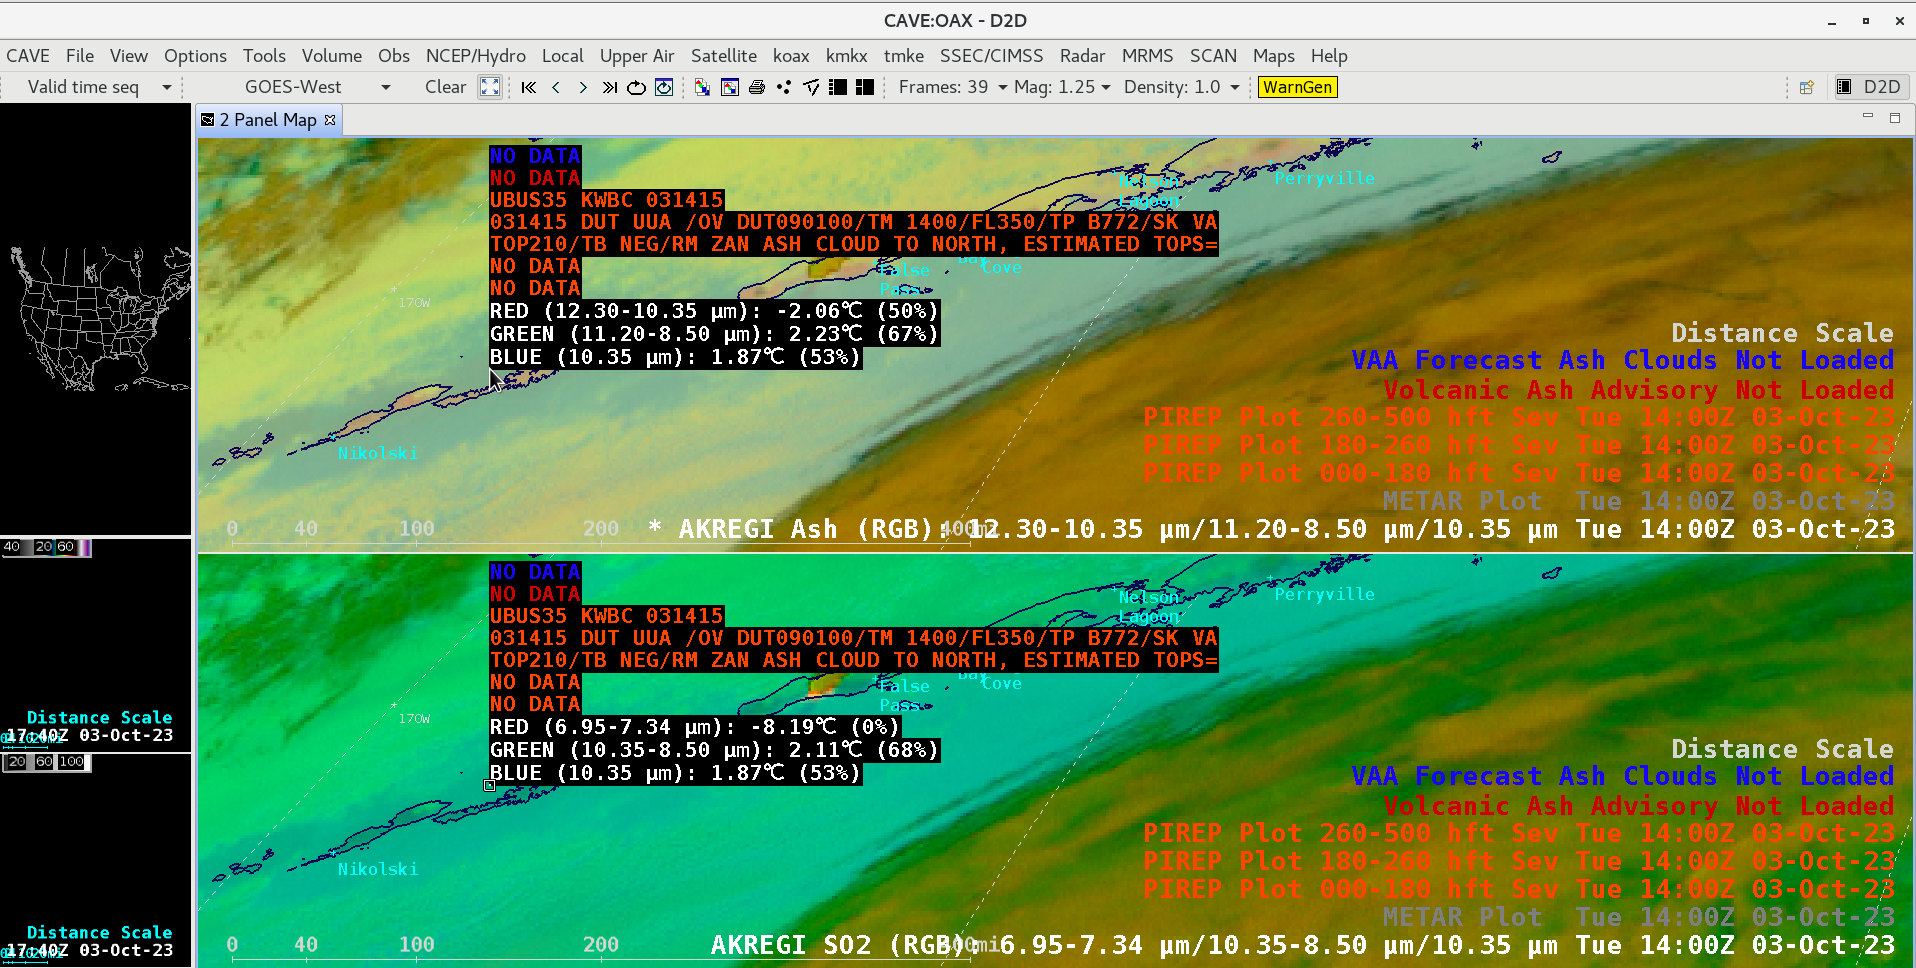
GOES-18 Ash RGB (top) and SO2 RGB (bottom) images at 1400 UTC, with cursor sampling of a of Pilot Report issued at 1400 UTC [click to enlarge]
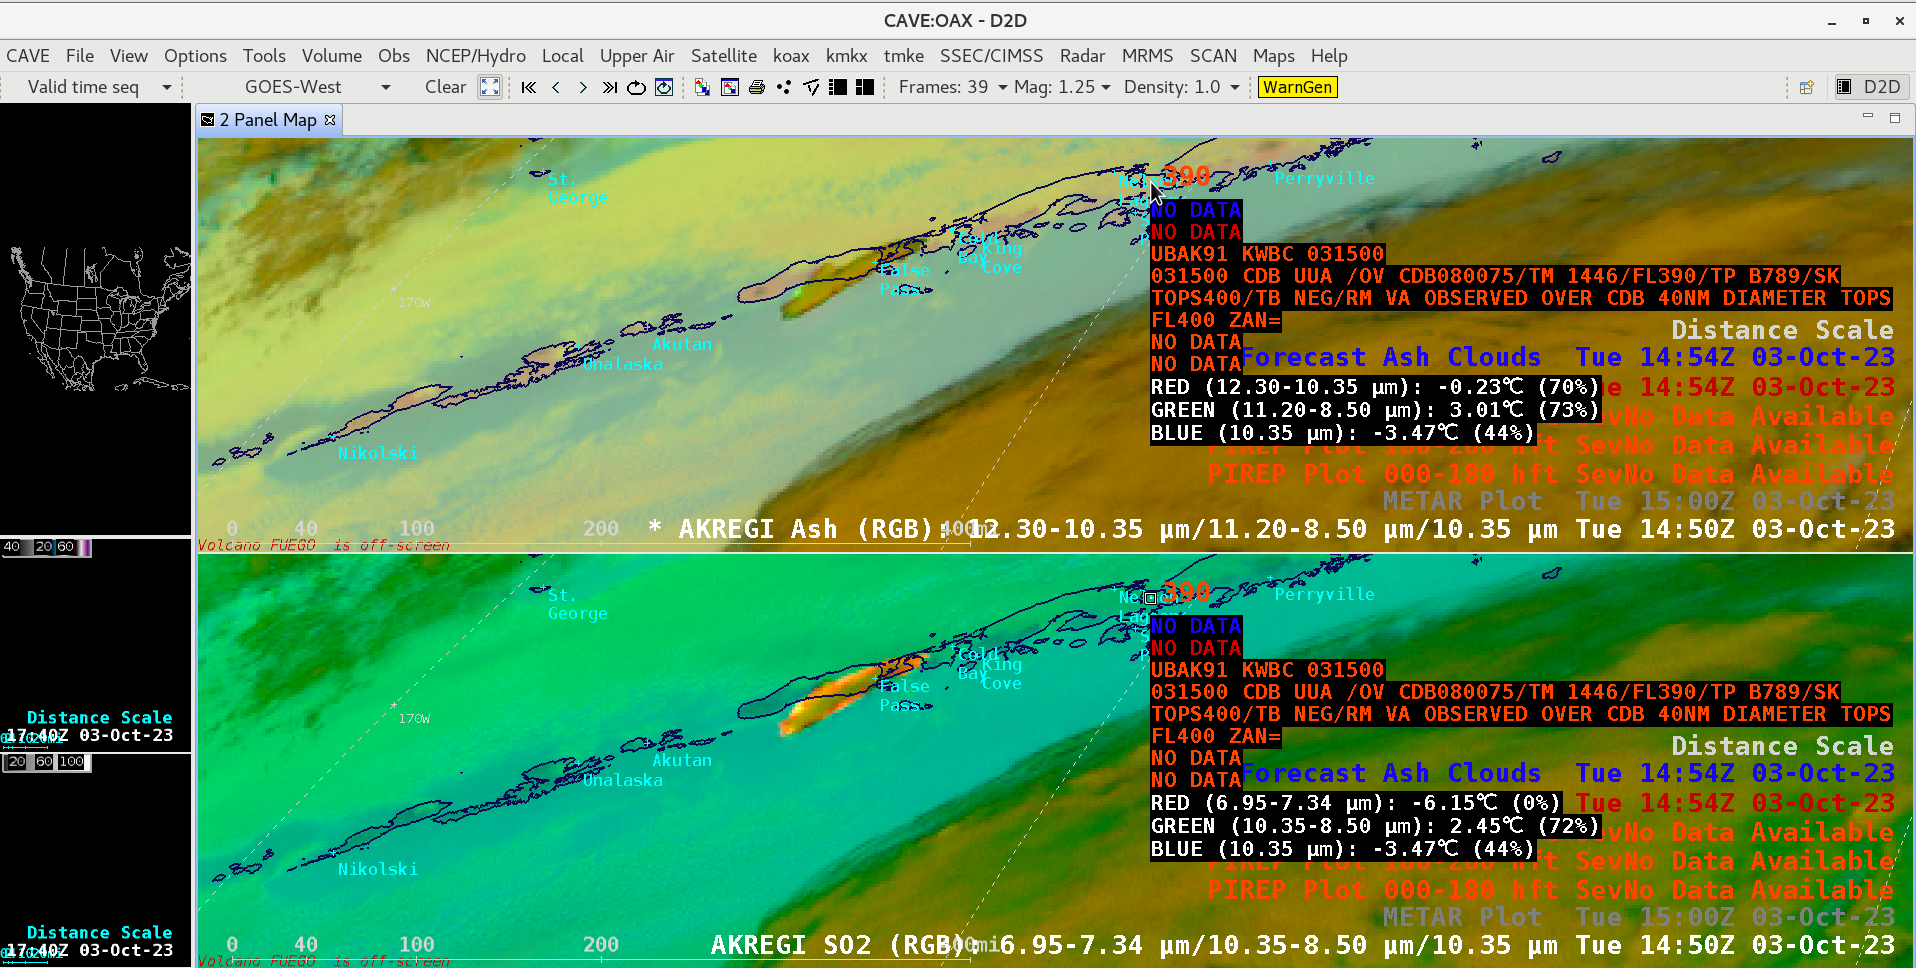
GOES-18 Ash RGB (top) and SO2 RGB (bottom) images at 1450 UTC, with cursor sampling of a of Pilot Report issued at 1446 UTC [click to enlarge]
In Nighttime Microphysics RGB + daytime True Color RGB images from the
CSPPGeoSphere site
(below), after sunrise the ash-rich portion of the volcanic cloud exhibited shades of tan to darker brown, as it moved to the south-southwest.
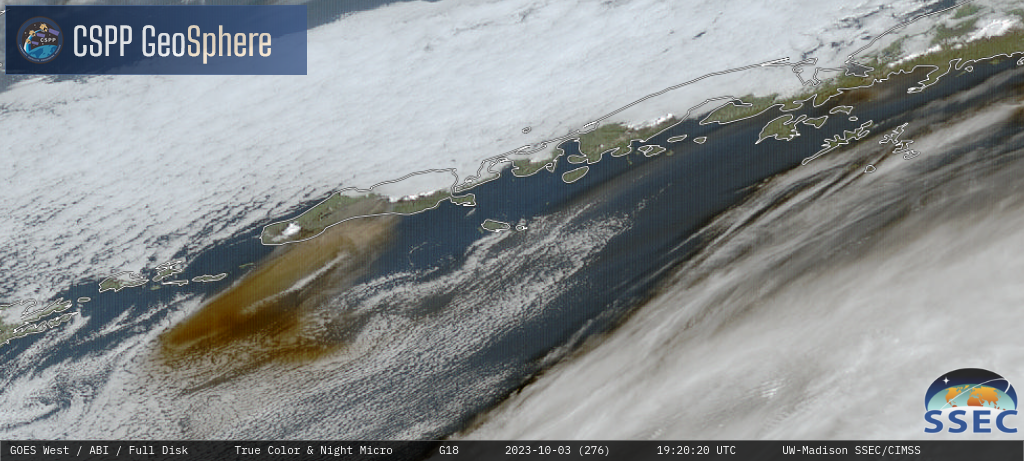
GOES-18 Nighttime Microphysics RGB + daytime True Color RGB images, from 1210-2140 UTC [click to play MP4 animation]
A radiometrically retrieved Volcanic Ash Cloud Height product from the
NOAA/CIMSS Volcanic Cloud Monitoring site
(below) indicated that parts of the volcanic cloud may have reached heights in the 18-20 km range (black enhancement) within 20 minutes of the eruption onset.
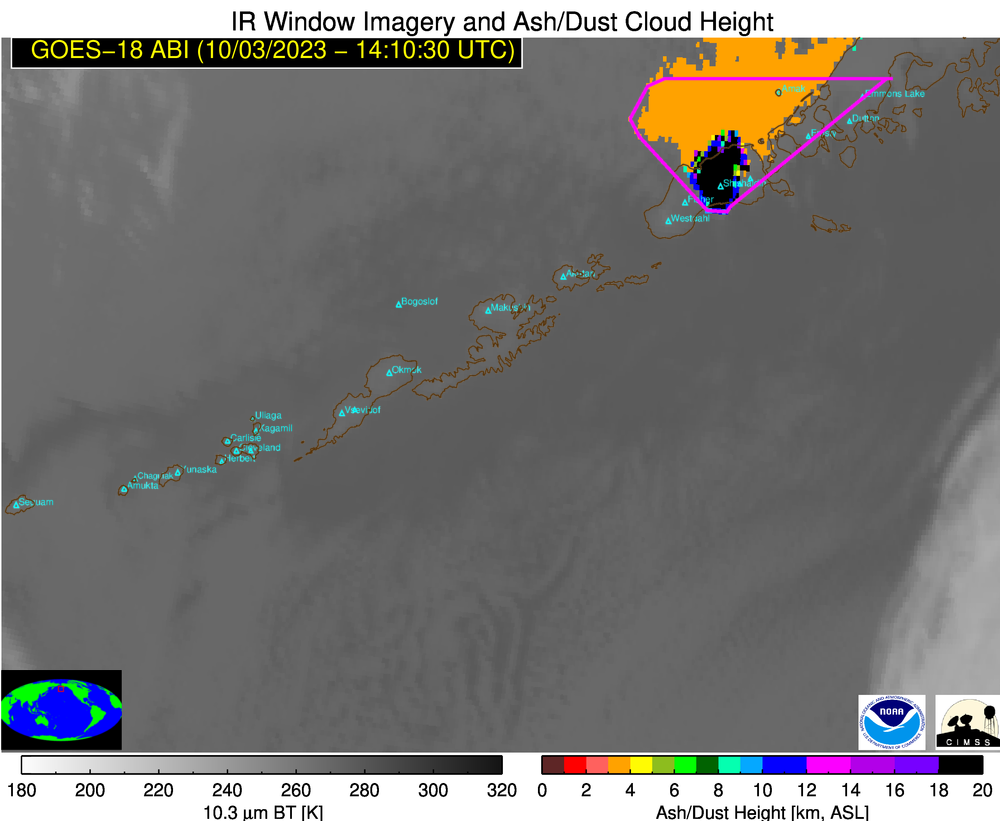
Volcanic Cloud Ash Height derived product, from 1330-1700 UTC [click to play animated GIF | MP4]
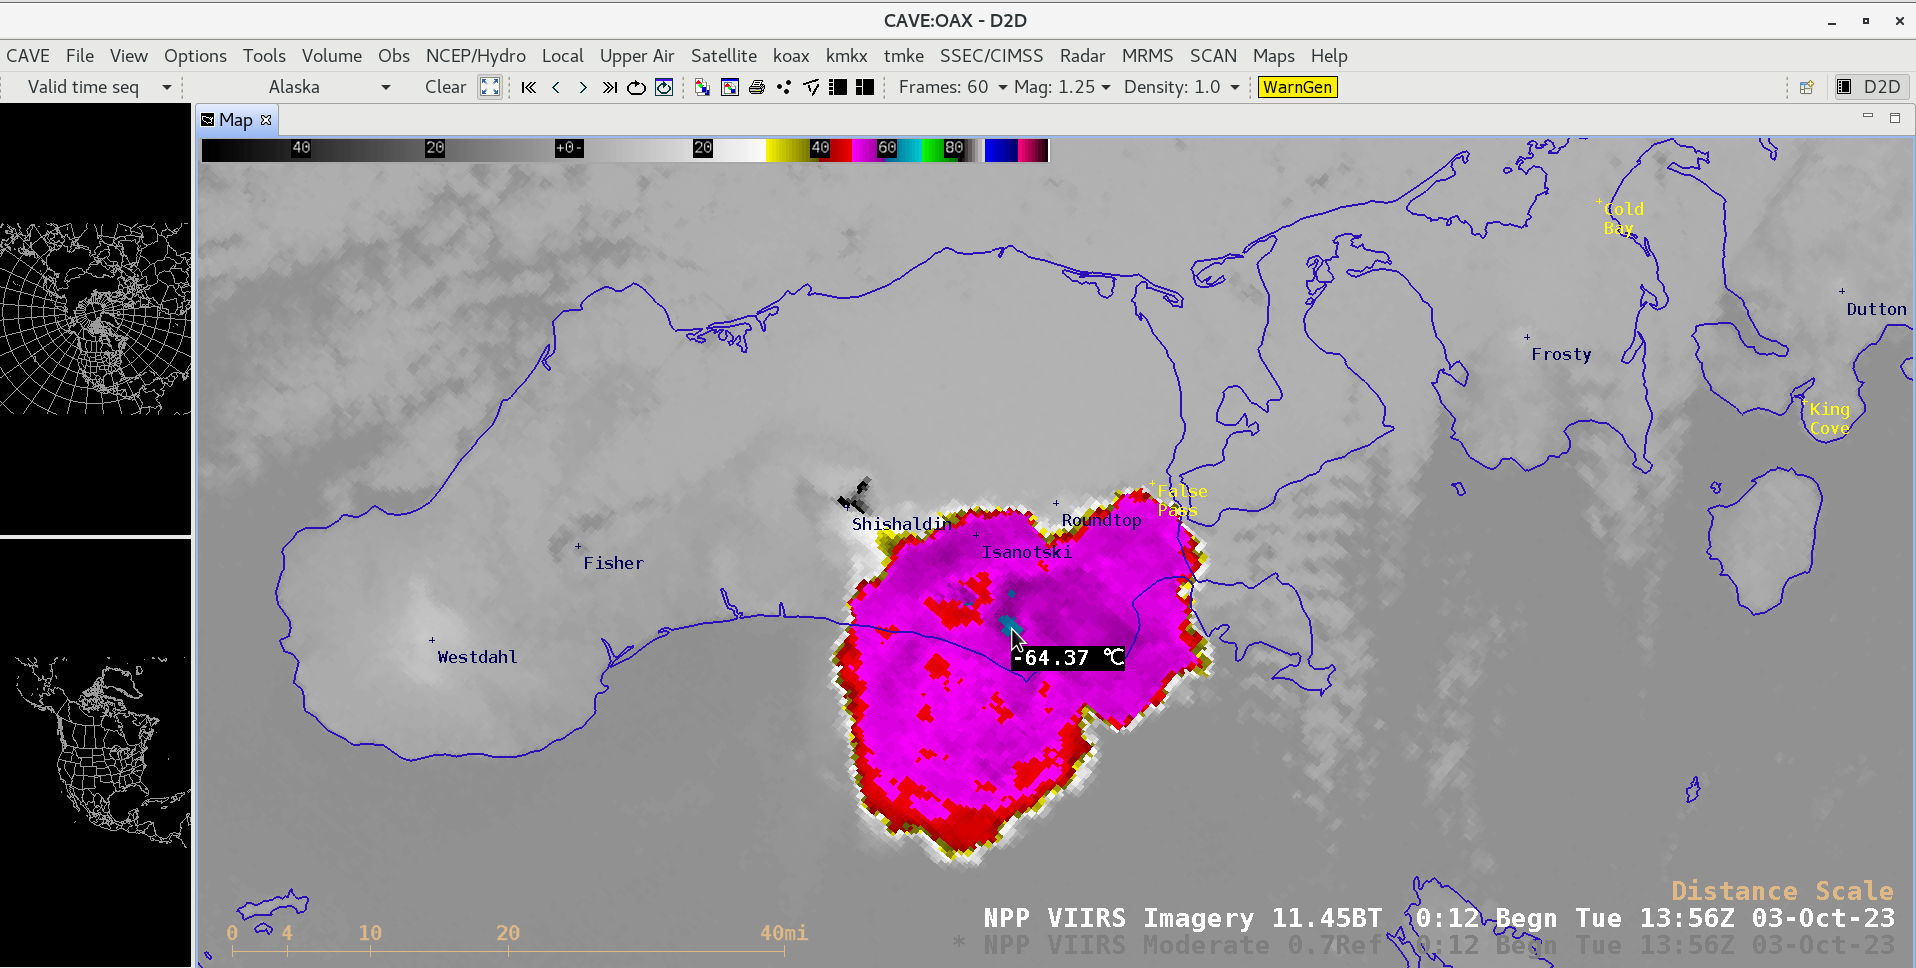
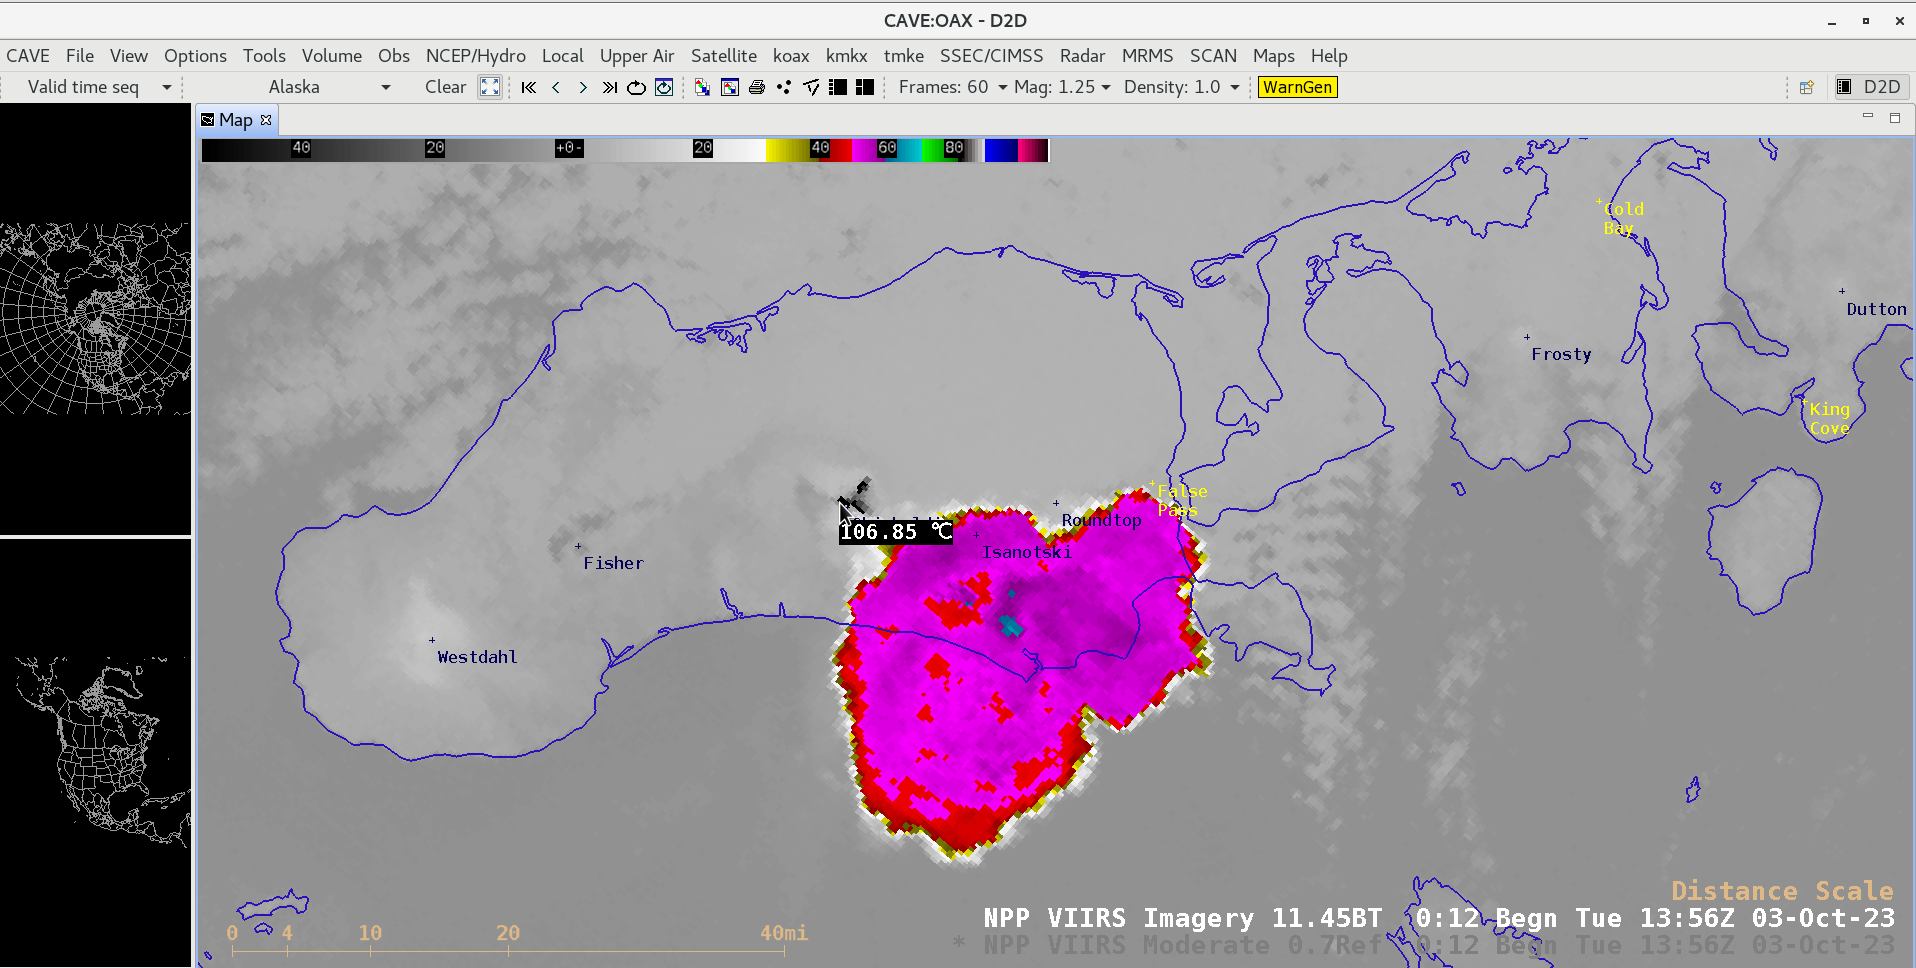
Suomi-NPP VIIRS Day/Night Band (0.7 µm) and Infrared Window (11.45 µm) images, valid at 1404 UTC [click to enlarge]
About 14 minutes after the explosive eruption began, a toggle between Suomi-NPP VIIRS Day/Night Band (0.7 µm) and Infrared Window (11.45 µm) images valid at
1404 UTC (above) revealed that the coldest cloud-top infrared brightness temperature was
-64.37ºC (cyan color enhancement) — while the hot lava flows spreading away from the summit of Shishaldin exhibited surface infrared brightness temperatures as high as
106.85ºC (darker black enhancement).
The -64.37ºC cloud-top infrared brightness temperature was indicative of a significant air parcel overshoot of the local tropopause — which was -50.5ºC at an altitude of 9292.4 m (30486.9 ft) according to 1200 UTC rawinsonde data from nearby Cold Bay, Alaska (below).
Plot of rawinsonde data from Cold Bay, Alaska at 1200 UTC [click to enlarge]
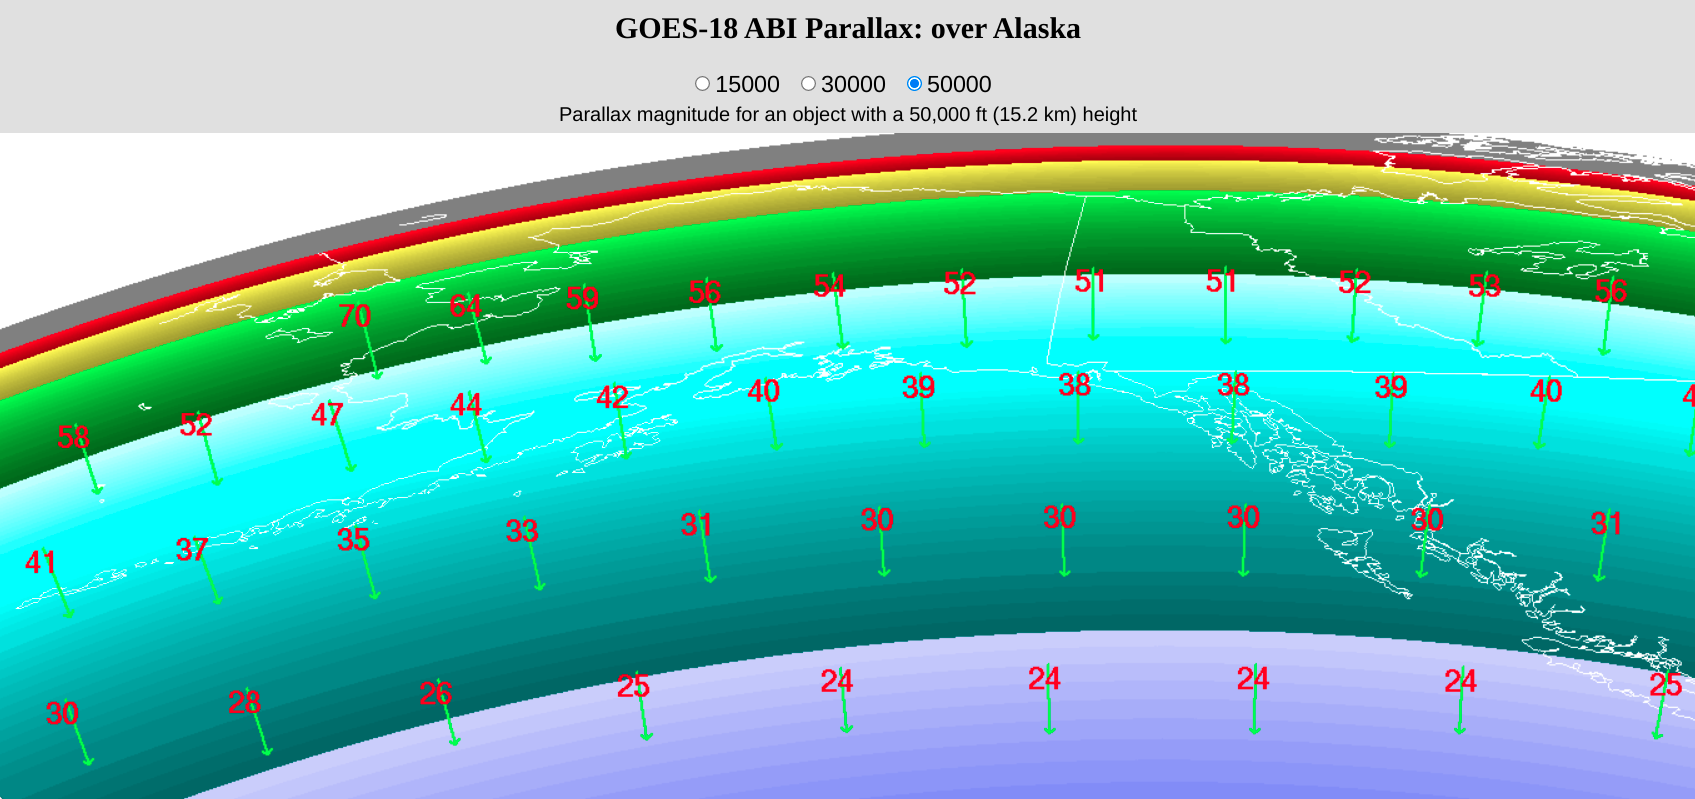
On a side note, a toggle between Infrared Window images from Suomi-NPP and GOES-18
(below) showed (1) the large northwest
parallax offset associated with GOES-18 imagery at such high latitudes, which would be about 35 km or 22 mi for a
50 kft cloud top feature in the vicinity of Shishaldin, and (2) the significantly colder cloud-top infrared brightness temperature sensed with the higher spatial resolution VIIRS instrument (375 m, vs the nominal 2 km at satellite sub-point for GOES-18 ABI).
Infrared Window images from Suomi-NPP (11.45 µm, valid at 1404 UTC) and GOES-18 (10.3 µm, valid at 1401 UTC) [click to enlarge]
View only this post
Read Less


