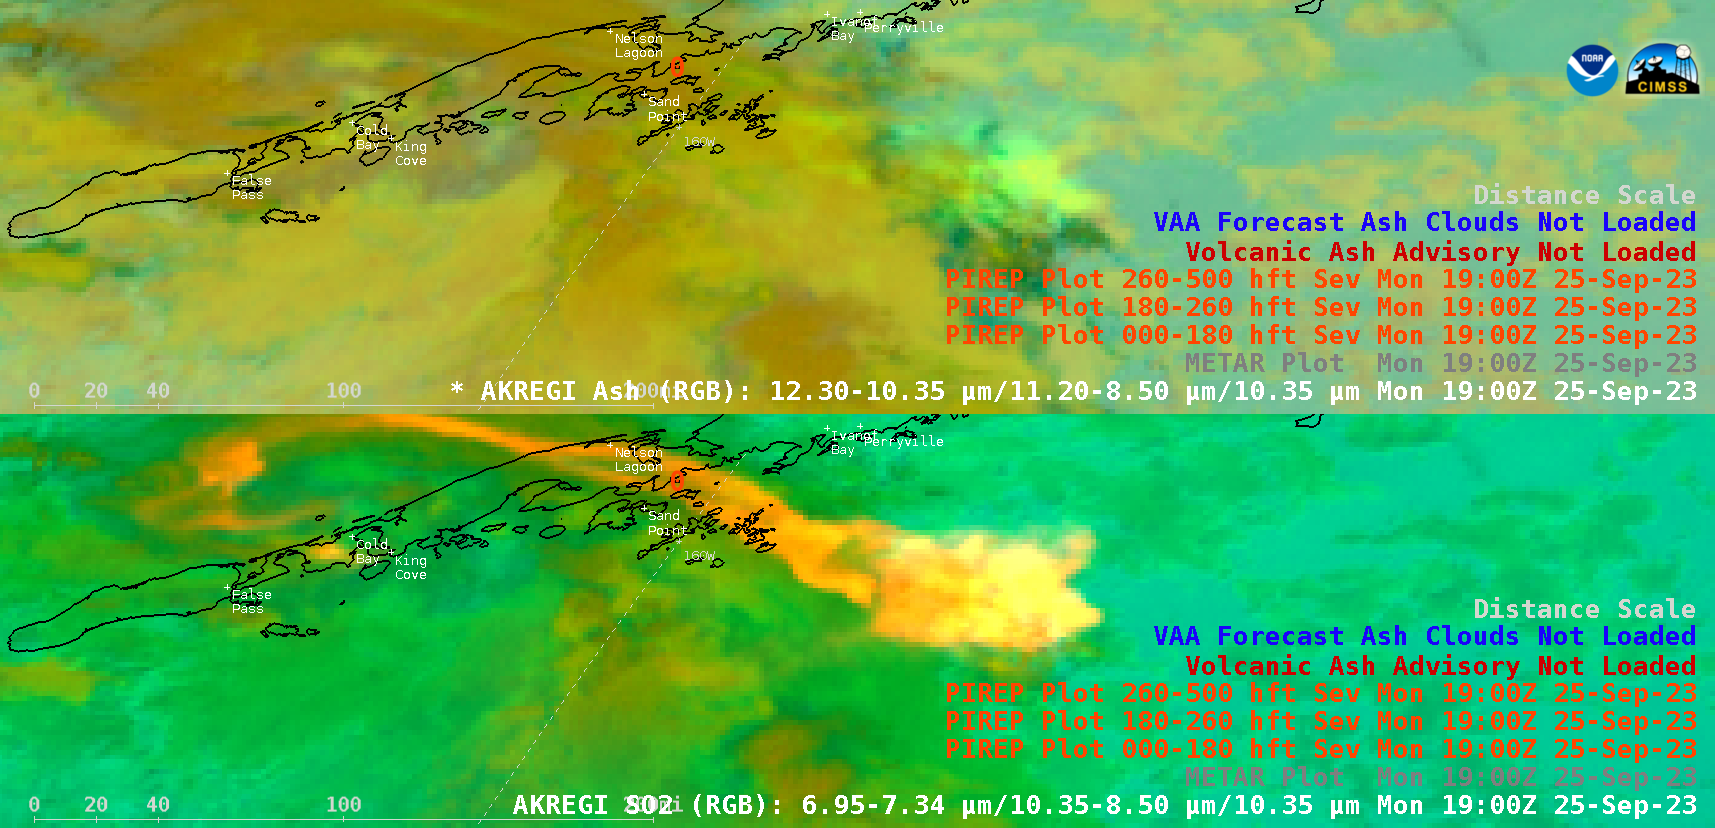
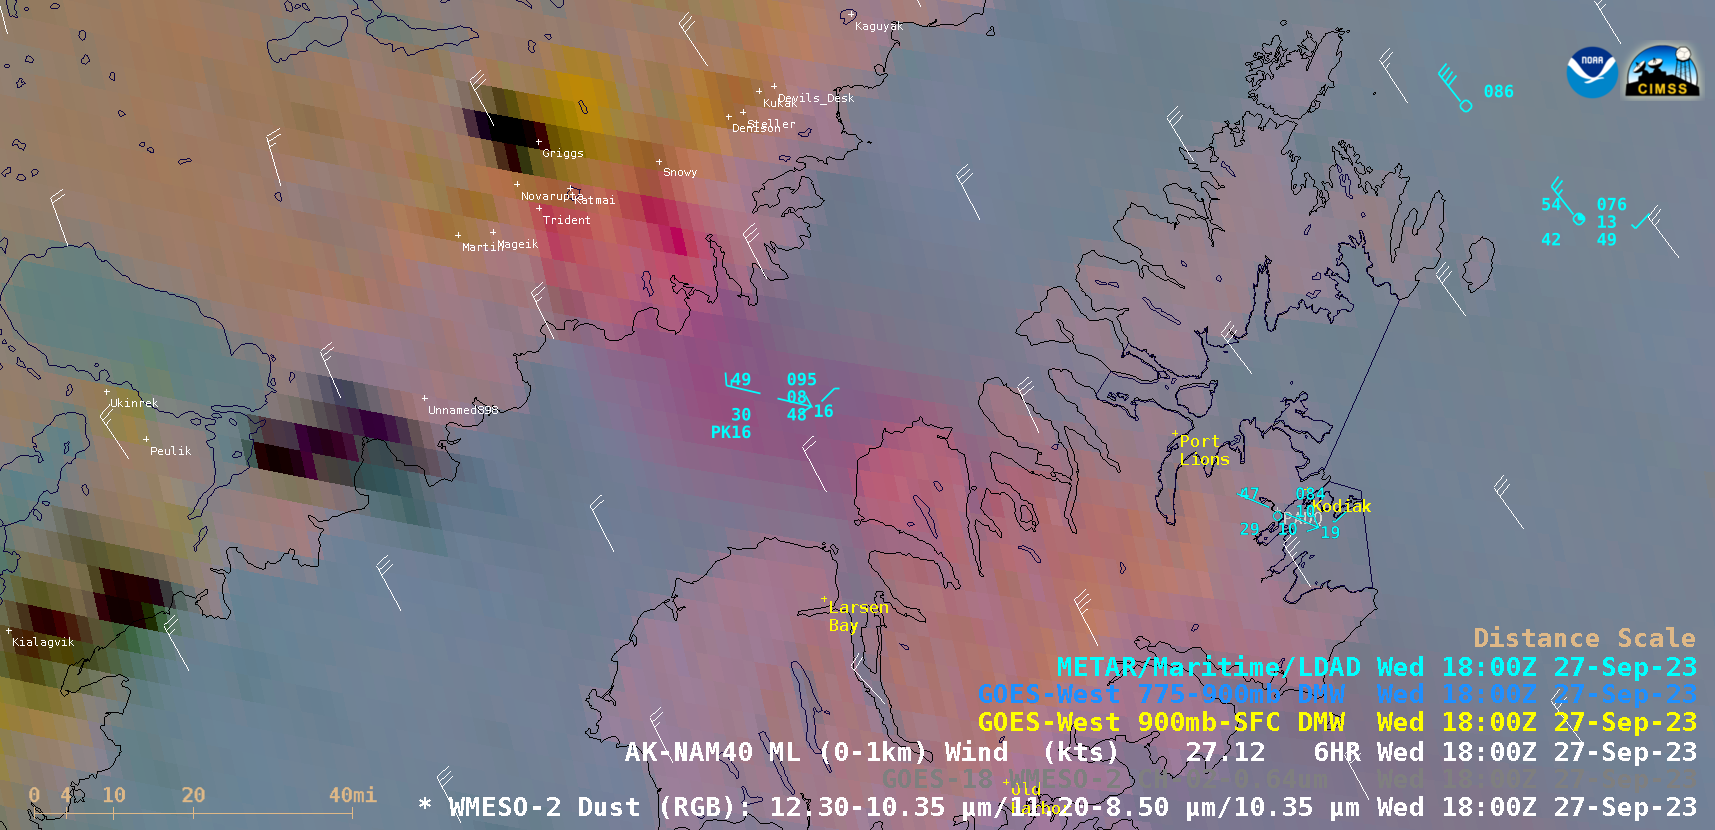
GOES-18 (GOES-West) SO2 RGB and Ash RGB images (above) showed the complex transport of a volcanic cloud (shades of yellow in the SO2 RGB imagery) produced by an explosive eruption of Mount Shishaldin that began around 1340 UTC on 25 September 2023. The bulk of the cloud drifted to the southeast, while another part wrapped cyclonically across the far... Read More

GOES-18 Ash RGB images (top) and SO2 RGB images (bottom), with plots of Pilot Reports and Volcanic Ash Advisory/Forecast polygons, from 1320-2200 UTC on 25 September [click to play animated GIF | MP4]
GOES-18
(GOES-West) SO2 RGB and
Ash RGB images
(above) showed the complex transport of a volcanic cloud (shades of yellow in the SO2 RGB imagery) produced by an explosive eruption of
Mount Shishaldin that began around 1340 UTC on 25 September 2023. The bulk of the cloud drifted to the southeast, while another part wrapped cyclonically across the far southeastern Bering Sea. There was also a small secondary eruption that began around 1610 UTC, sending a small volcanic cloud eastward (that moved just north of False Pass).
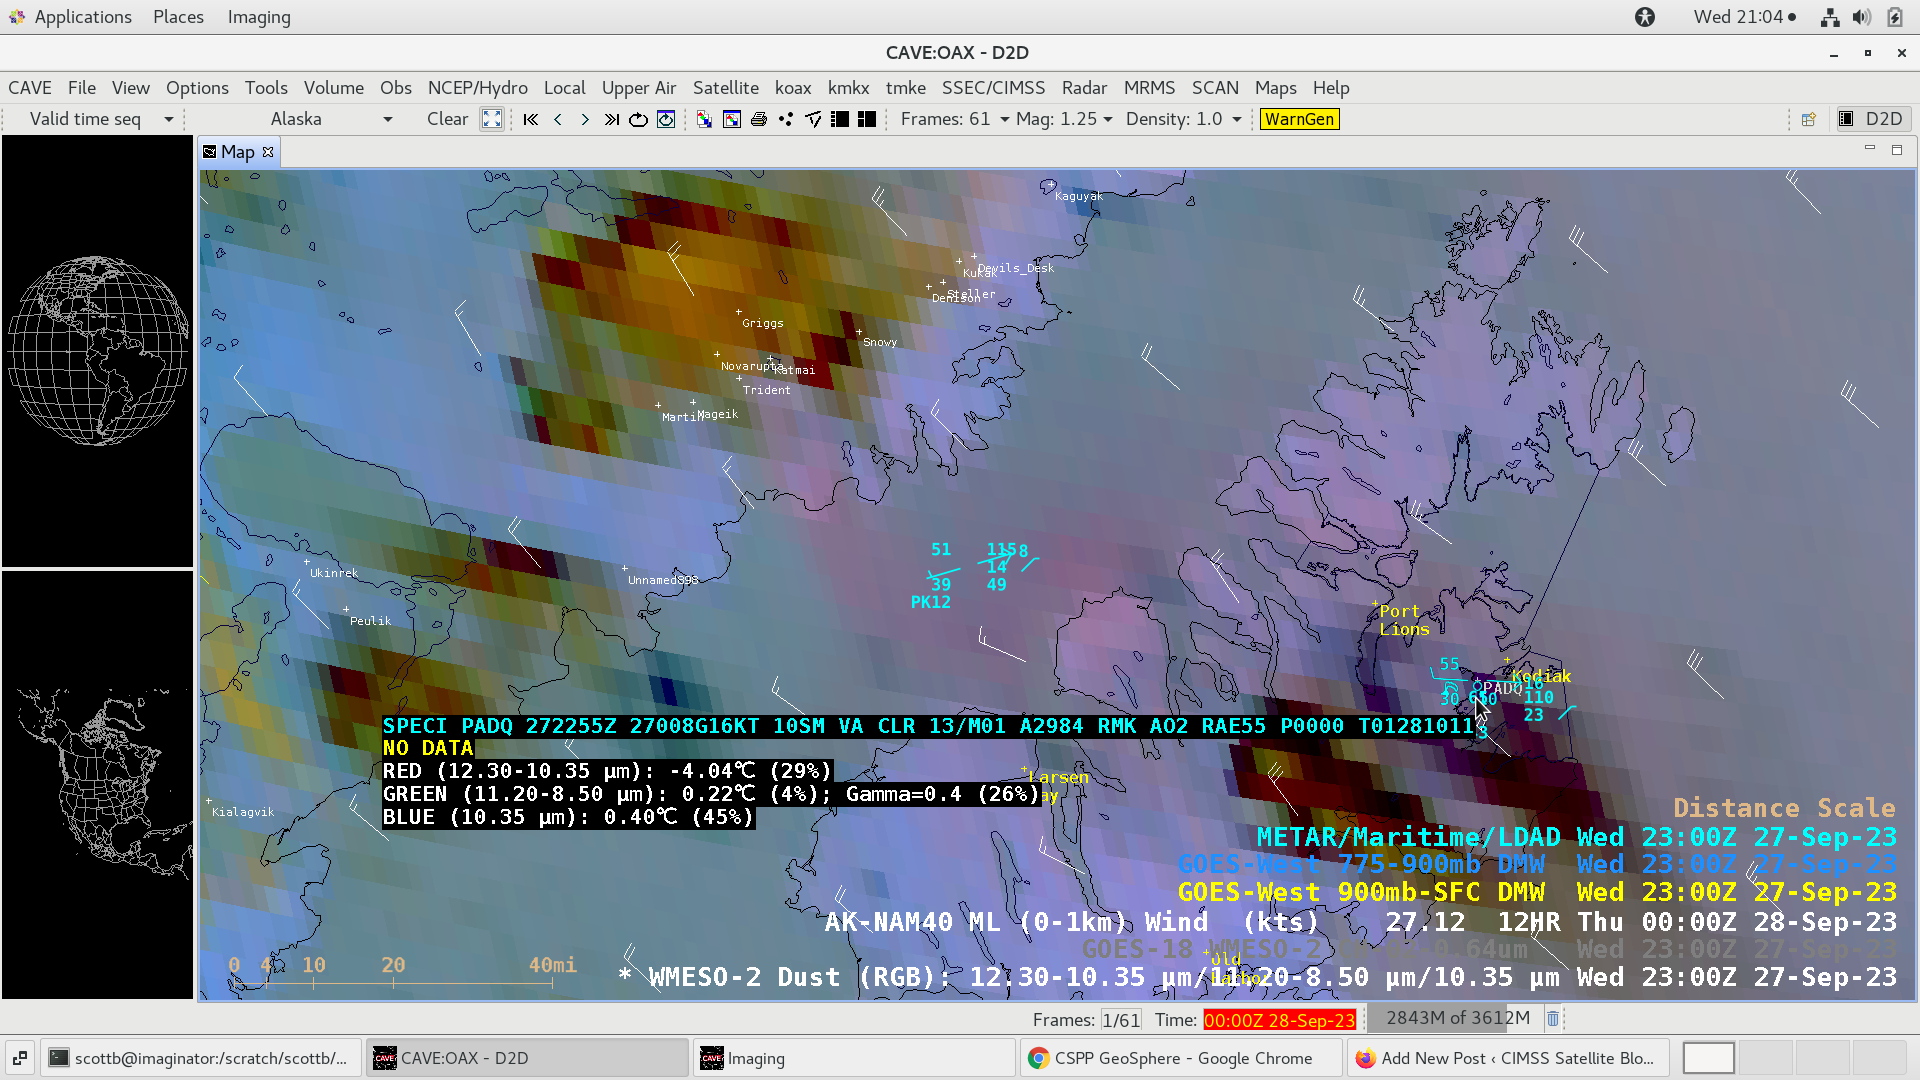
There were trace to minor amounts of volcanic ashfall reported in False Pass, King Cove, Cold Bay and Sand Point, occurring in conjunction with light rainfall. A 1912 UTC Pilot Report (PIREP) issued at Sand Point (below) mentioned that volcanic ash (VA) was falling in light rain (-RA), covering surfaces.
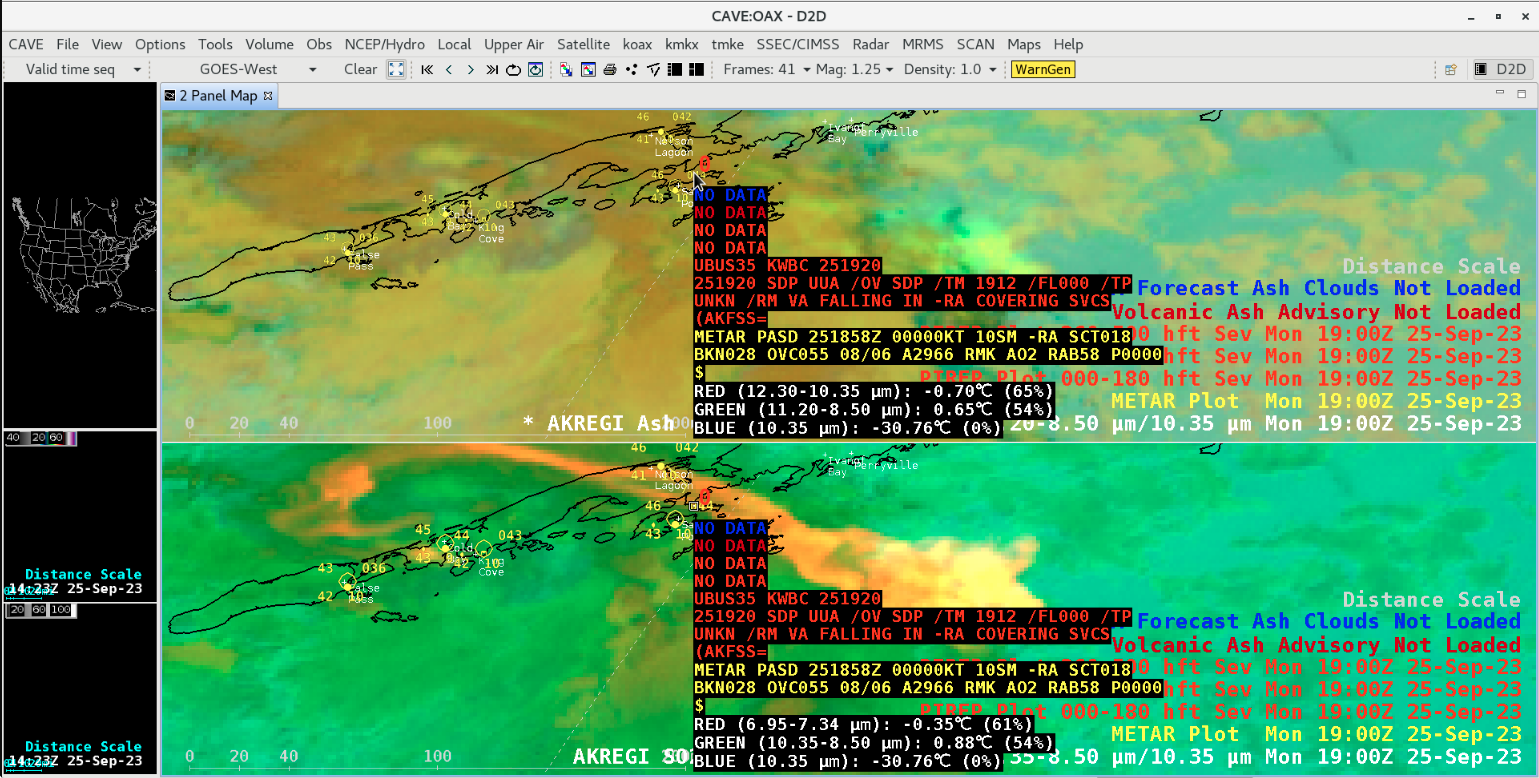
Cursor sampling of a PIREP issued at 1912 UTC (red text) [click to enlarge]
A radiometrically retrieved Volcanic Ash Height product from the
NOAA/CIMSS Volcanic Cloud Monitoring site
(below) indicated that parts of the volcanic cloud reached heights in the 18-20 km range.
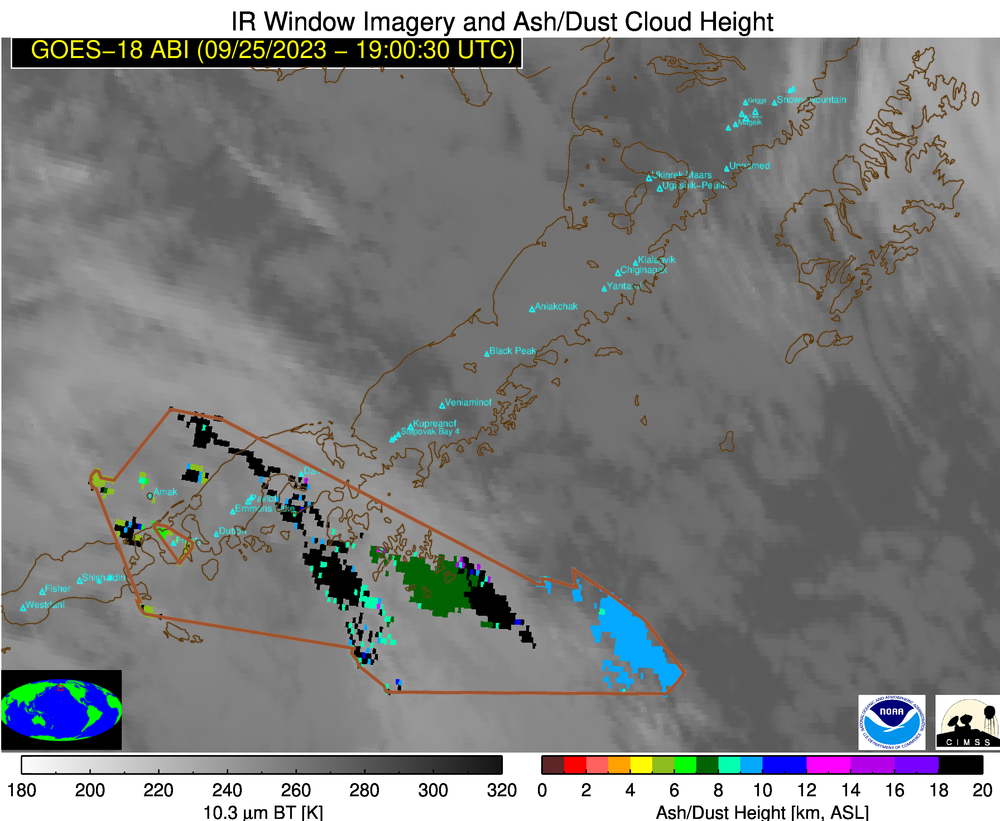
Volcanic Ash Height derived product [click to play animated GIF | MP4]
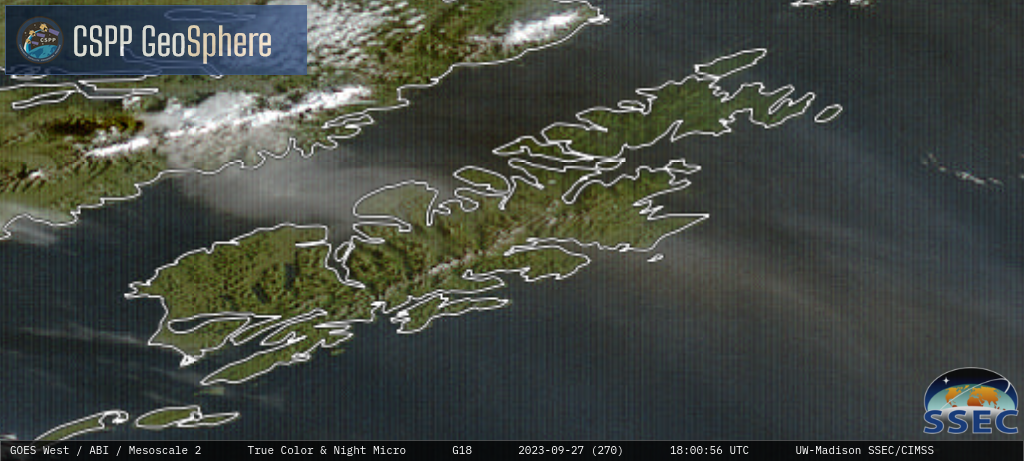
In Nighttime Microphysics RGB + daytime True Color RGB images from the
CSPPGeoSphere site
(below), after sunrise the leading edge of the southeast-moving volcanic cloud exhibited shades of tan to light brown (indicating significant ash content).
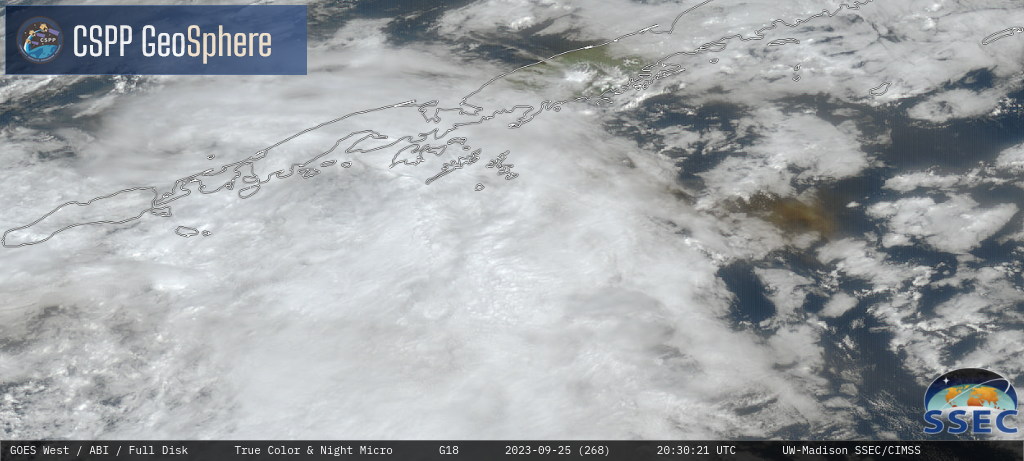
GOES-18 Nighttime Microphysics RGB + daytime True Color RGB images [click to play MP4 animation]
View only this post
Read Less


