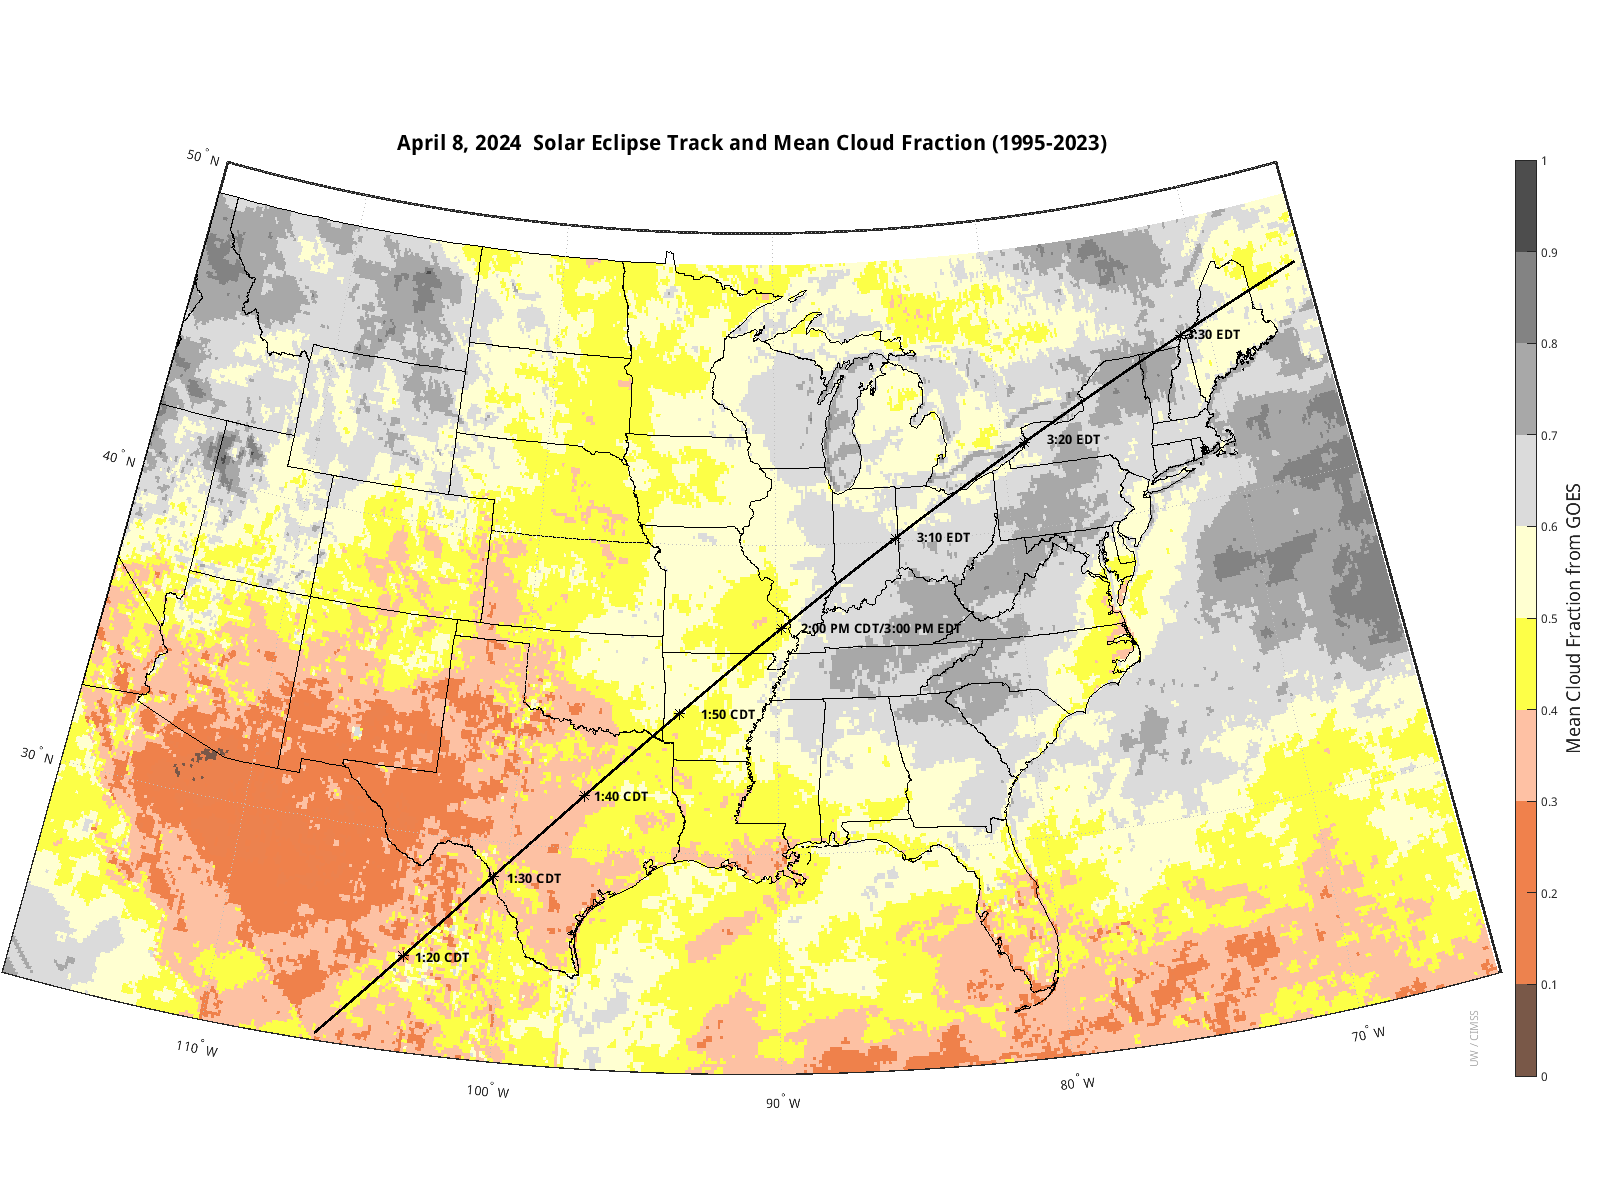
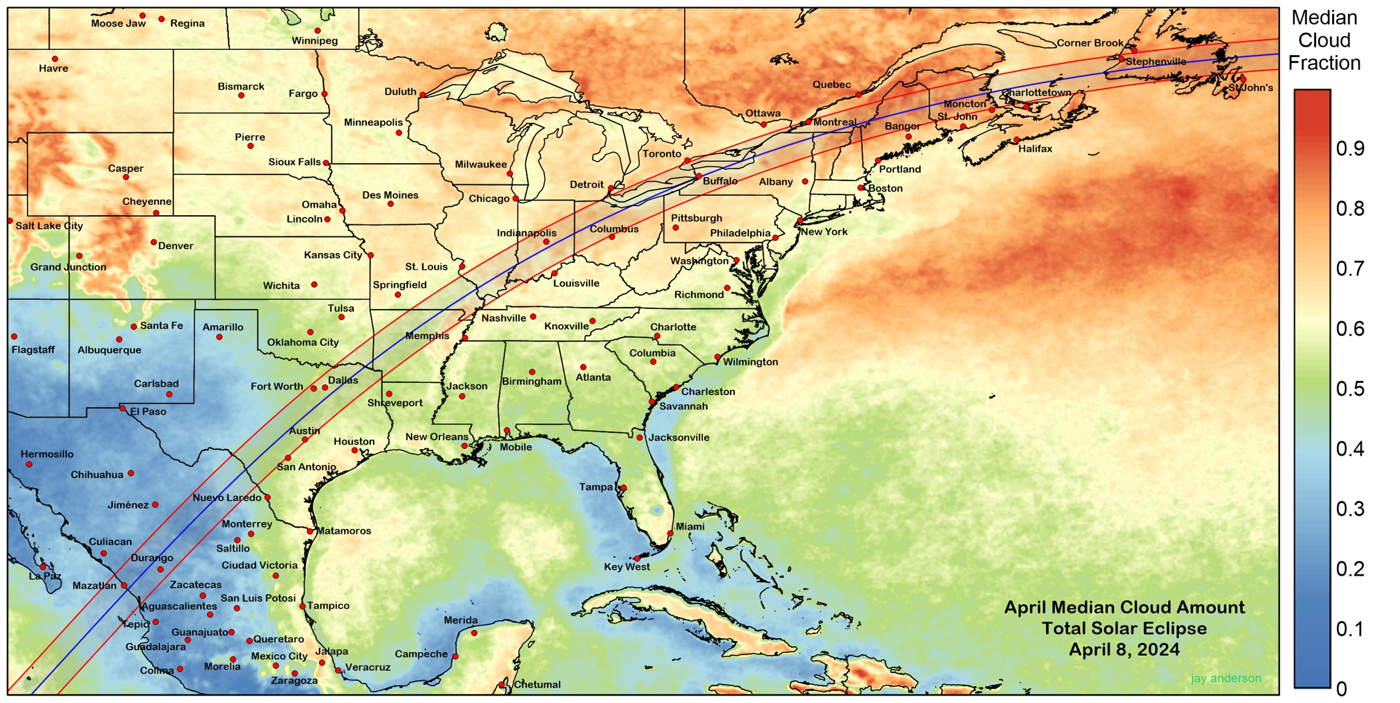
With the total solar eclipse occurring over parts of the contiguous U.S. on April 8, 2024, there are many wondering what the cloud cover might be on that day. As anticipation builds, we decided to look at the past 28 years of GOES cloud products on April 8. This is not a forecast, but a look back at the cloud climatology. Every spot on the eclipse path has had April 8ths where it was cloudy and every spot has had April 8ths where it was clear. So while you may choose to travel to southwest Texas to see the eclipse because that gives you the best chance historically at clear skies, there is going to be some uncertainty involved for eclipse viewers all along the path as to whether or not they’ll get a clear-sky view of the event. The potentially clearest areas still have at least 30% chance of being cloudy on April 8 based on the historical record. Of course the climatology does not have days with a total solar eclipse, and we have seen in earlier events how some fair-weather cumulus cloud coverage is briefly reduced as a result of the reduced incoming solar radiation. Still, an eclipse can be a fun event if you’re on the path even when it’s partly cloudy. This is an opportunity to discuss the science related to cloud cover on the upcoming eclipse day.
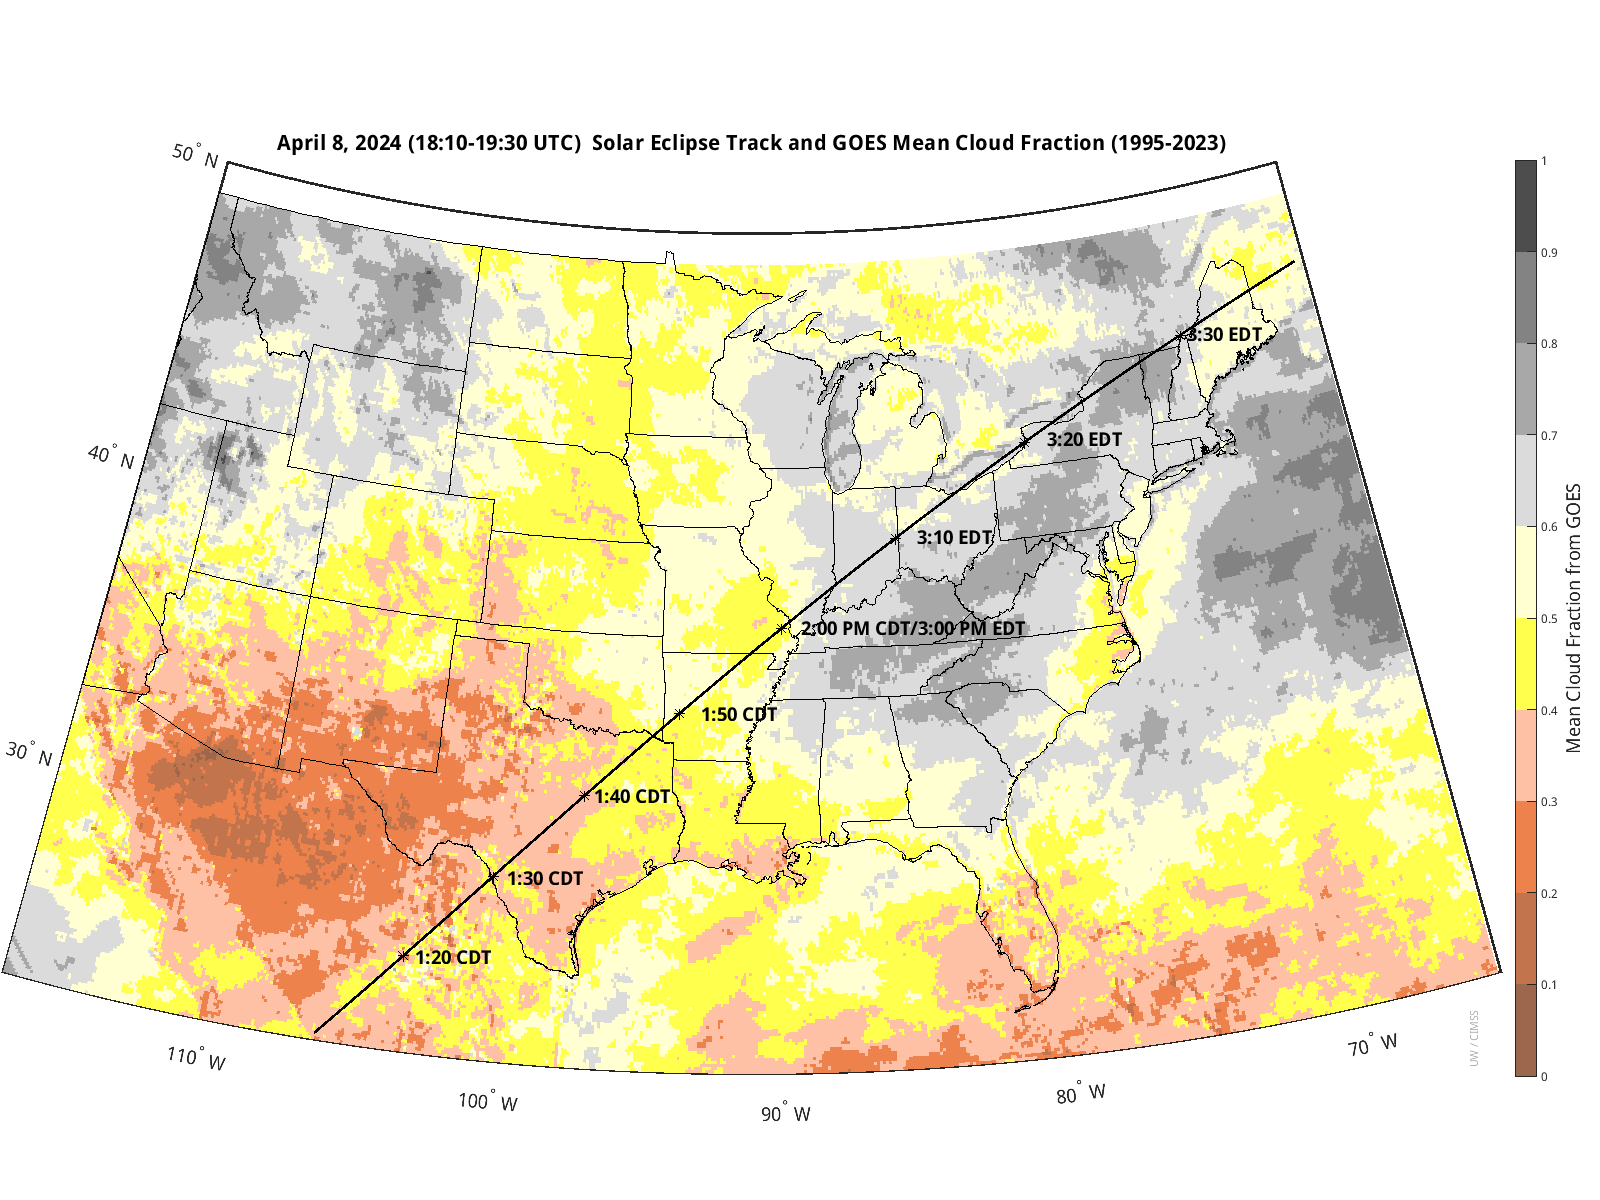
For comparison, see similar images derived from MODIS data and the ERA-5 (re-analysis). In general, climatologically it is more clear in Texas and less clear in New England in early April. Of course that is not a forecast for what will actually happen in 2024.
More information
There is much more information about this event, including this CIMSS Satellite Blog post, and the NWS and NOAA Satellites.
H/T
This image was made by M. Gunshor, UW/CIMSS (who also helped write this blog post) with NOAA geostationary cloud files processed by S. Wanzong, UW/CIMSS, with input files from UW-Madison, SSEC; SSEC Data Services. Thanks also for the Eclipse Predictions by Fred Espenak, NASA’s GSFC. T. Schmit works for NOAA/NESDIS/STAR and is stationed in Madison, WI.
View only this post Read Less
