Wildfires in Quebec (which eventually produced pyrocumulonimbus clouds)

GOES-16 Shortwave Infrared (3.9 µm) images, 02-04 June [click to play animated GIF | MP4]
The GOES-16 Fire Power derived product during that same 3-day period is shown below — the hottest fires exhibited Fire Power values as high as 3600 MW. The Fire Power derived product is a component of the GOES Fire Detection and Characterization Algorithm (FDCA).
GOES-16 Fire Power derived product, 02-04 June [click to play animated GIF | MP4]
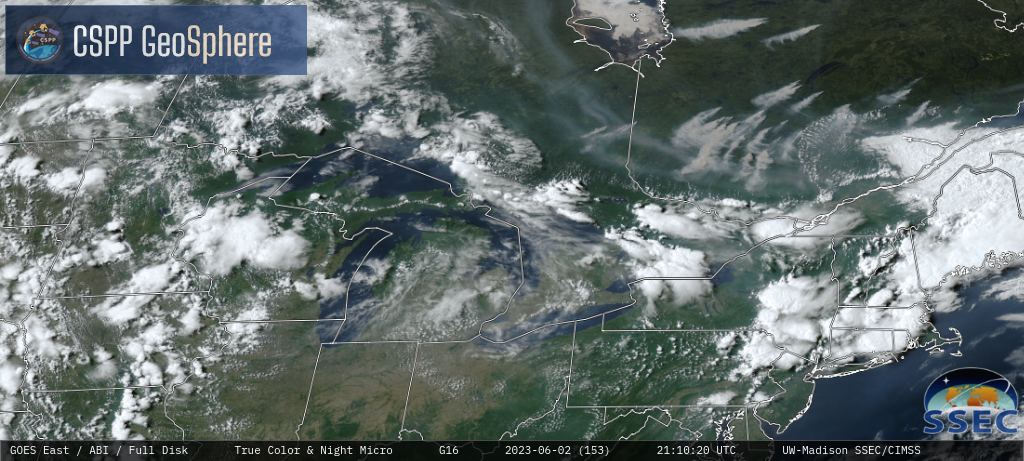
GOES-16 True Color RGB images + Nighttime Microphysics RGB images, 02-04 June [click to play MP4 animation]
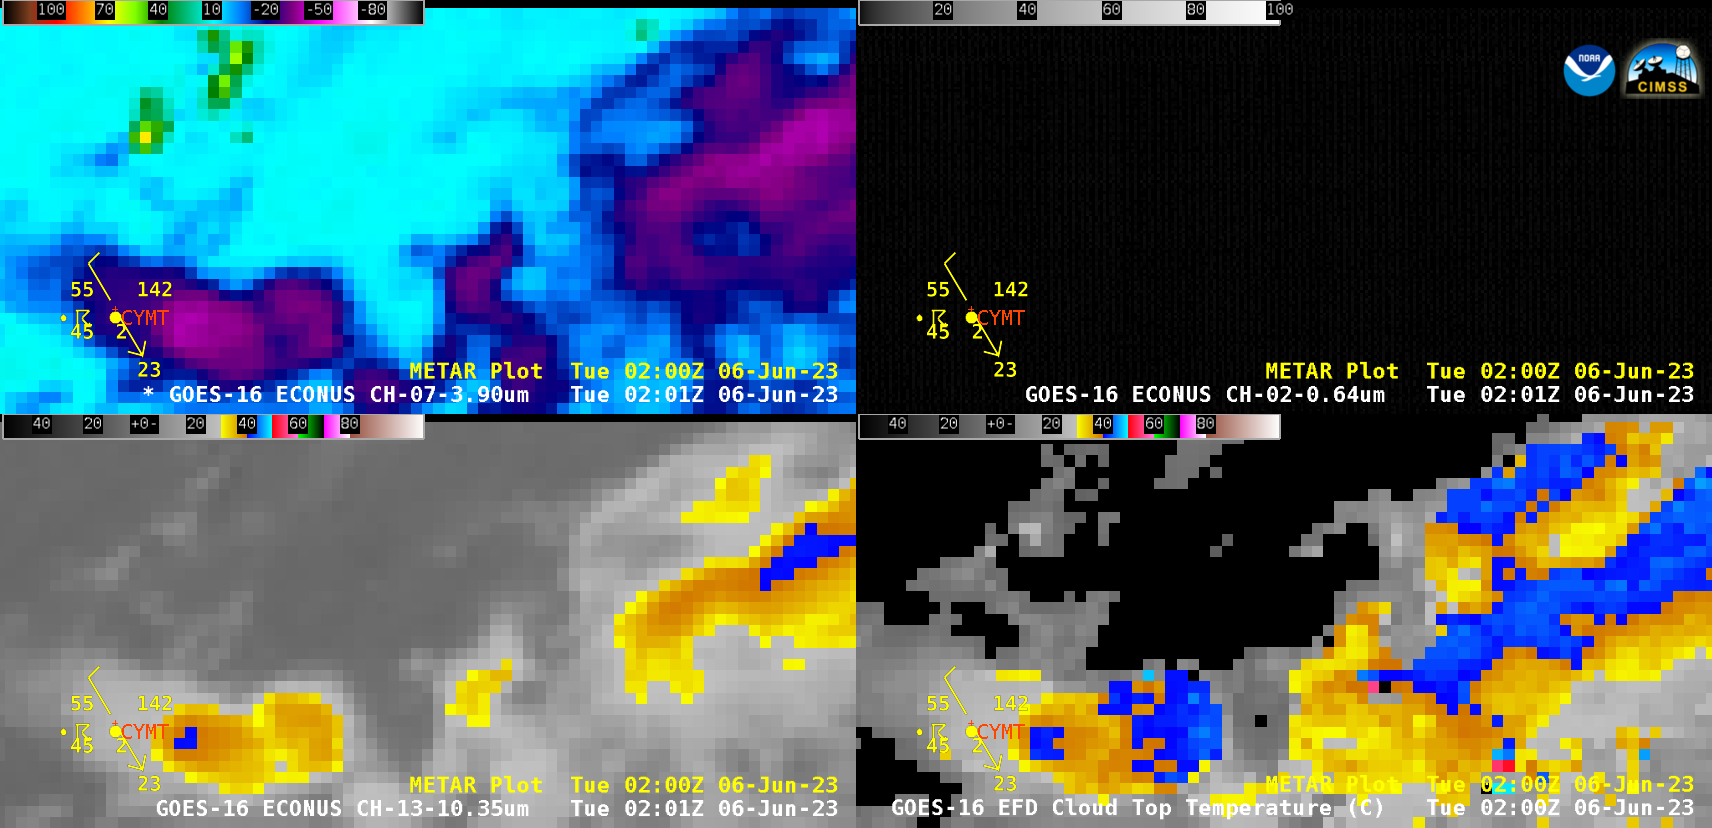
===== 05 June Update =====
GOES-16 Shortwave Infrared (3.9 µm, top left), “Red” Visible (0.64 µm, top right), “Clean” Infrared Window (10.3 µm, bottom left) and Cloud Top Temperature derived product (bottom right) [click to play animated GIF | MP4]
GOES-16 Visible images combined with the Fire Power derived product (below) include an overlay of GLM Flash Extent Density — which showed that some lightning activity was associated with these pyroCb clouds. In fact, shortly after sunset a thunderstorm was reported in the vicinity of CYMT as the pyroCb cloud drifted just east of the site at 0200 UTC. In addition, smoke from the nearby pyroCb-producing wildfire briefly reduced the surface visibility to 2-1/4 miles at CYMT (plot of surface observations).
GOES-16 “Red” Visible (0.64 µm) images + Fire Power derived product, with/without an overlay of GLM Flash Extent Density [click to play animated GIF | MP4]