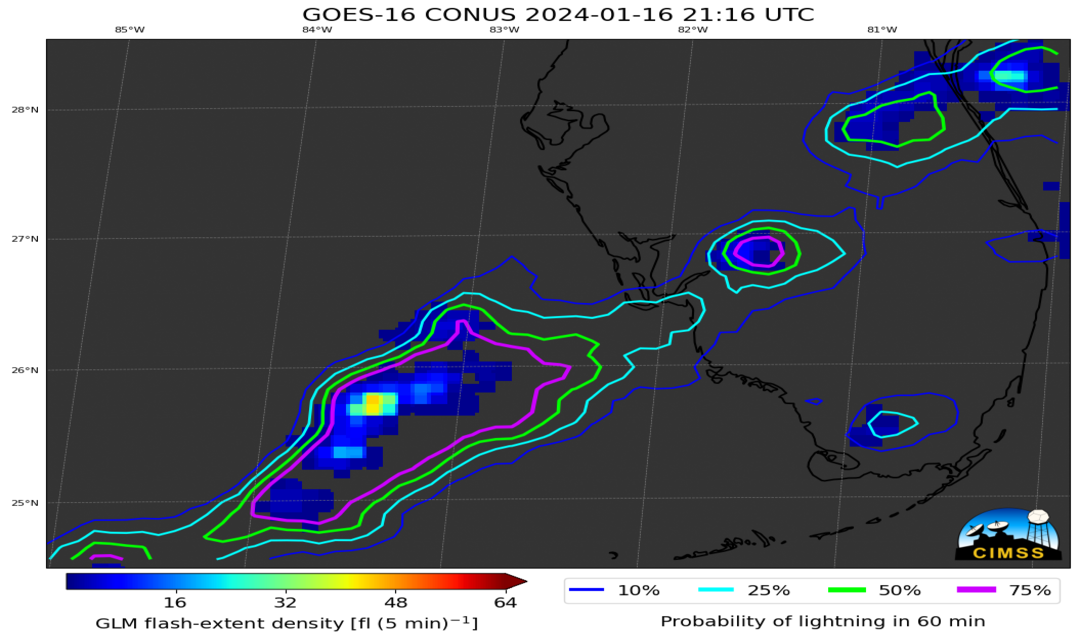
LightningCast probability fields are routinely produced at CIMSS and incorporated into a RealEarth display (LightningCast probability fields are also available in some National Weather Service AWIPS machines). An example of LightningCast is shown below over Southern Florida. Contours show the probability of a GLM observation of lightning within the next 60 minutes: 10% (Blue), 20% (Cyan), 50% (Green), 75% (Magenta).
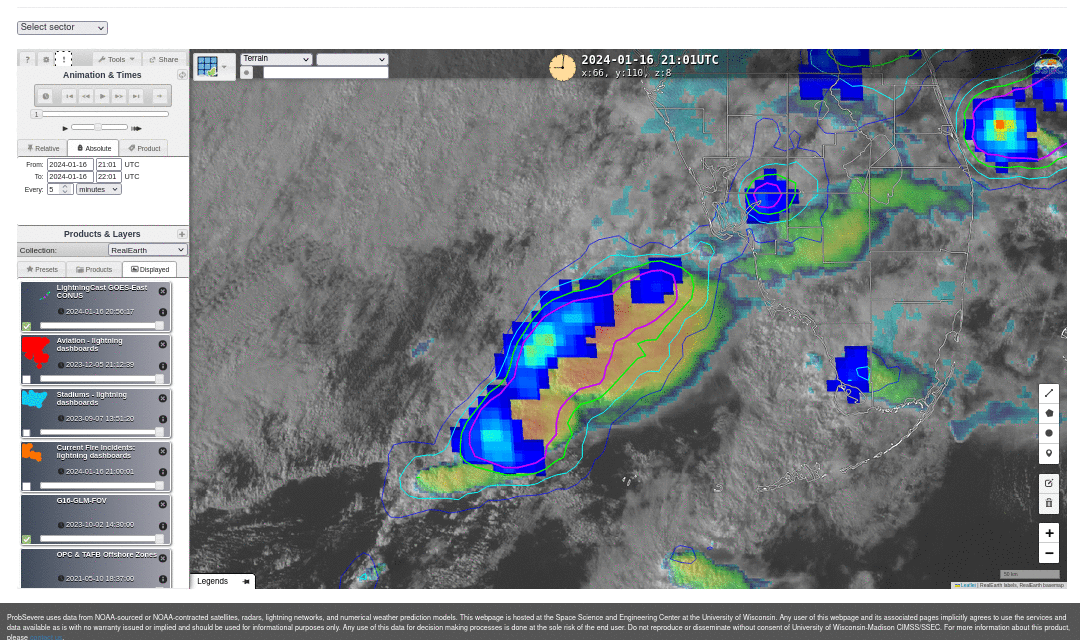
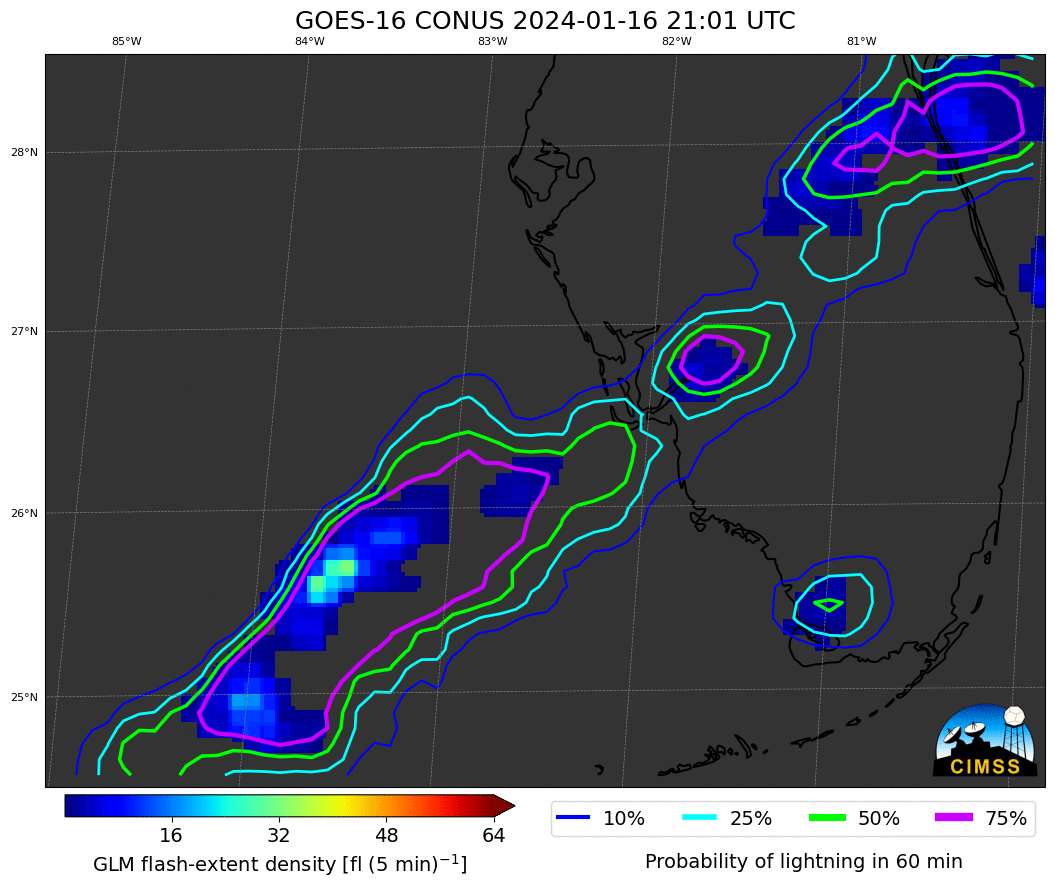
Scientists/Programmers at CIMSS are working on a CSPP Geo package that will create LightningCast probability fields, both current and historical. The software has the ability to subsect data, so full-disk (or full-CONUS for GOES-16 or full-PACUS for GOES-18) imagery need not be created. An example of the output for the same times and location as the RealEarth display is shown below.
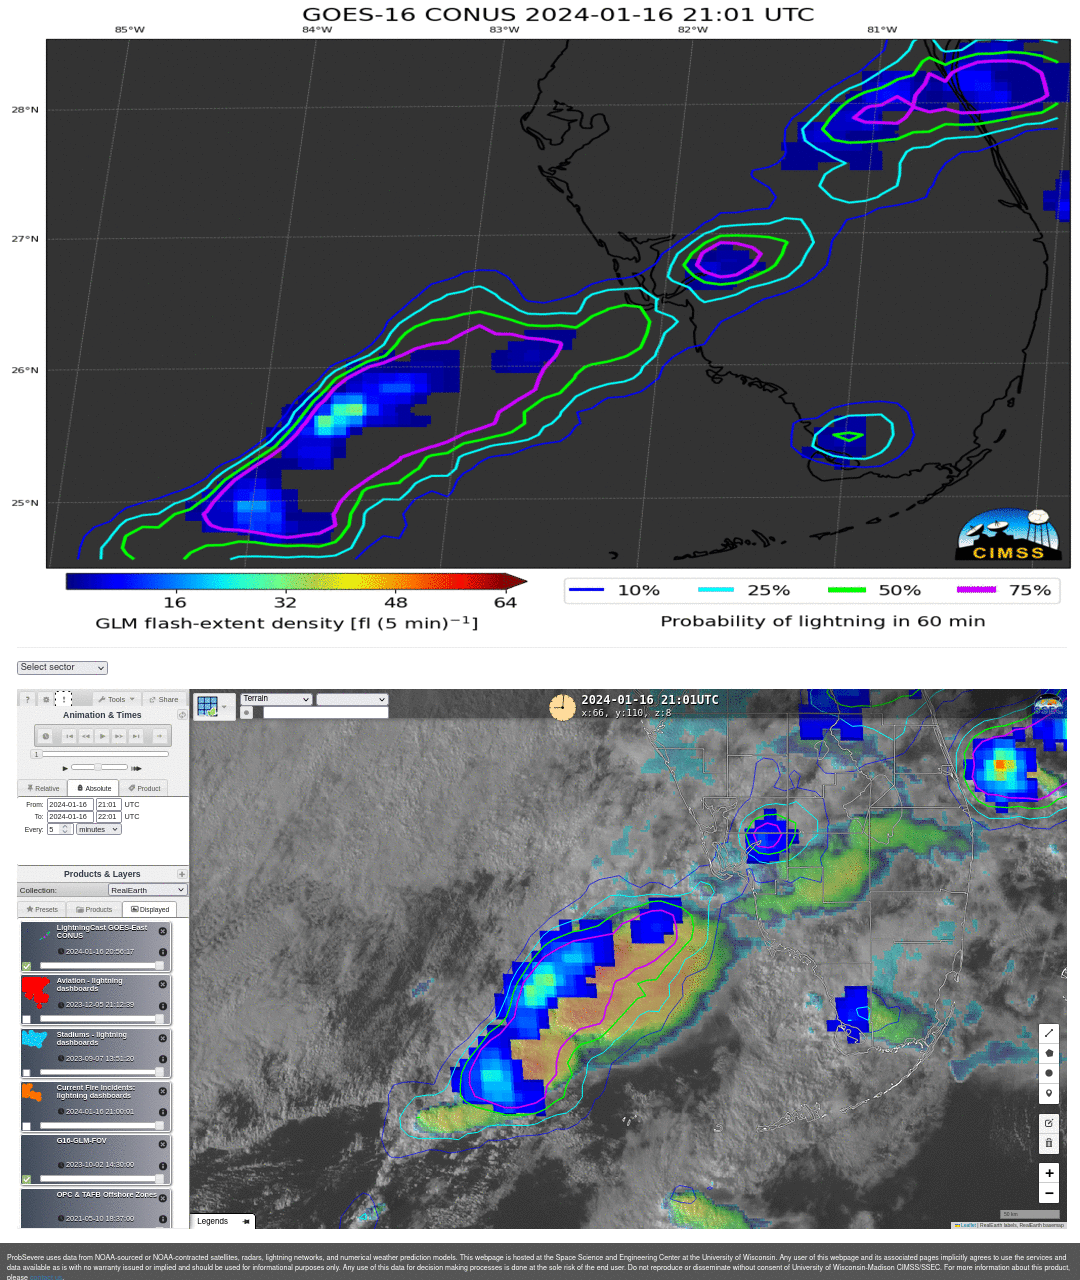
The animation below stacks both the CSPPGeo and RealEarth output. There are minor differences that are being investigated.
If you are at the AMS 2024 Meeting in Baltimore at the end of January, you can learn more about LighningCast at this talk on Thursday, 4:45-5 PM, in room 336. A LightningCast Probability QuickGuide is available here.
View only this post Read Less
