
A toggle between NOAA-20 VIIRS Day/Night Band and Infrared Window images valid at 0827 UTC (2:27 AM local time) on 22 January 2024 (above) showed an opening of the Kivalliq Polynya along the northwest coast of Hudson Bay — which was the result of a period of strong offshore winds (Arviat Airport CYEK observations),... Read More
NOAA-20 VIIRS Day/Night Band (0.7 µm) and Infrared Window (11.45 µm) images, valid at 0827 UTC [click to enlarge]
A toggle between NOAA-20 VIIRS Day/Night Band and Infrared Window images valid at 0827 UTC (2:27 AM local time) on 22 January 2024
(above) showed an opening of the
Kivalliq Polynya along the northwest coast of Hudson Bay — which was the result of a period of strong offshore winds (
Arviat Airport CYEK observations), which tend to push thicker first year ice away from the Nunavut and Manitoba coast. With cold arctic air blowing across the polynya, a layer of thin ice quickly begins to grow where the thicker ice was displaced.
During the following daytime hours, a comparison of NOAA-20 VIIRS Visible, Near-Infrared and Infrared Window images valid at 1820 UTC (below) displayed the lower reflectance of the polynya ice in Visible imagery (which was also evident, via reflected moonlight, in the earlier Day/Night Band image) — along with horizontal convective rolls in the Near-Infrared image, highlighting bands of blowing snow moving east-southeastward across Hudson Bay.

NOAA-20 VIIRS Visible (0.64 µm), Near-Infrared (1.61 µm) and Infrared Window (11.45 µm) images, valid at 1820 UTC [click to enlarge]
In a toggle between NOAA-20 VIIRS Visible and ATMS MiRS Sea Ice Concentration images
(below) the Sea Ice Concentration within the polynya was as low as 88% (darker red pixels).
NOAA-20 VIIRS Visible (0.64 µm) and ATMS MiRS Sea Ice Concentration images, valid at 1820 UTC [click to enlarge]
Suomi-NPP VIIRS Ice Surface Temperature (IST) and Sea Ice Concentration (SIC) products
(below) displayed gradients in those parameters within the polynya, with warmer IST and lower SIC values closer to the coast. The IST gradient was more notable, being about 10 K warmer near the coast.
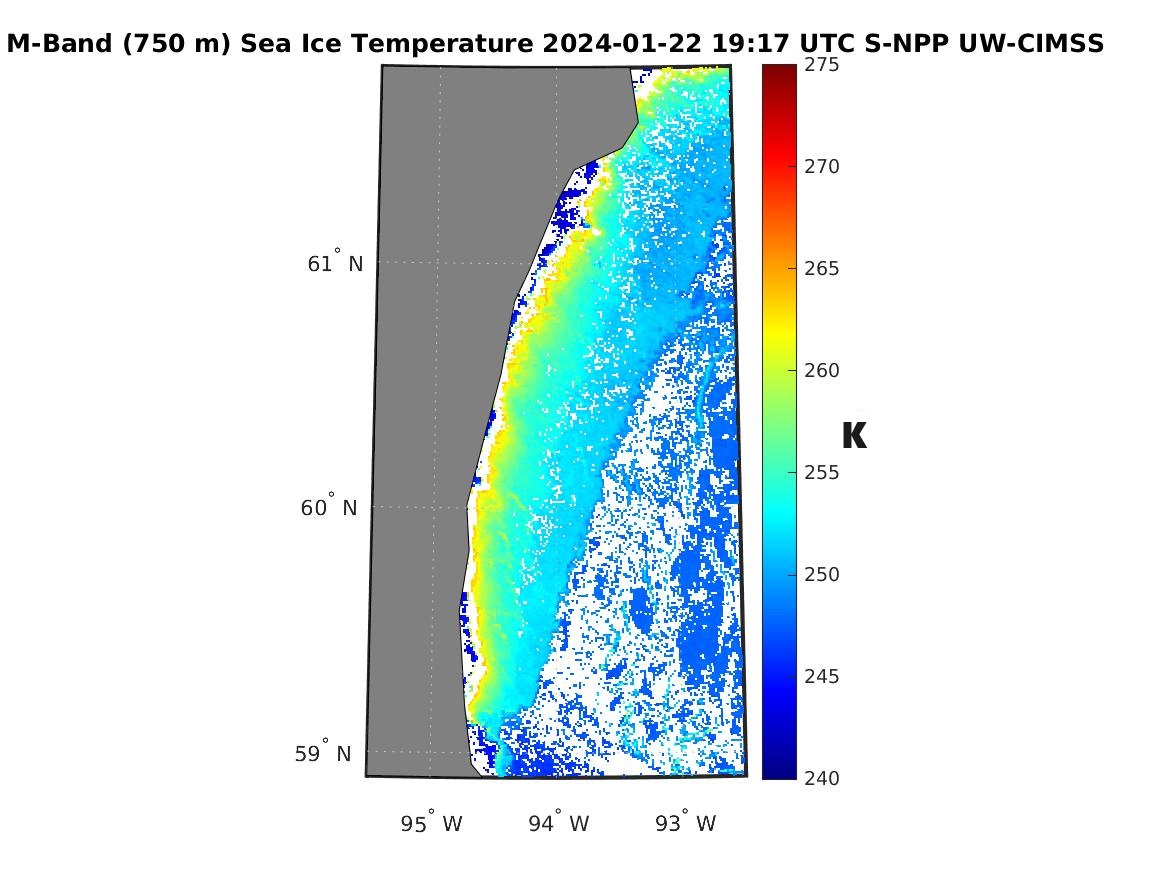
Suomi-NPP VIIRS Ice Surface Temperature product at 1917 UTC (credit: Rich Dworak, CIMSS) [click to enlarge]
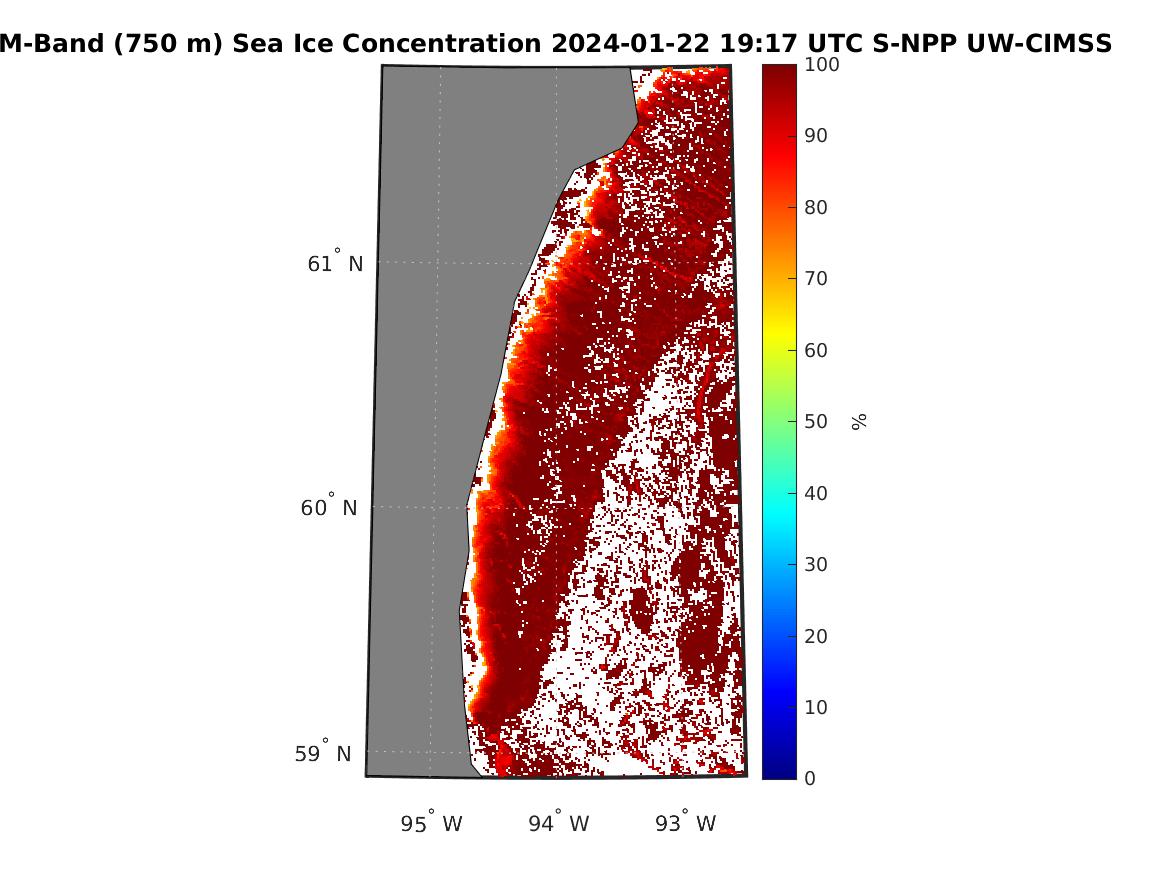
Suomi-NPP VIIRS Sea Ice Concentration product at 1917 UTC (credit: Rich Dworak, CIMSS) [click to enlarge]
A sequence of GOES-16 True Color RGB images (
source) from 1540-2030 UTC on 21 January and 22 January
(below) showed a widening of the Kivalliq Polynya during that 2-day period.
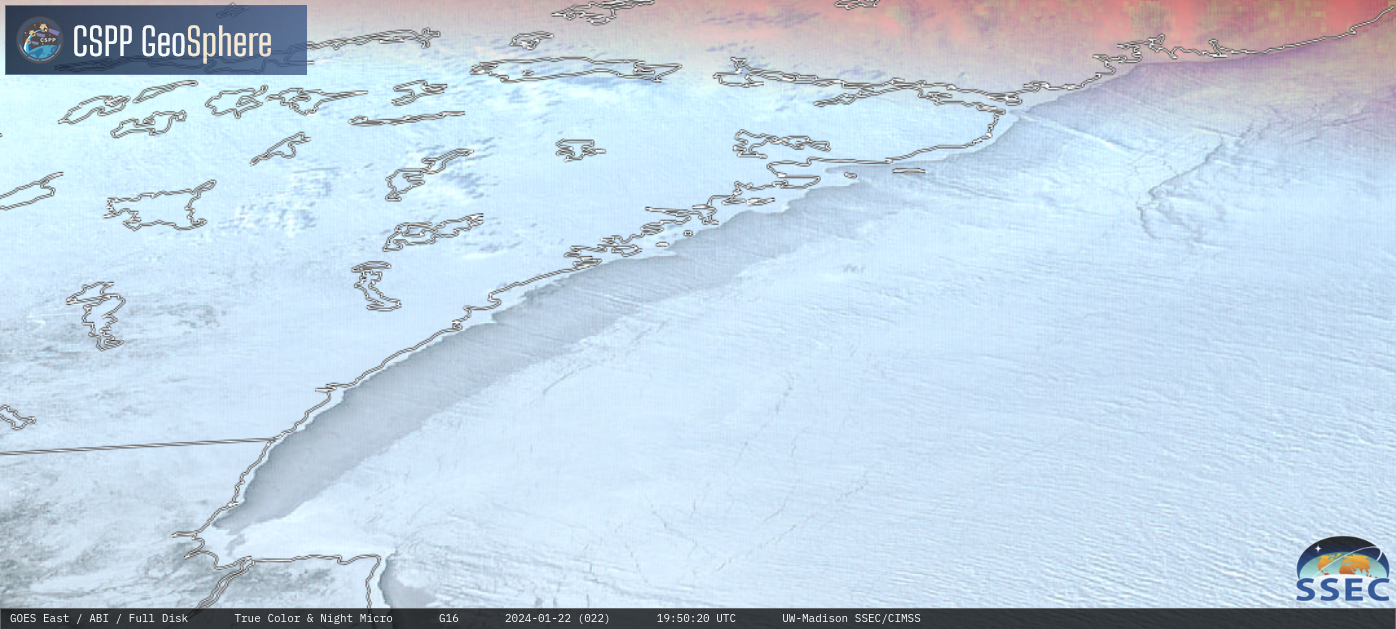
GOES-16 True Color RGB images, from 1540-2030 UTC on 21 January and 22 January [click to play MP4 animation]
View only this post
Read Less

