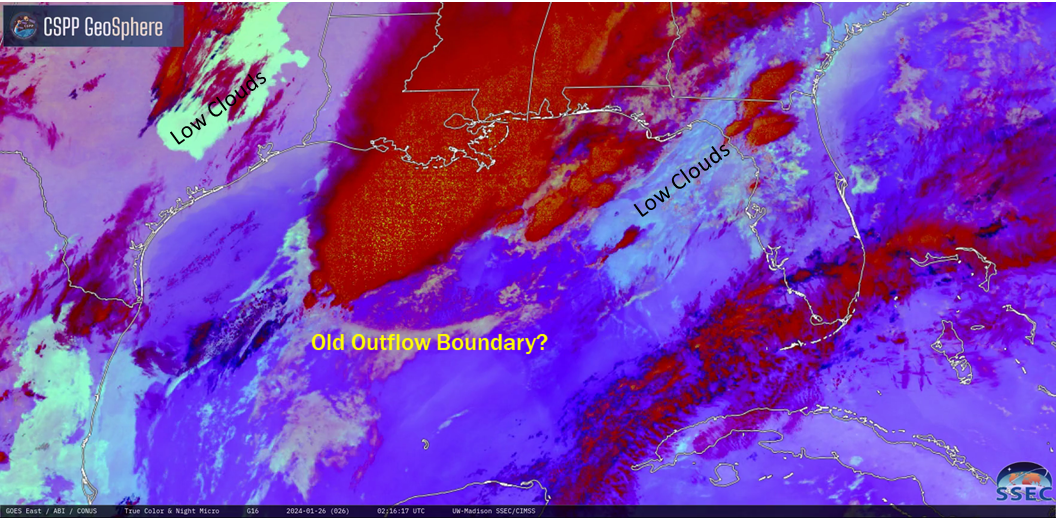
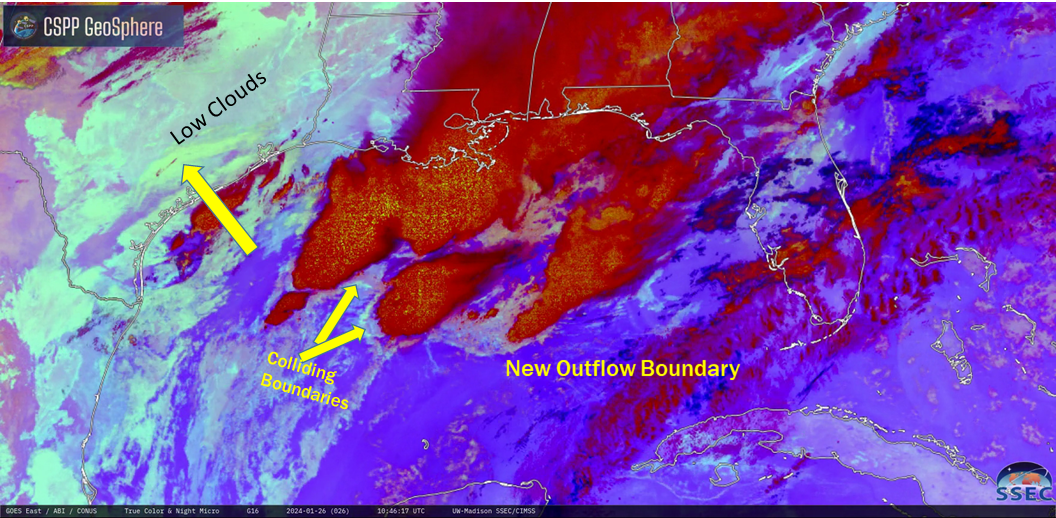
The Night Microphysics RGB animation below, taken from the CSPP Geosphere website (direct link to animation) shows strong convection over the central Gulf of Mexico along with cloud conditions in the surrounding states. Note, for example, the expanding region of low clouds over Texas. The annotated images below (0216, 0646 and 1046 UTC) highlight features.
At 0216, note the different colors associated with low clouds over Texas (where the stratus clouds are cooler) and over the northeast Gulf of Mexico/central Florida (where stratus clouds are warmer). The Blue component of the Night Microphysics RGB is the Band 13 (10.4 µm) brightness temperature; as the cloud top cools, the RGB will be less and less blue (and therefore more and more red and green, that is, yellow). There is a mid-level arced cloud feature to the south of the convection over the north-central Gulf that is likely an old outflow boundary. Strong convection south of Louisiana is denoted by red/speckled with yellow; the speckling occurs because the Band 7 (3.9 µm) imagery that is used in the ‘Night Fog Difference’ brightness temperature difference that is the green component of the night microphysics RGB has low precision at very cold temperatures as might be detected at the top of strong convection.
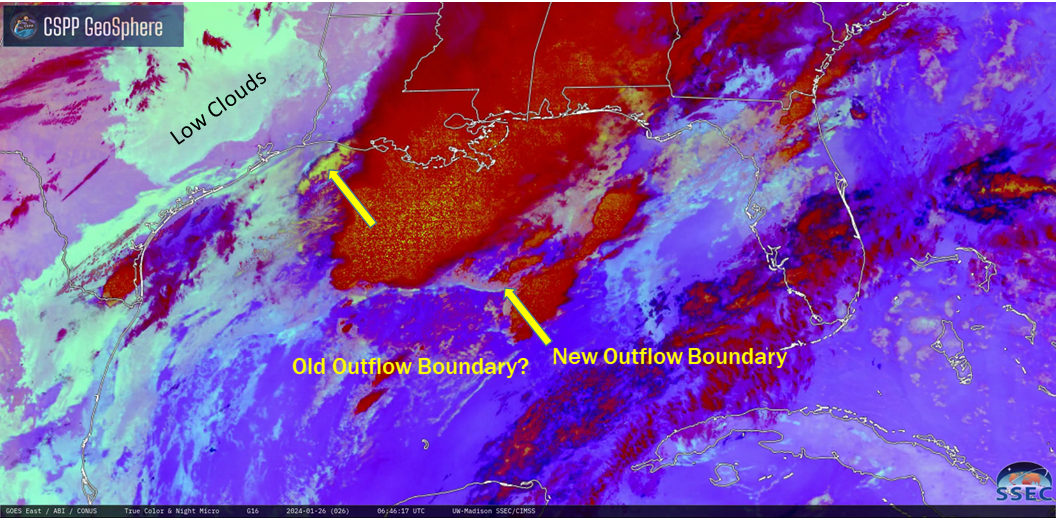
At 0646, the region of stratus clouds over Texas has expanded. (Do you think this is a region of fog? Why or why not? See below for the answer!) The old outflow boundary is still apparent, and could be a focusing point for new convection. A new outflow boundary has emerged from the convection over the north-central Gulf of Mexico and is propagating to the south. Convection that is developing on the western side of the convective complex is very yellow — one might infer the height/temperature/cloud type of the cloud tops there based on the RGB color.
At 1046, the stratus clouds over Texas continued to expand. Parts of the RGB over Texas show different colors, with different shades of yellow (compare the color near the arrow with areas to the northwest). That new Outflow Boundary — several hours old now — is still propagating southward, occasionally spawning convection. In addition, two more outflow boundaries are present as indicated. These colliding outflows might support convective initiation in the near future.

Is there fog over Texas? It’s hard to tell just from the cloud top, which is the information given by the Night Fog Brightness Temperature Difference and Night Microphysics RGB. There is a Level 2 Product that can help: IFR Probability. GOES-R IFR Probability combines satellite detection of low clouds with Rapid Refresh estimates of low-level saturation to produce a probabilistic estimate of IFR conditions. (One could also look at webcams or surface observations that are plentiful over Texas). The toggle below shows Night Microphysics RGB in AWIPS, plus the IFR Probability field with and without observations. Fog is observed over much of Texas where the Night Microphysics RGB shows low clouds, and IFR Probabilities are high. Note conditions over Mississippi where high clouds block the satellite view of low stratus. Nevertheless, IFR Probability fields show large values because IFR probability fields include low-level saturation information from the Rapid Refresh model.
What kind of rain rates are associated with the convection? Suomi-NPP overflew the Gulf around 0800 UTC, and the toggle below compares the GOES-16 clean window infrared (Band 13, 10.4 µm) imagery and the derived MiRS rain rate (available as AWIPS-ready files from the LDM feed that accesses data from the direct broadcast site at CIMSS). Peak values are 1″/hour.
How did the GOES-16 Infrared-derived Rain Rate (which is intercalibrated using available Microwave data) compare with the MiRS Rain Rate at that time? A cursor sample of GOES-16 Level 2 derived products associated with a cold convective overshooting top (below) indicated a Rain Rate of 1.47 in/hr.
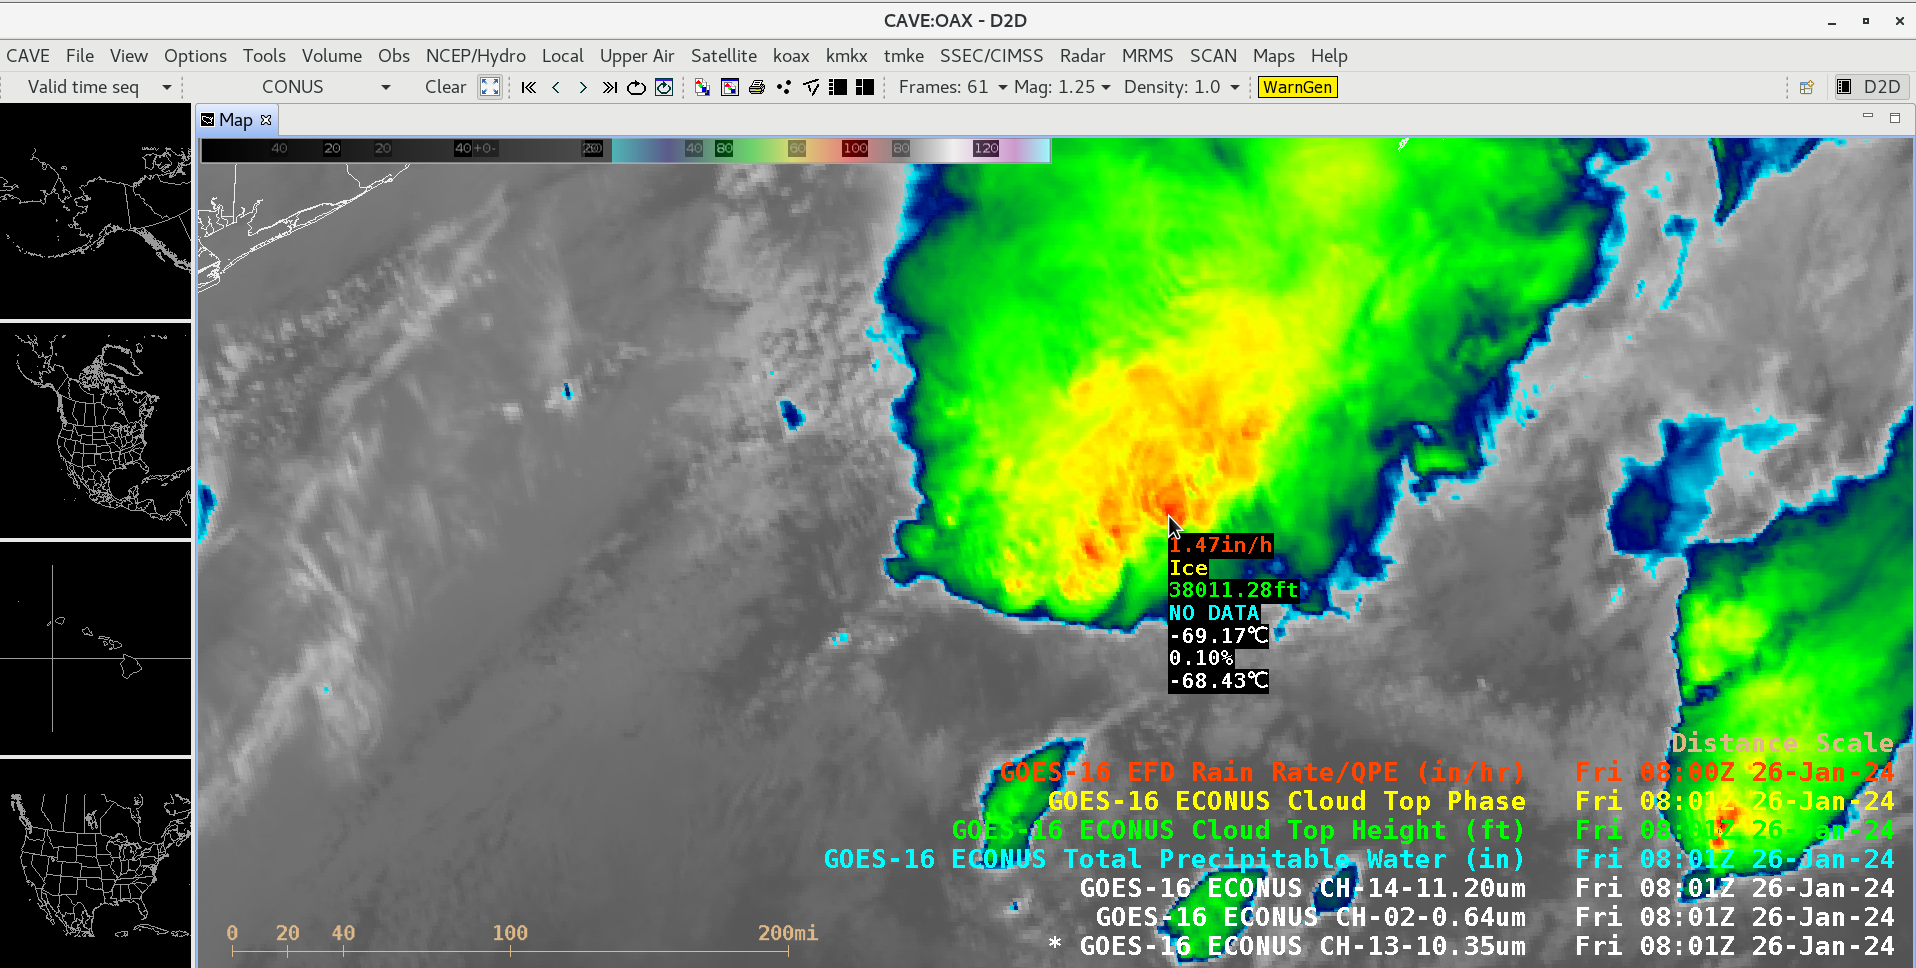
GOES-16 Visible/Infrared Sandwich RGB image at 0801 UTC on 26 January, with a cursor sample of the associated Level 2 derived products over a cold convective overshooting top (courtesy Scott Bachmeier, CIMSS) [click to enlarge]
View only this post Read Less

