Polar Hyperspectral Sounding data in a model simulation: Virginia Beach Tornado
The mp4 animation above, downloaded from the CSPP Geosphere site, shows true-color imagery in the 90 minutes surrounding an EF-3 tornado in Virginia Beach, VA shortly before 2200 UTC on 30 April 2023 (CIMSS Satellite Blog post; SPC Storm reports; ProbSevere imagery for the storm is here). Note the overshooting tops moving from southeastern Virginia northeastward to the extreme southern Delmarva peninsula, likely associated with the strongest thunderstorms. This blog post considers how the addition of Polar Hyperspectral Sounding (PHS) data into a numerical model affected the model simulation of this tornadic event (model output is available here). This PHS modeling system is being demonstrated at the Hazardous Weather Testbed late in May, and in early June (PHS model output was also available at last year’s HWT!)
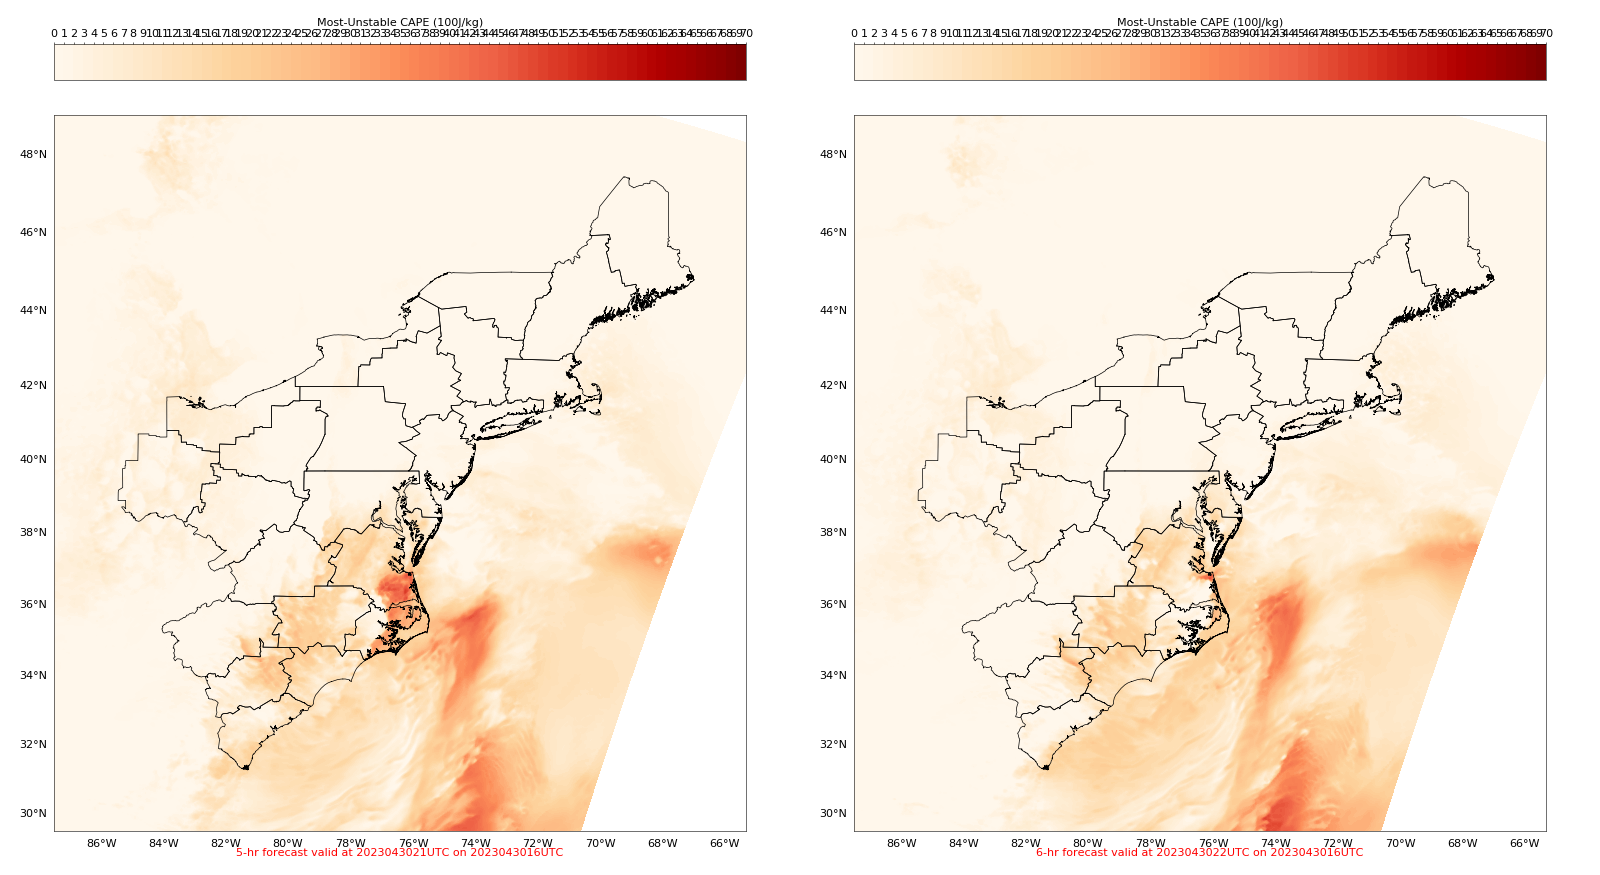
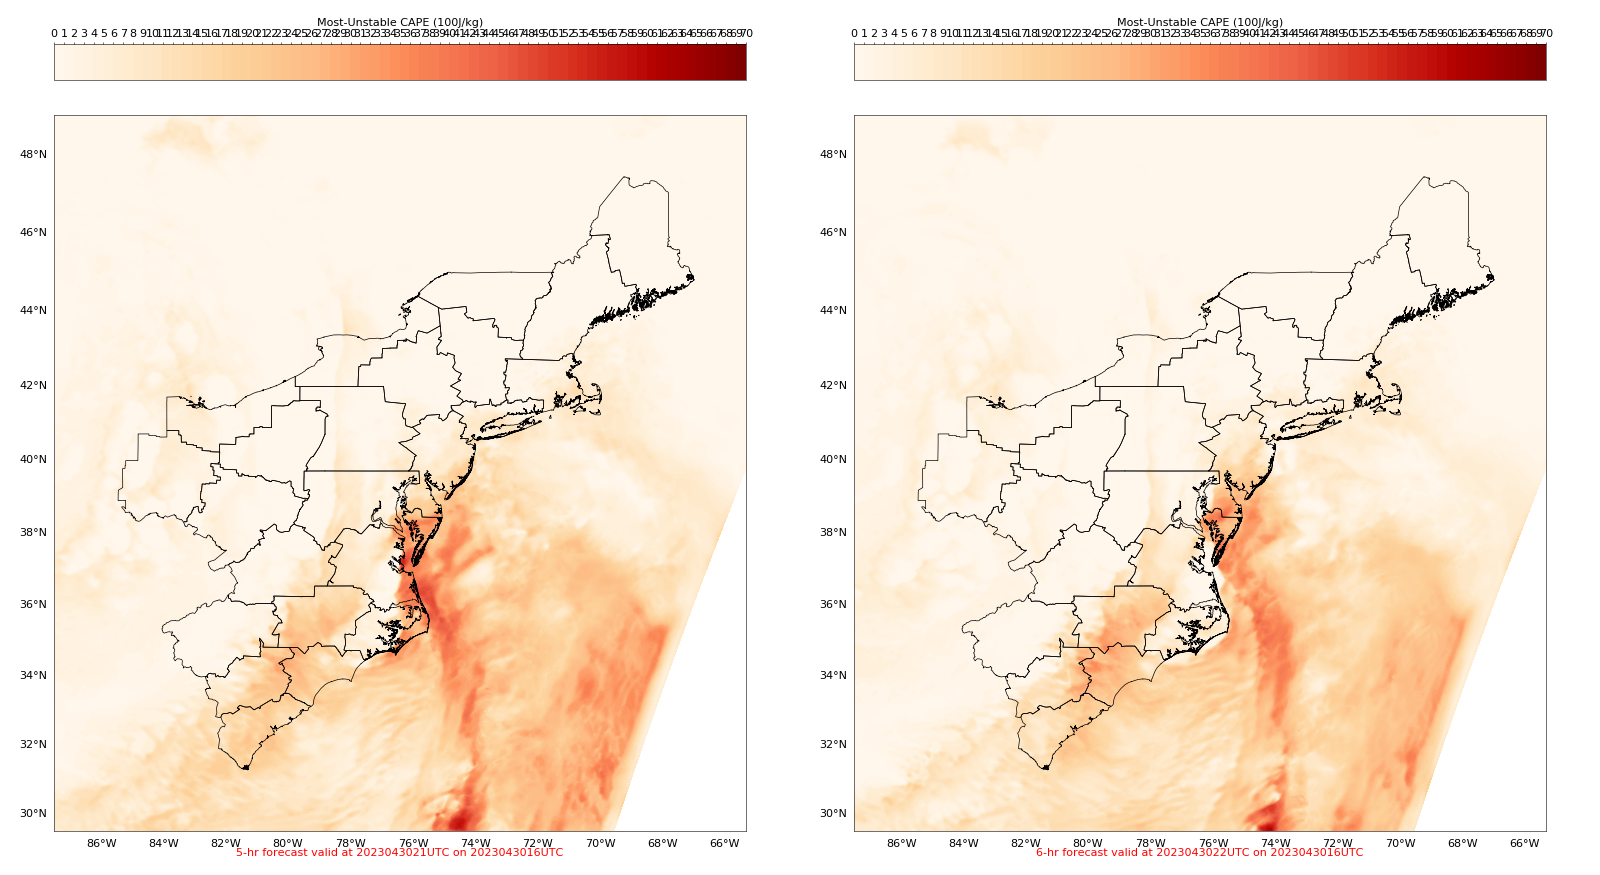
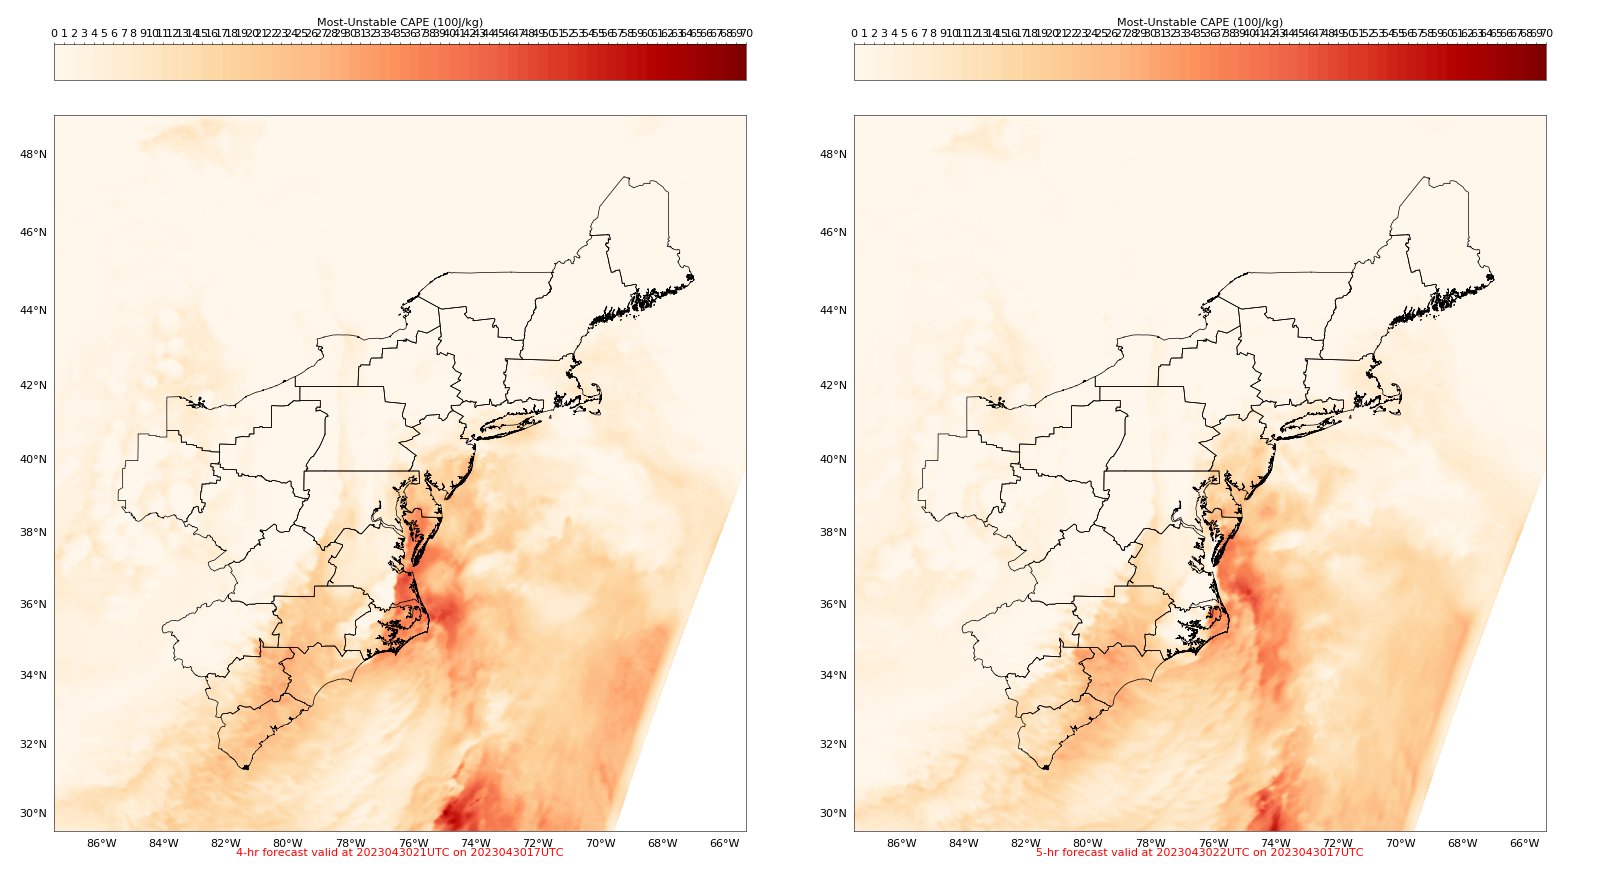
The two-panel image above shows 5- and 6-h MUCAPS distributions from a WRF simulation (with 3-km resolution) initialized with conventional data, and the image below shows 5- and 6-h forecast MUCAPS from a HRRR simulation (with 4-km resolution) that includes as part of its assimilation cycle temperature and moisture fields that include information from Polar Hyperspectral Soundings (in this case, from the morning overpasses from IASI on Metop-B and Metop-C). Compare the fields above and below. The HRRR simulation that includes the influence of Polar Hyperspectral Sounding data leads to a MUCAPE field that extends more seamlessly north towards the Delmarva peninsula.
The PHS simulation from 1700 UTC, below, shows good consistency with the 1600 UTC run shown above. In particular, both show the most unstable CAPE lingering over extreme southeastern Virginia at 2100 UTC and offshore at 2200 UTC.
HRRR data was also used to compute Significant Tornado Parameter (STP), and the animation below shows parameter forecasts (from the model initialized at 1700 UTC) for 1900, 2000, 2100 and 2200 UTC.