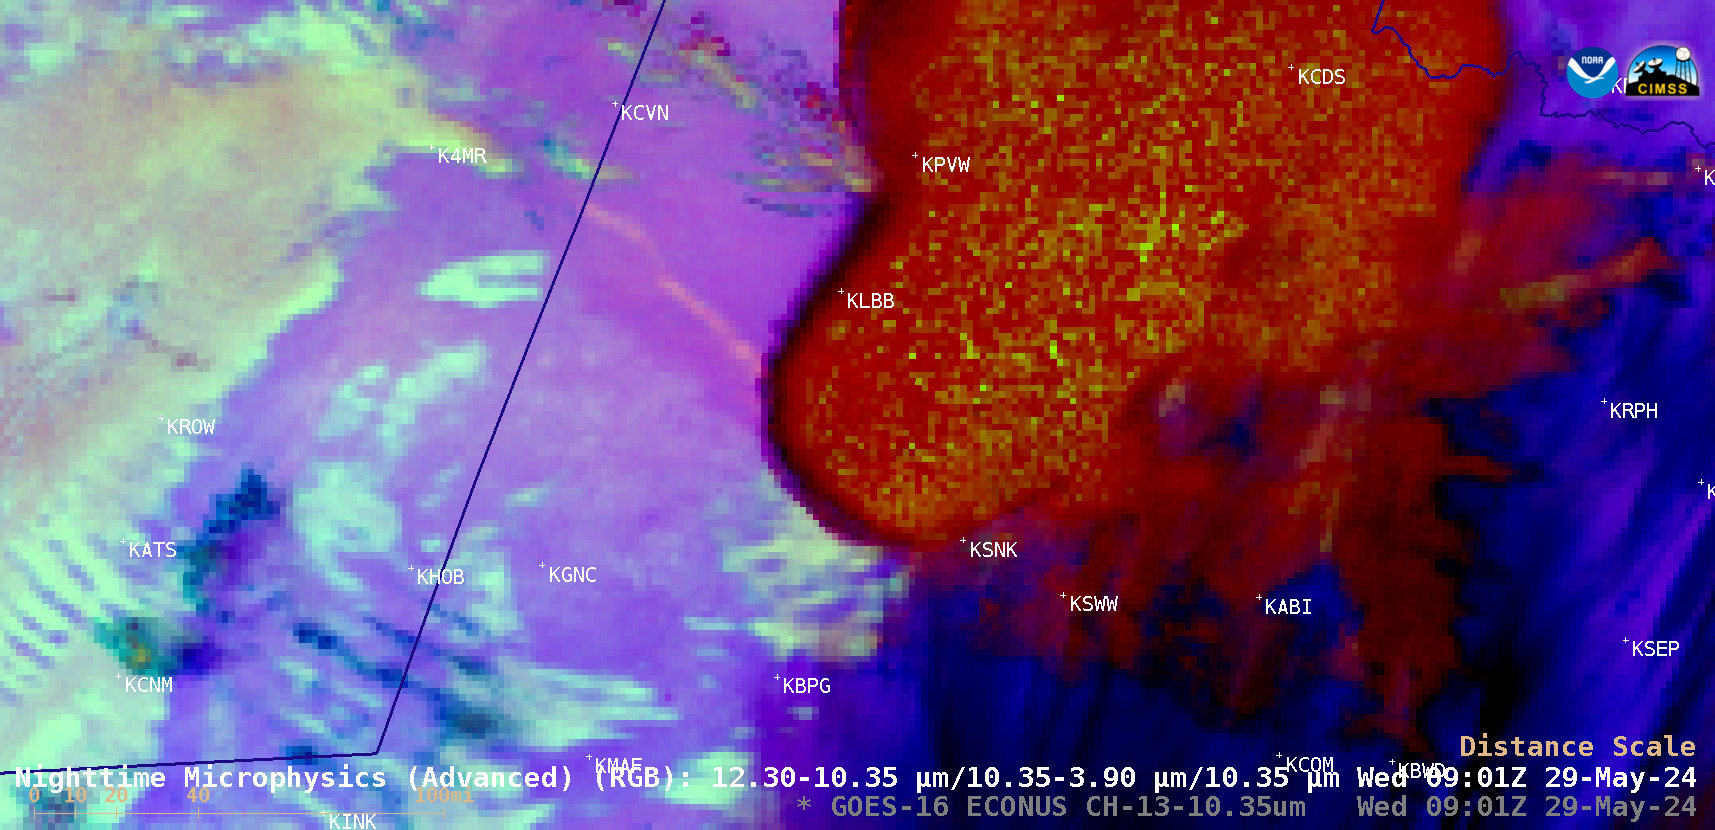
10-minute Full Disk sector GOES-18 (GOES-West) Day Land Cloud Fire RGB, Shortwave Infrared (3.9 µm), “Clean” Infrared Window (10.3 µm) and “Red” Visible (0.64 µm) images with an overlay of the Fire Mask derived product (a component of the GOES Fire Detection and Characterization Algorithm FDCA) (above) displayed signatures of a wildfire in far northeastern British Columbia, which produced... Read More

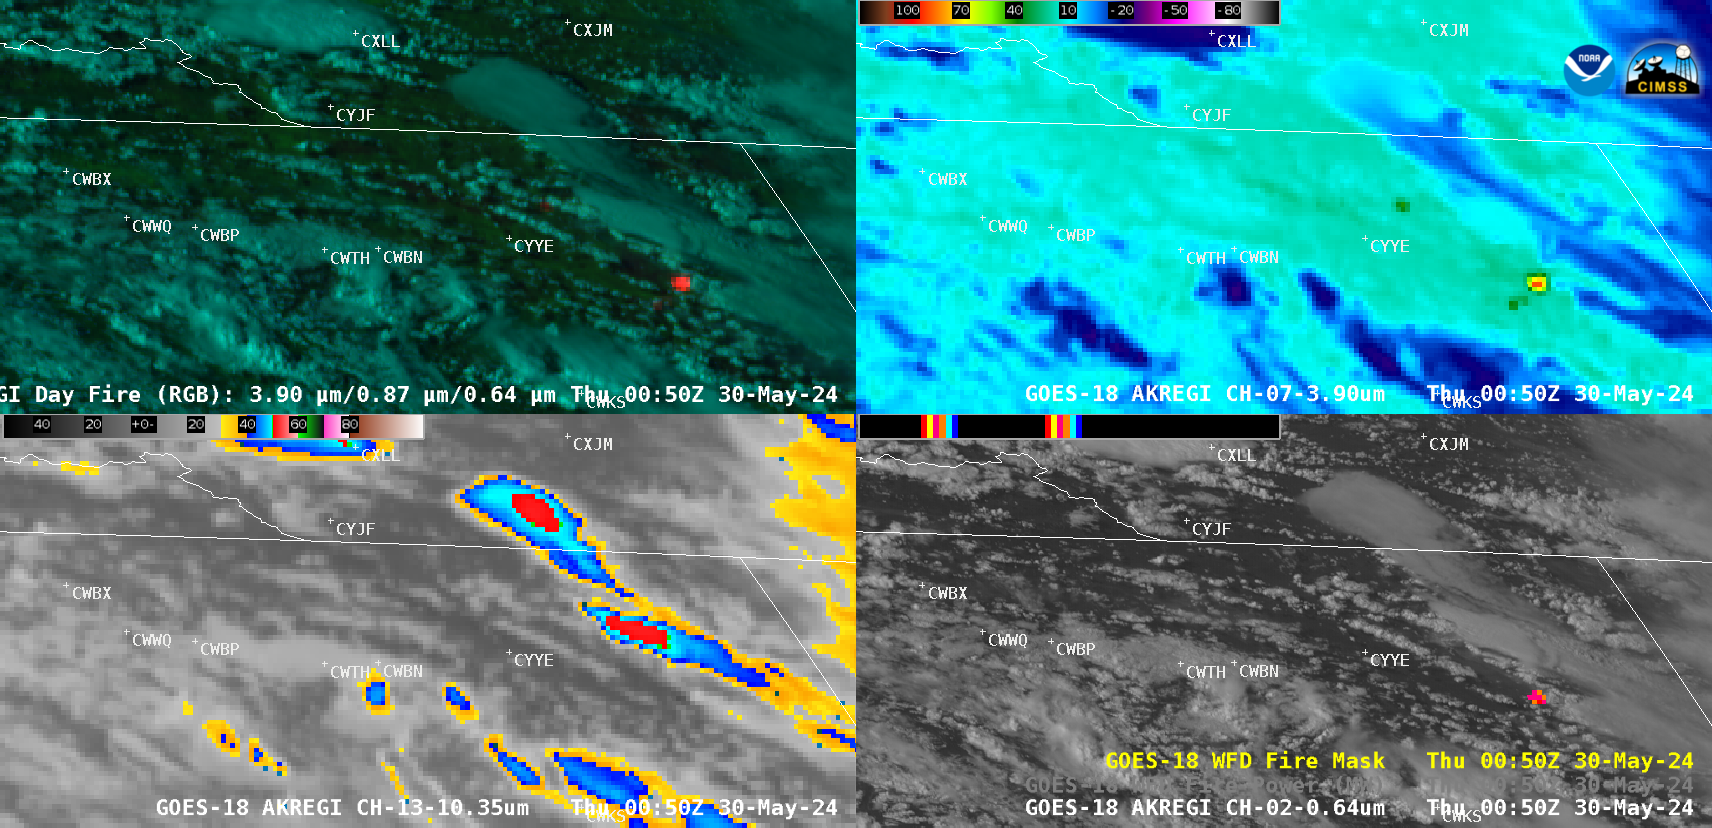
GOES-18 Day Land Cloud Fire RGB (top left), Shortwave Infrared (3.9 µm, top right), “Clean” Infrared Window (10.3 µm, bottom left) and “Red” Visible (0.64 µm) images with an overlay of the Fire Mask derived product (bottom right), from 1900 UTC on 29 May to 0200 UTC on 30 May [click to play animated GIF | MP4]
10-minute Full Disk sector GOES-18
(GOES-West) Day Land Cloud Fire RGB, Shortwave Infrared (
3.9 µm), “Clean” Infrared Window (
10.3 µm) and “Red” Visible (
0.64 µm) images with an overlay of the Fire Mask derived product (a component of the GOES Fire Detection and Characterization Algorithm
FDCA)
(above) displayed signatures of a wildfire in far northeastern British Columbia, which produced 2
pyrocumulonimbus (pyroCb) clouds — exhibiting cloud-top infrared brightness temperatures in the -40s to -50s C, denoted by shades of blue to red in the 10.3 µm images — late in the day on 29 May 2024 (Canada’s first pyroCb clouds of their 2024 wildfire season were observed on
13 May).
A similar animation that includes GOES-18 Visible images with an overlay of the Fire Power derived product — another component of the FDCA — is shown below.
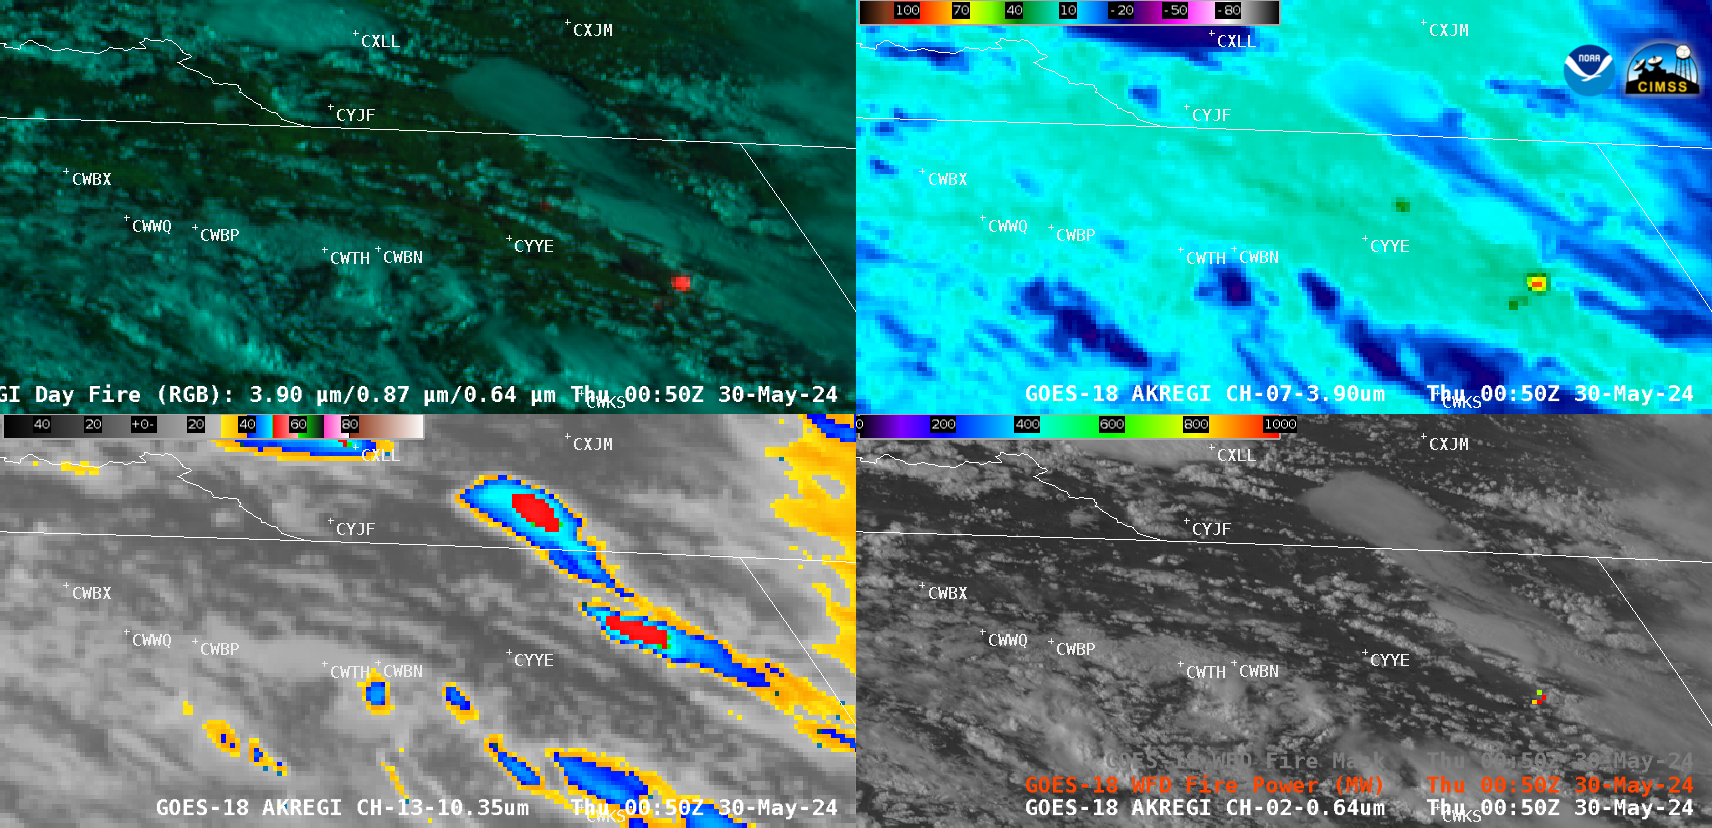
GOES-18 Day Land Cloud Fire RGB (top left), Shortwave Infrared (3.9 µm, top right), “Clean” Infrared Window (10.3 µm, bottom left) and “Red” Visible (0.64 µm) images with an overlay of the Fire Power derived product (bottom right), from 1900 UTC on 29 May to 0200 UTC on 30 May [click to play animated GIF | MP4]
GOES-18 True Color RGB images from the
CSPP GeoSphere site
(below) displayed several plumes of low-altitude wildfire smoke, followed by the explosive development of the 2 high-altitude pyroCb clouds (which then drifted to the northwest).
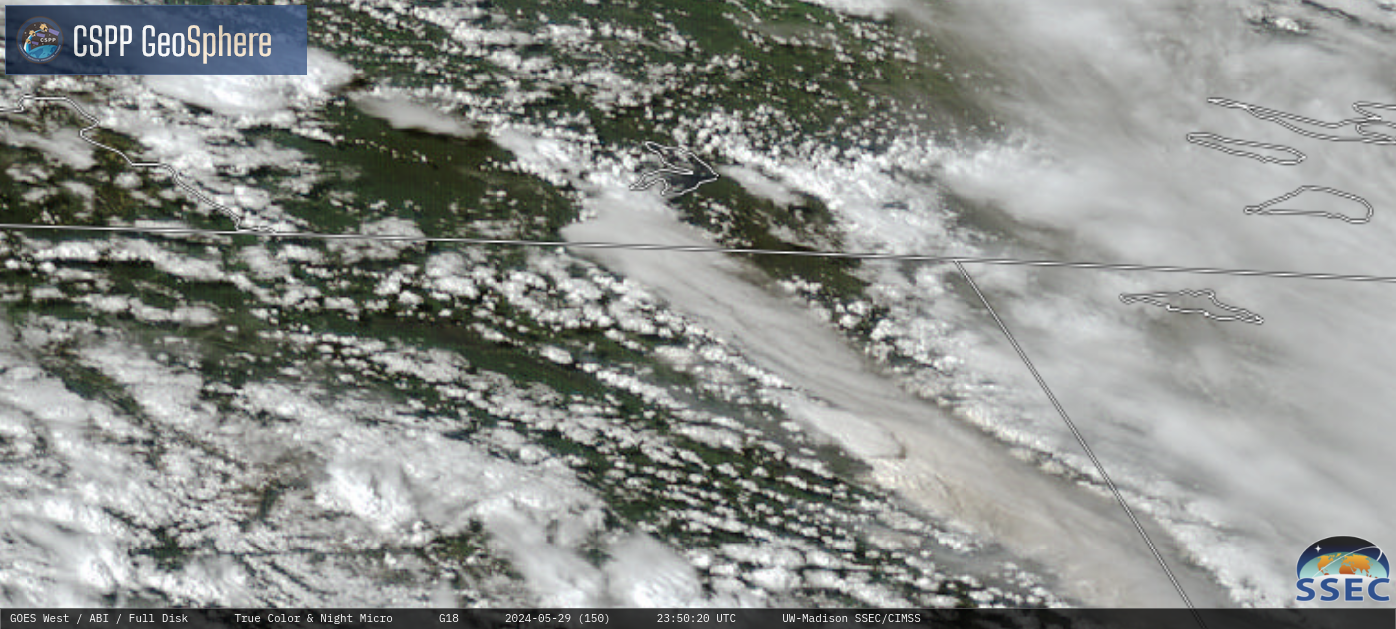
GOES-18 True Color RGB images, from 1800 UTC on 29 May to 0200 UTC on 30 May [click to play MP4 animation]
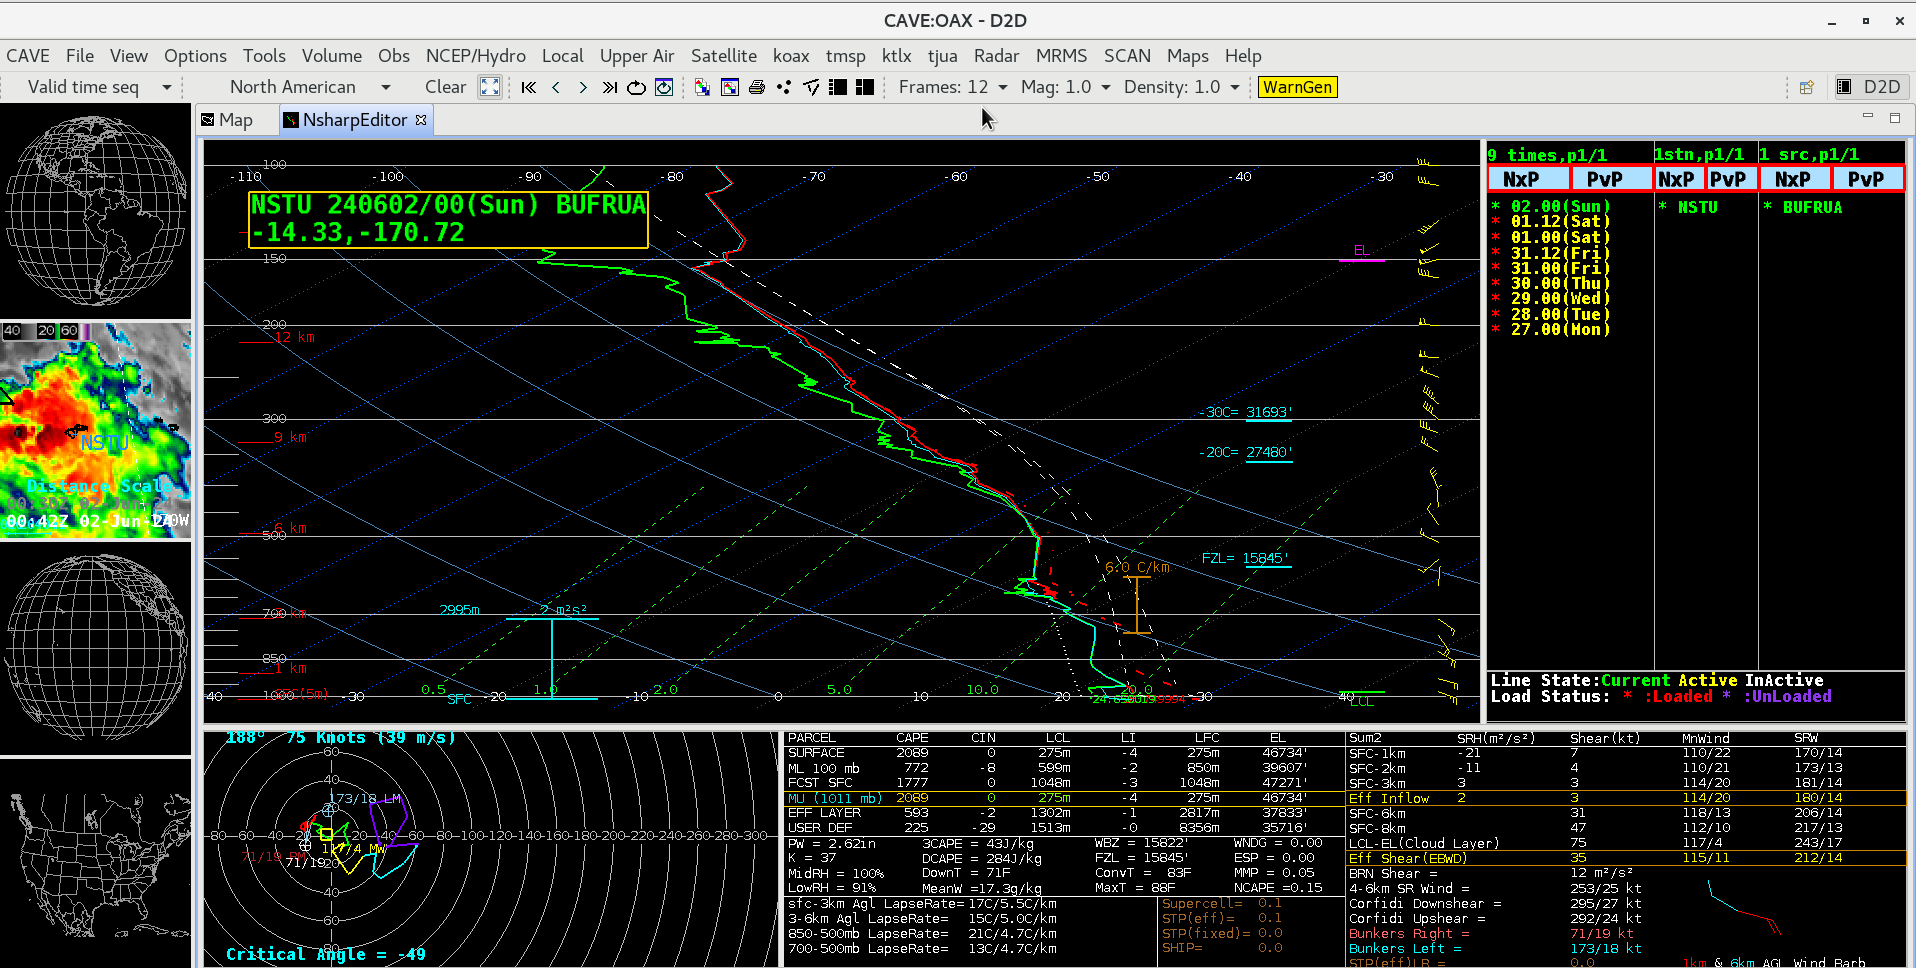
The coldest 10.3 µm infrared brightness temperature sensed for each of the 2 pyroCb clouds was -52ºC. According to
rawinsonde data from nearby Fort Nelson, BC (CYYE), this represented a pressure level of 307 hPa or an altitude around 8.9 km
(below).
Plot of rawinsonde data from Fort Nelson, BC at 0000 UTC on 30 May [click to enlarge]
This wildfire burned very hot, exhibiting a peak 3.9 µm shortwave infrared brightness temperature of 137.88ºC (which is the saturation temperature of GOES-18
ABI Band 7 detectors) — at 2250 UTC
(below).
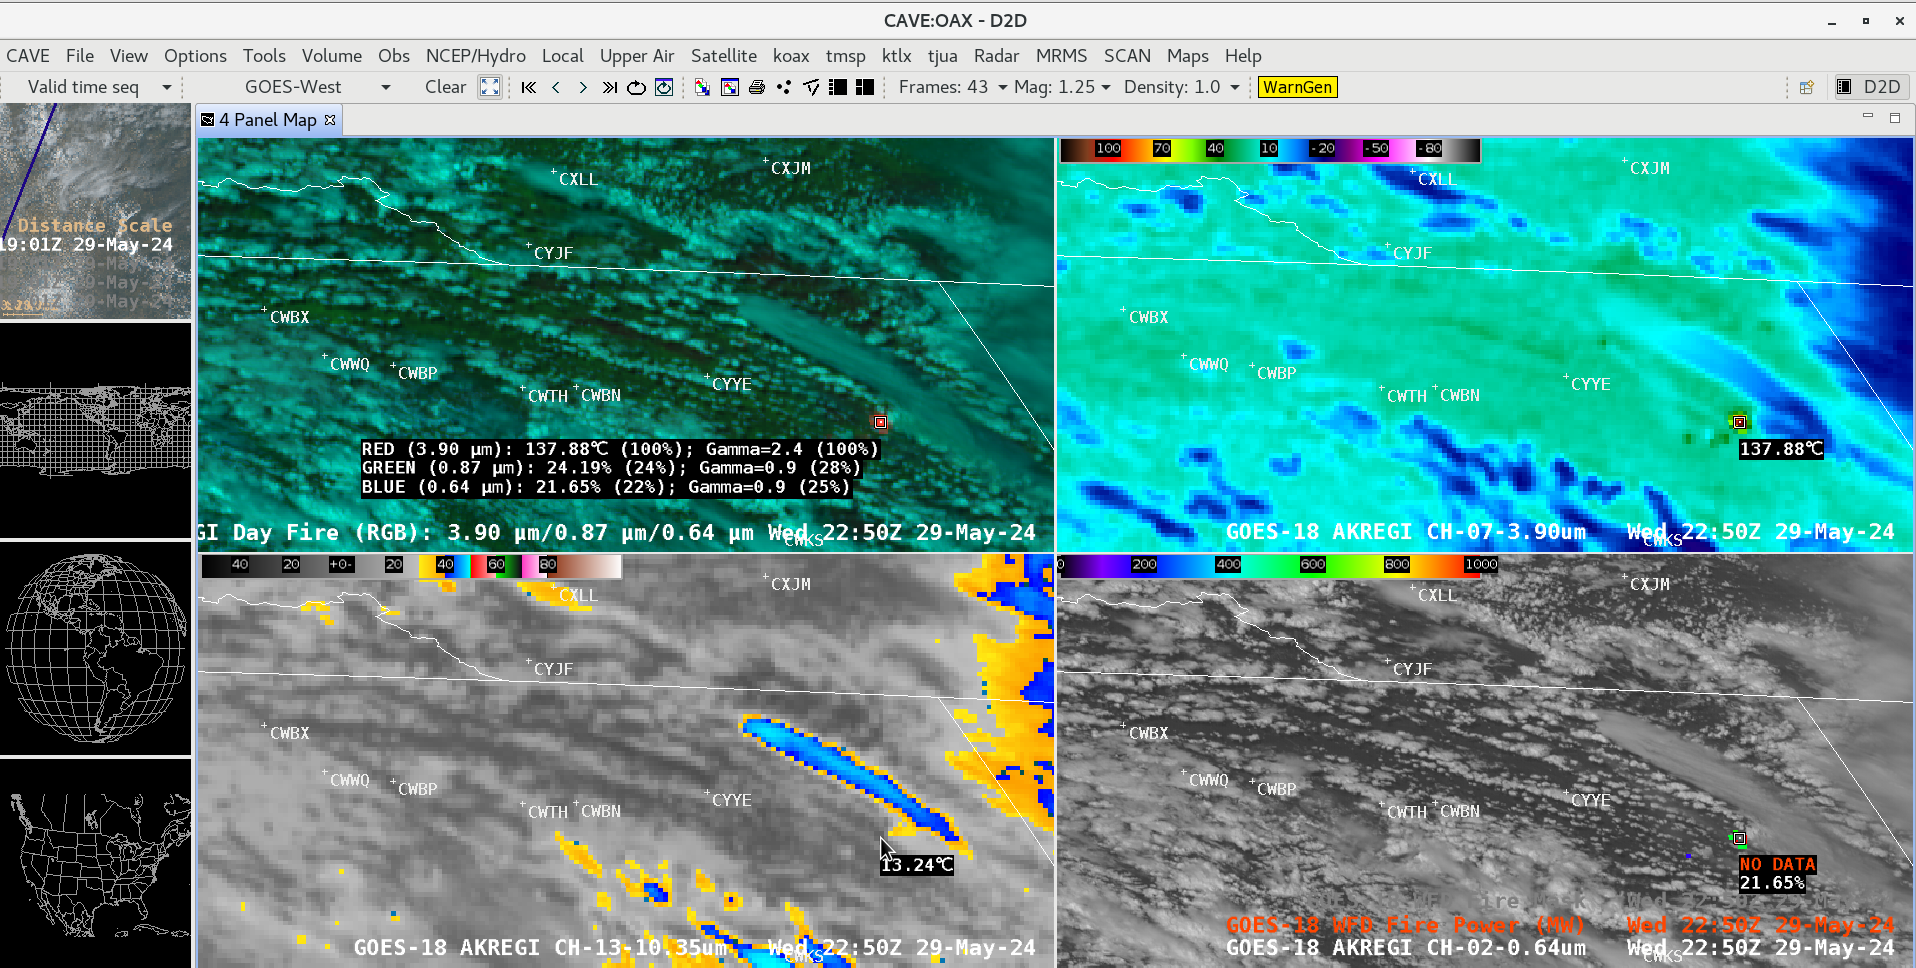
Cursor sampling of the GOES-18 Day Land Cloud Fire RGB (top left), Shortwave Infrared (3.9 µm, top right), “Clean” Infrared Window (10.3 µm, bottom left) and “Red” Visible (0.64 µm) image with an overlay of the Fire Power derived product (bottom right) at 2250 UTC on 29 May [click to enlarge]
The GOES-18 Fire Power value reached 6057.70 MW at 2310 UTC
(below) — values over 6000 MW are only seen with very hot fires.
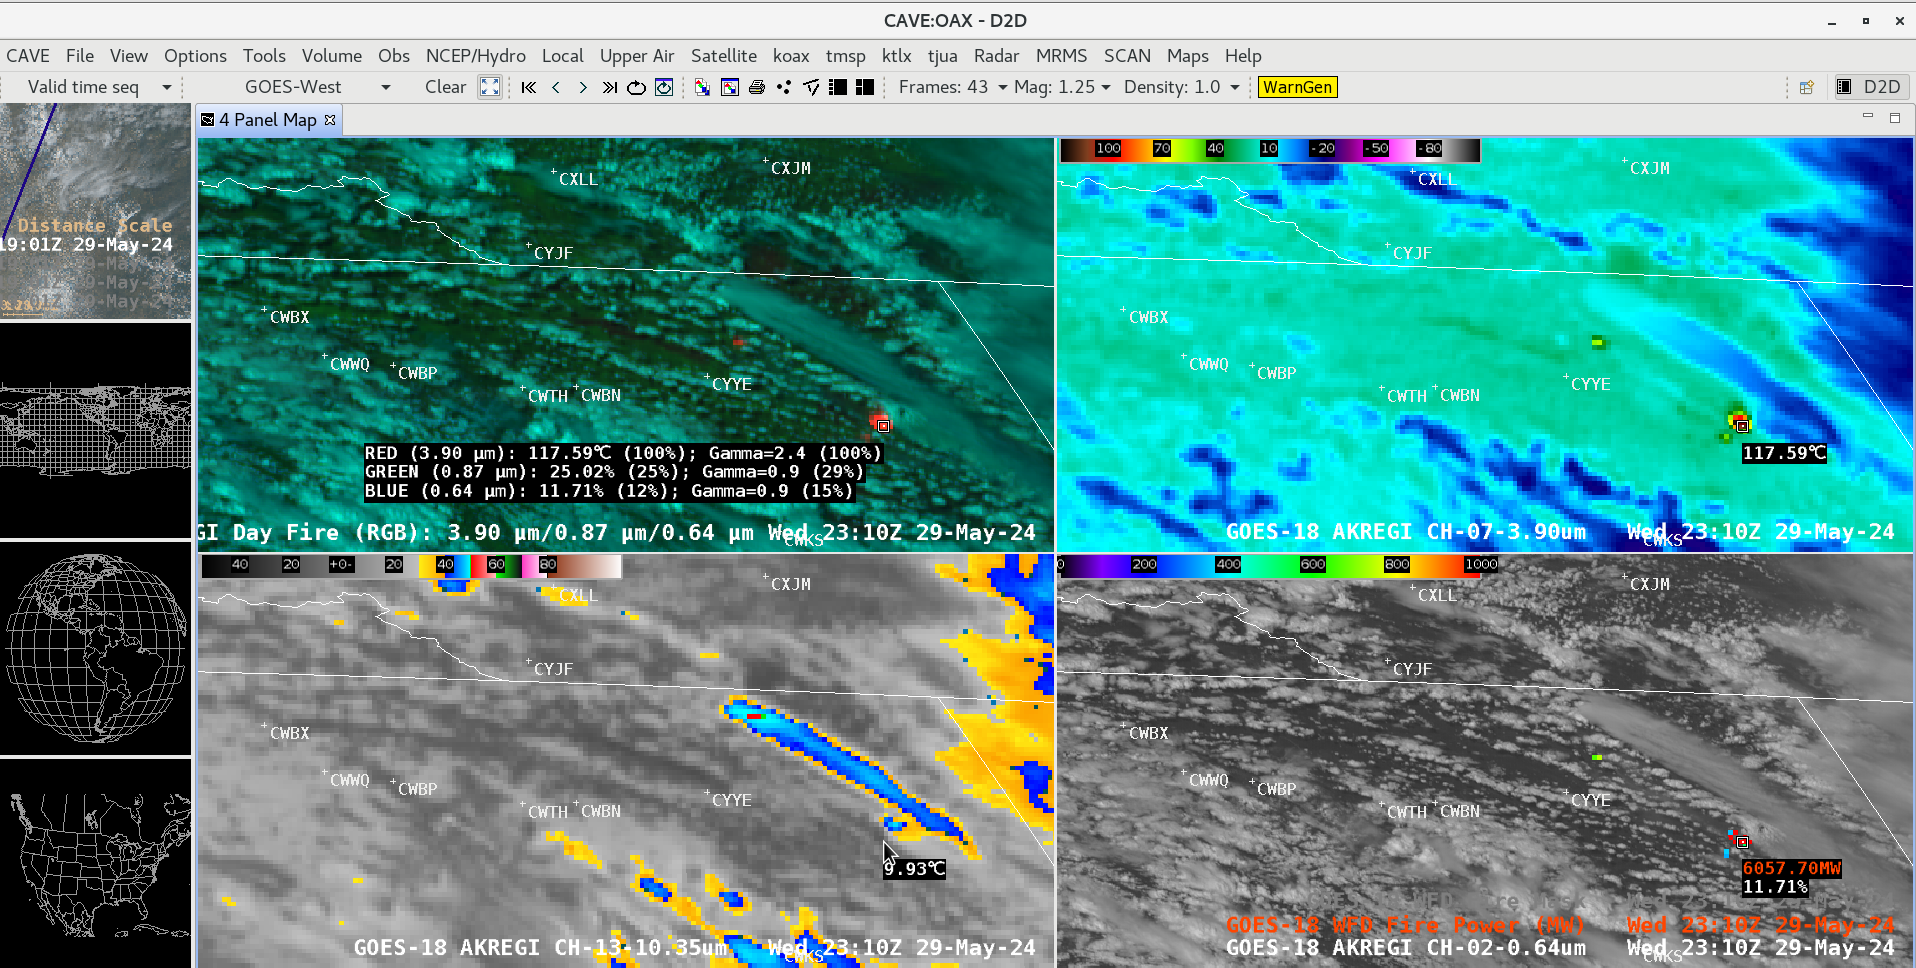
Cursor sampling of the GOES-18 Day Land Cloud Fire RGB (top left), Shortwave Infrared (3.9 µm, top right), “Clean” Infrared Window (10.3 µm, bottom left) and “Red” Visible (0.64 µm) image with an overlay of the Fire Power derived product (bottom right) at 2310 UTC on 29 May [click to enlarge]
View only this post
Read Less


