This website works best with a newer web browser such as Chrome, Firefox, Safari or Microsoft
Edge. Internet Explorer is not supported by this website.
One focus on day 4 of HWT in Norman was the North Platte, Nebraska (WFO LBF) County Warning Area (CWA) over western Nebraska. This was near a gradient in the Storm Prediction Center Convective Outlook that had an enhanced risk over central Nebraska and a Slight risk over western Nebraska. The first concern was... Read More
One focus on day 4 of HWT in Norman was the North Platte, Nebraska (WFO LBF) County Warning Area (CWA) over western Nebraska. This was near a gradient in the Storm Prediction Center Convective Outlook that had an enhanced risk over central Nebraska and a Slight risk over western Nebraska. The first concern was when would convective initiation occur? The 1600 UTC PHS model run had convective initiating at 2000 UTC and building from then on.
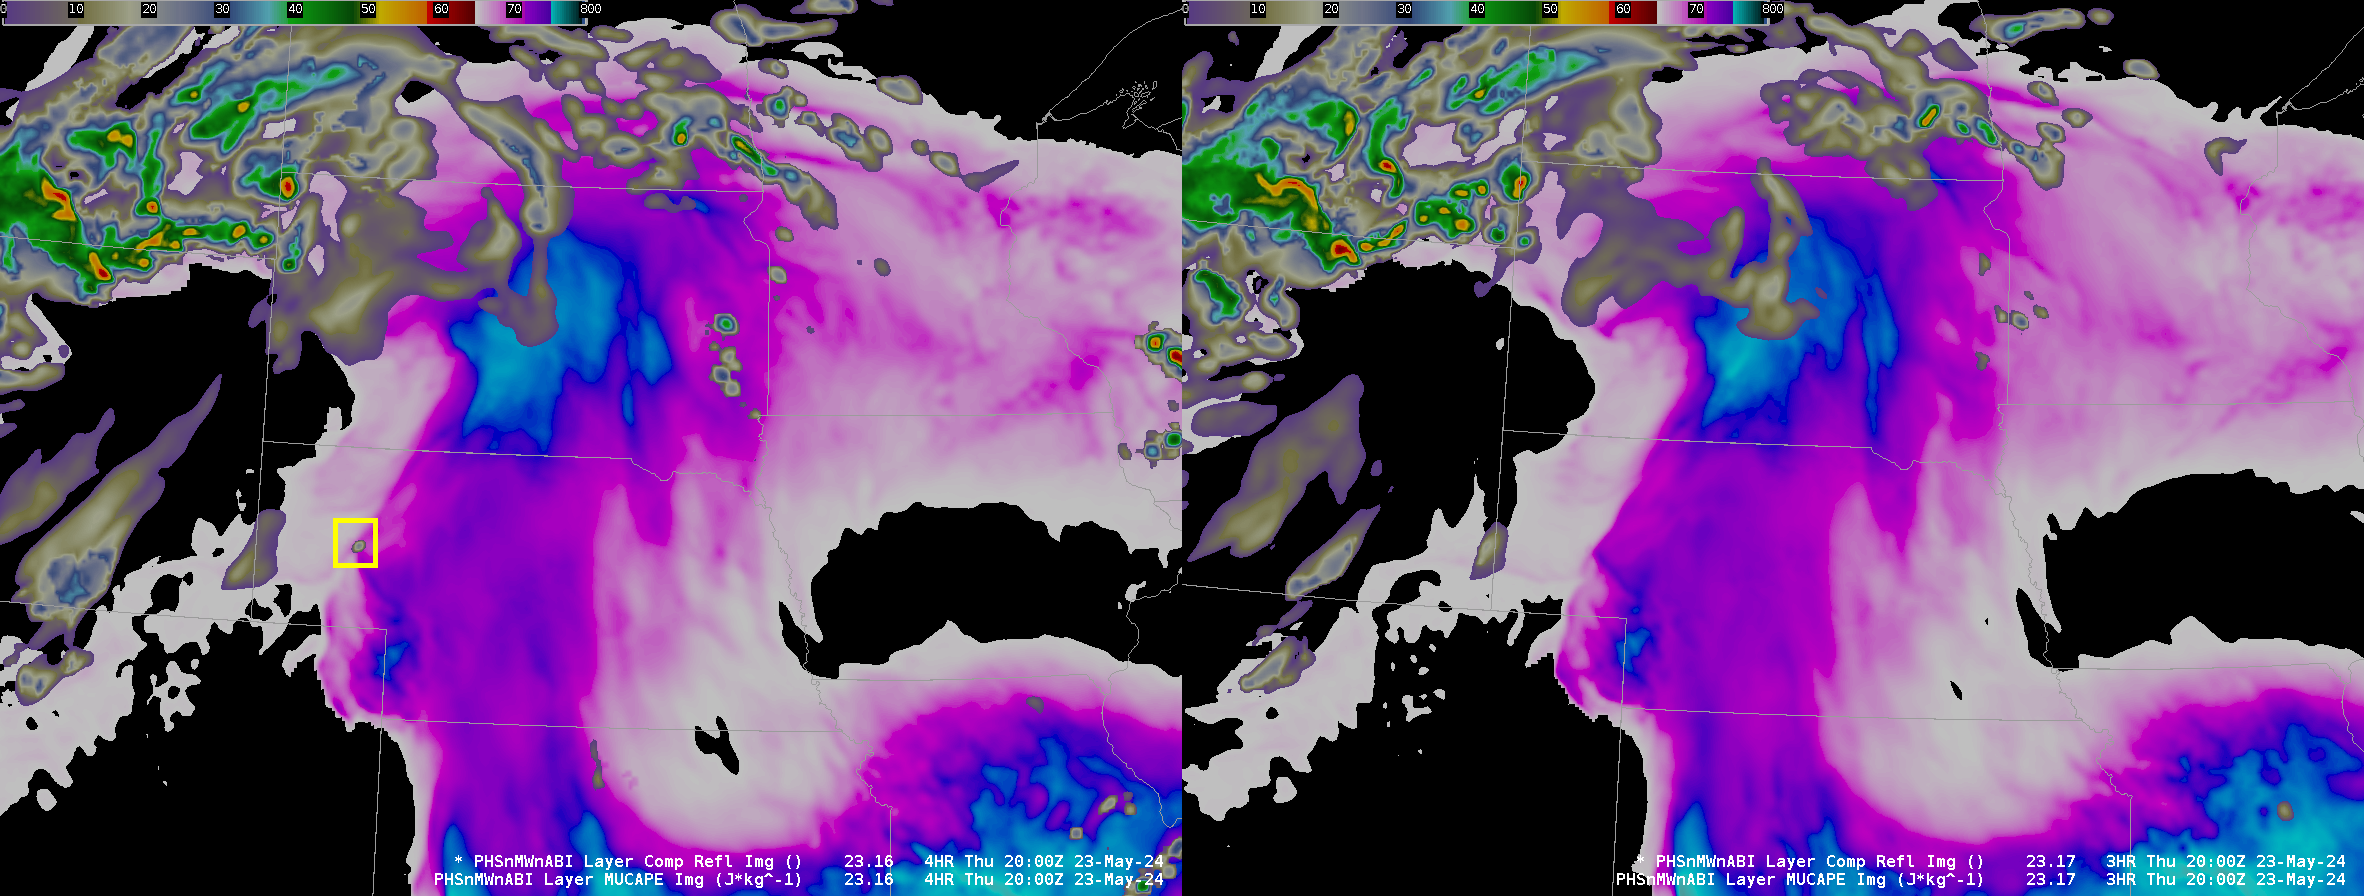
PHS Model output: Most Unstable CAPE (MUCAPE) and Composite Reflectivity, hourly from 1800-2100 UTC on 23 May 2024; the convective initiation at 2000 UTC is highlighted by a yellow box at 2000 UTC (Click to enlarge)
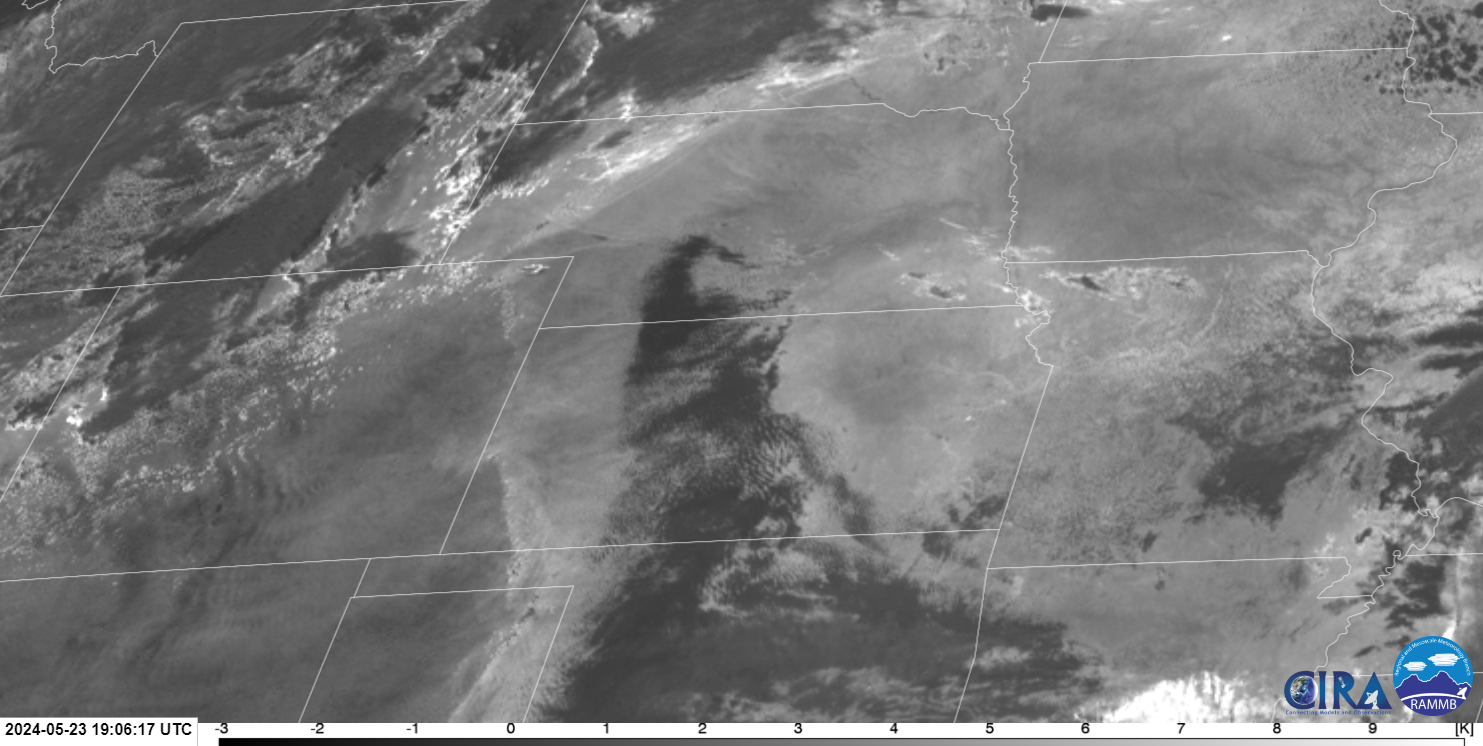
The distribution of moisture modeled in the MUCAPE field above was very similar to the Split Window Difference field (here, from this link).
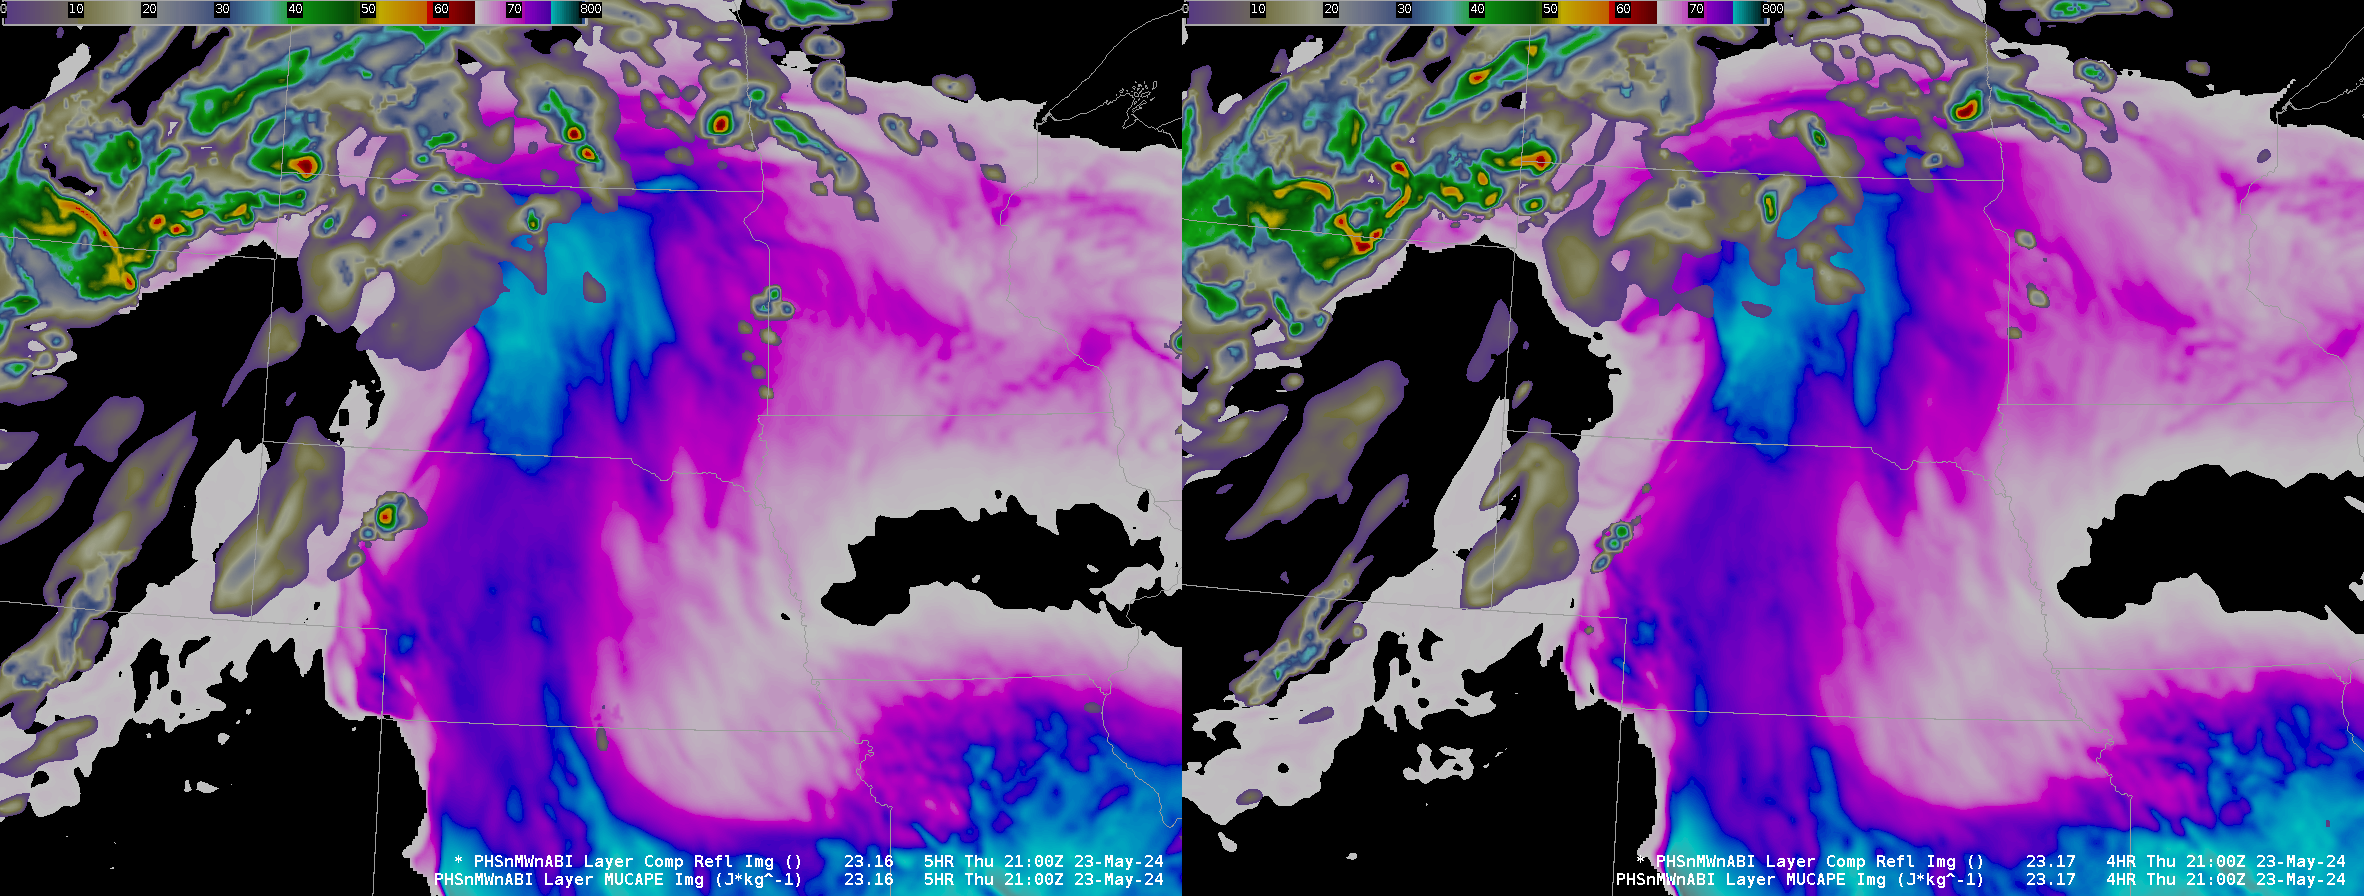
The PHS model runs hourly. The data above shows the 2000 UTC forecast from 1600 UTC (that is, a 4-hour forecast). The 3-h forecast valid at 2000 UTC (from the PHS run at 1700 UTC) did not include initiation until after 2000 UTC. Compare the two fields below, 3-h and 4-h forecasts for 2000 UTC and 2100 UTC from 1600 UTC and 1700 UTC, respectively.
Forecasts of MUCAPS and Composite Reflectivity valid at 2000 UTC on 23 May 2024. 4-h forecast from a 1600 UTC initialization (left) and 3-h forecast from a 1700 UTC initialization (Click to enlarge)Forecasts of MUCAPS and Composite Reflectivity valid at 2100 UTC on 23 May 2024. 5-h forecast from a 1600 UTC initialization (left) and 4-h forecast from a 1700 UTC initialization (Click to enlarge)
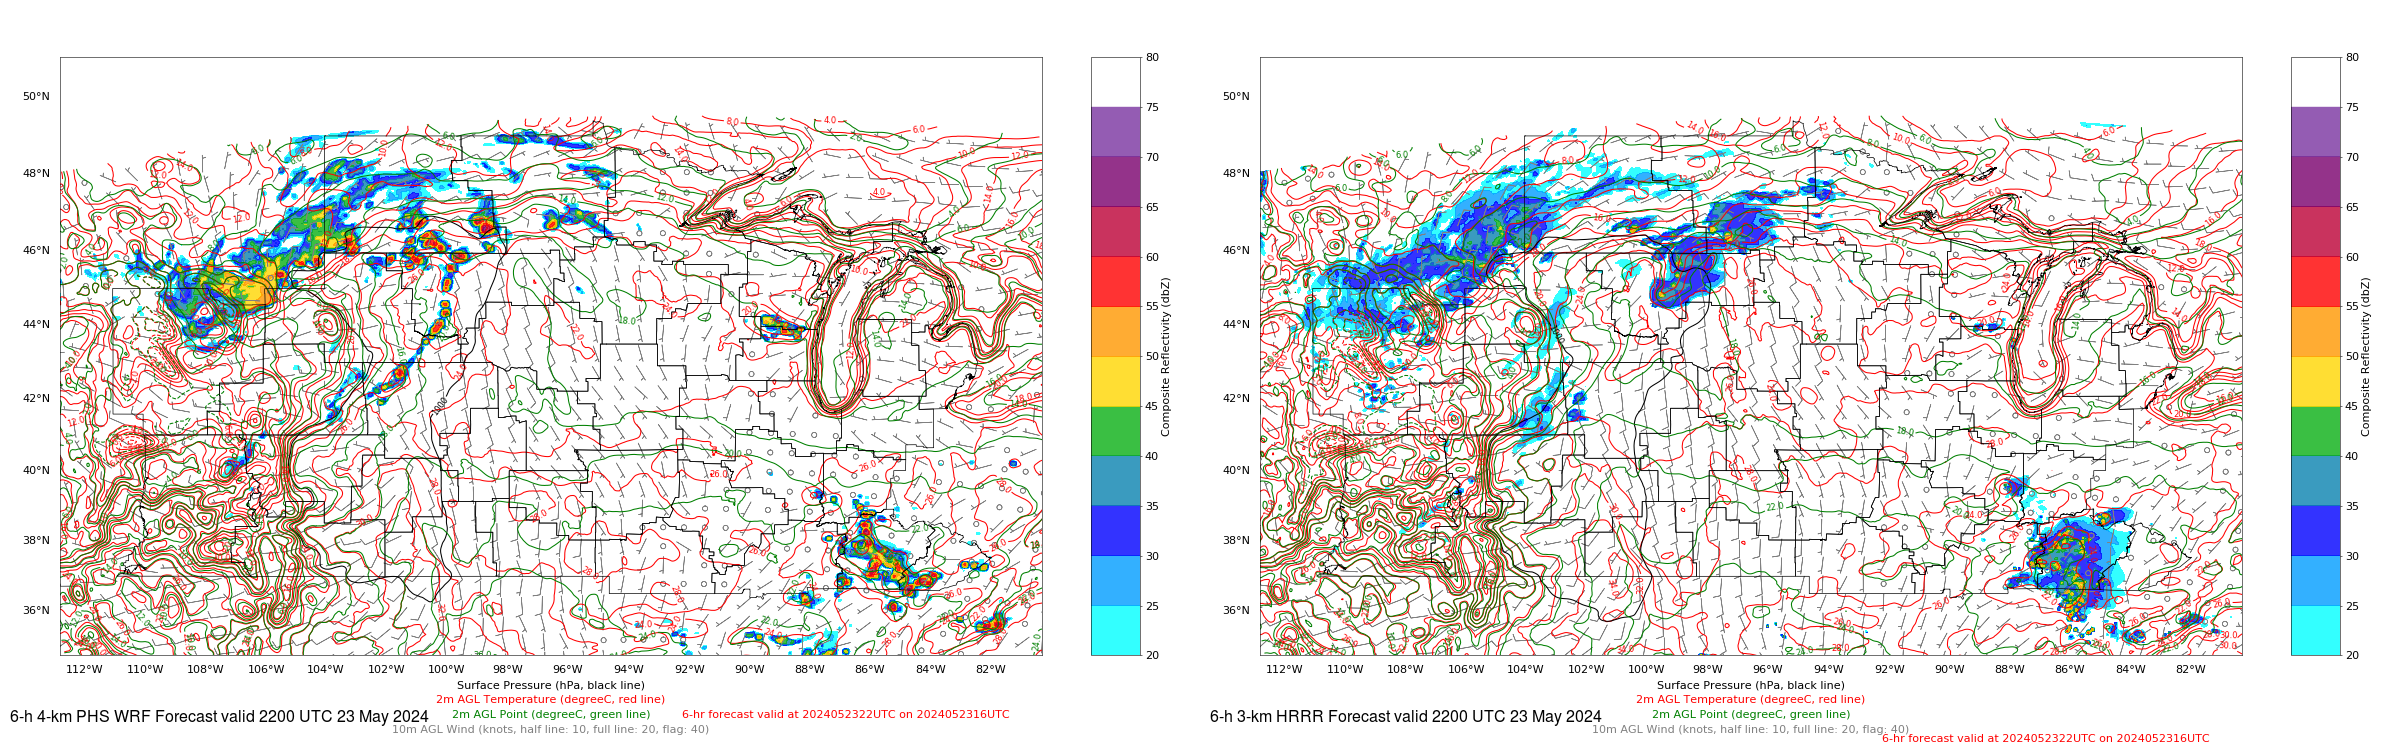
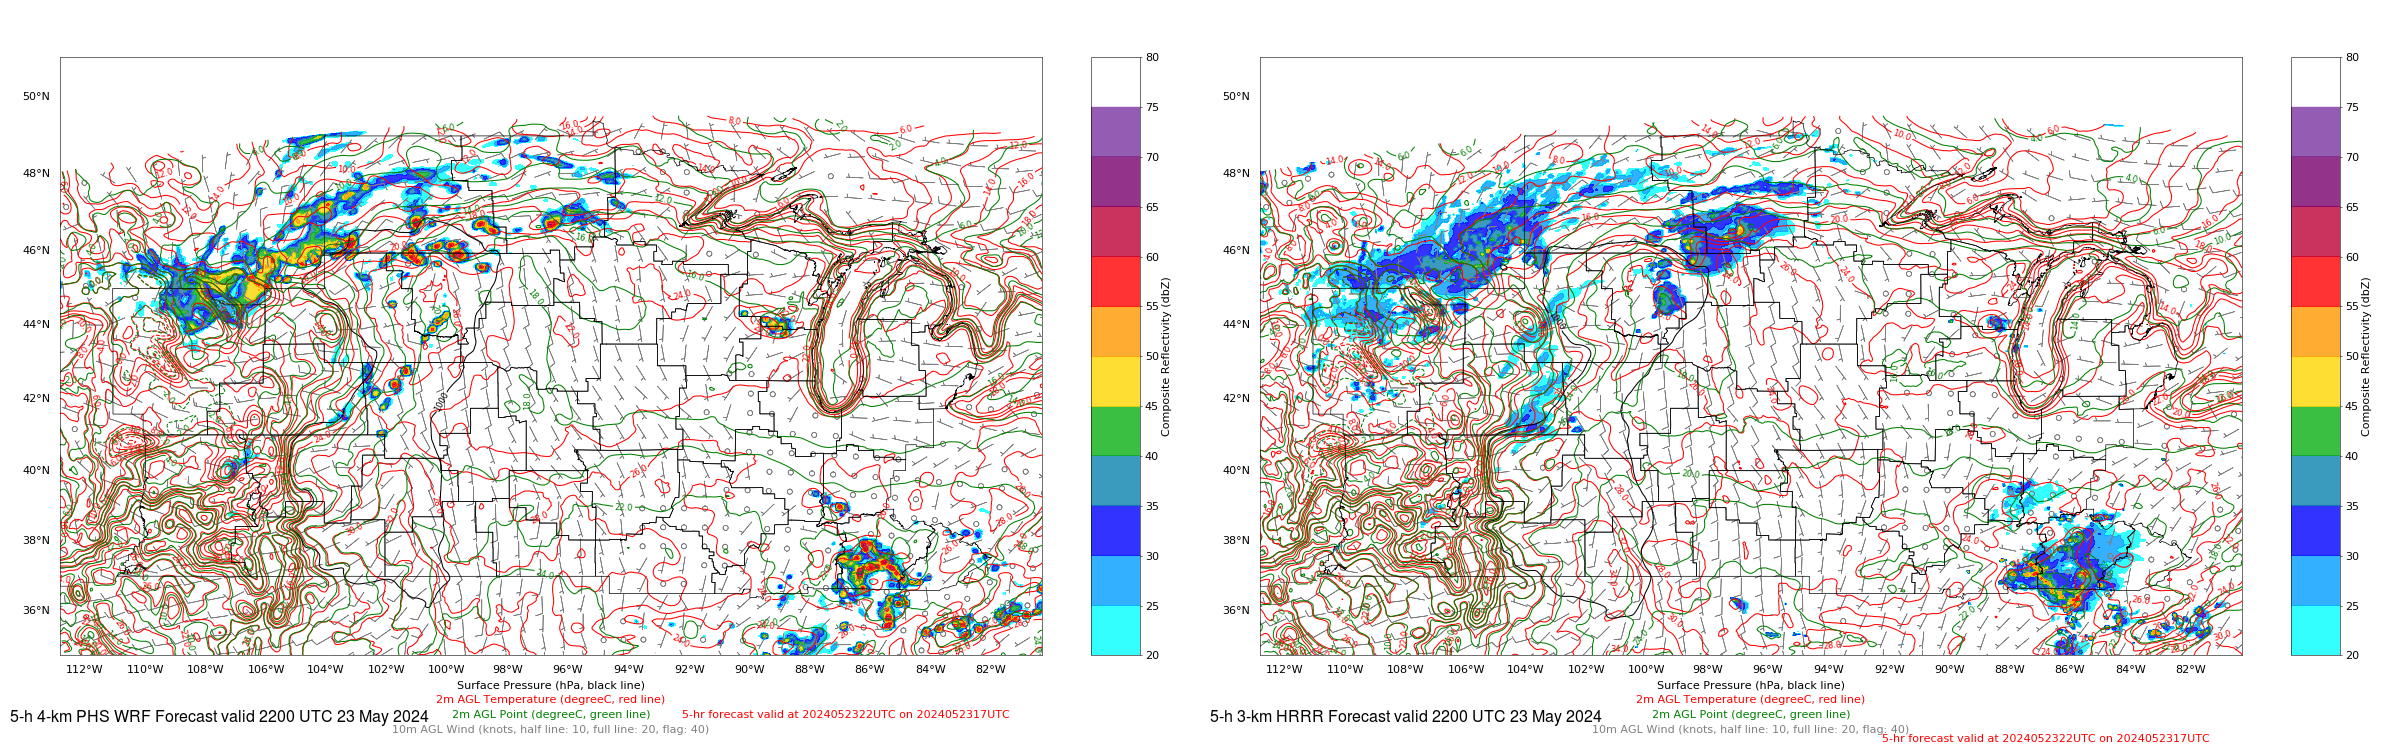
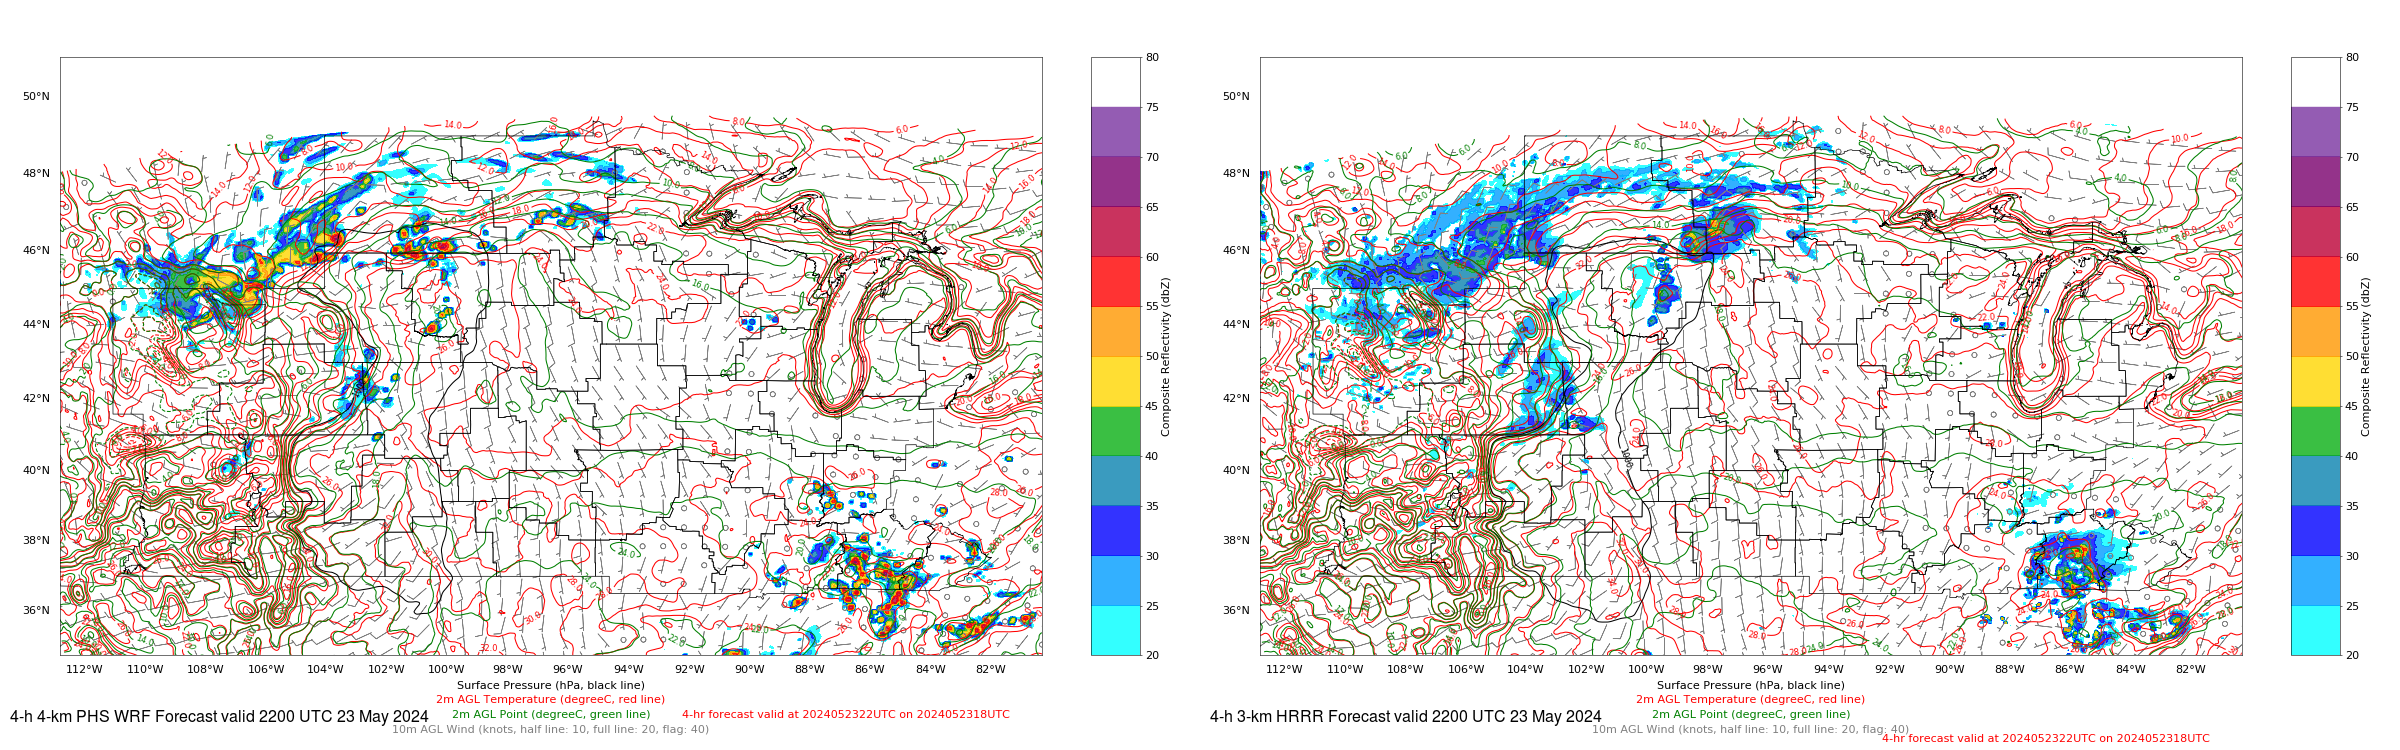
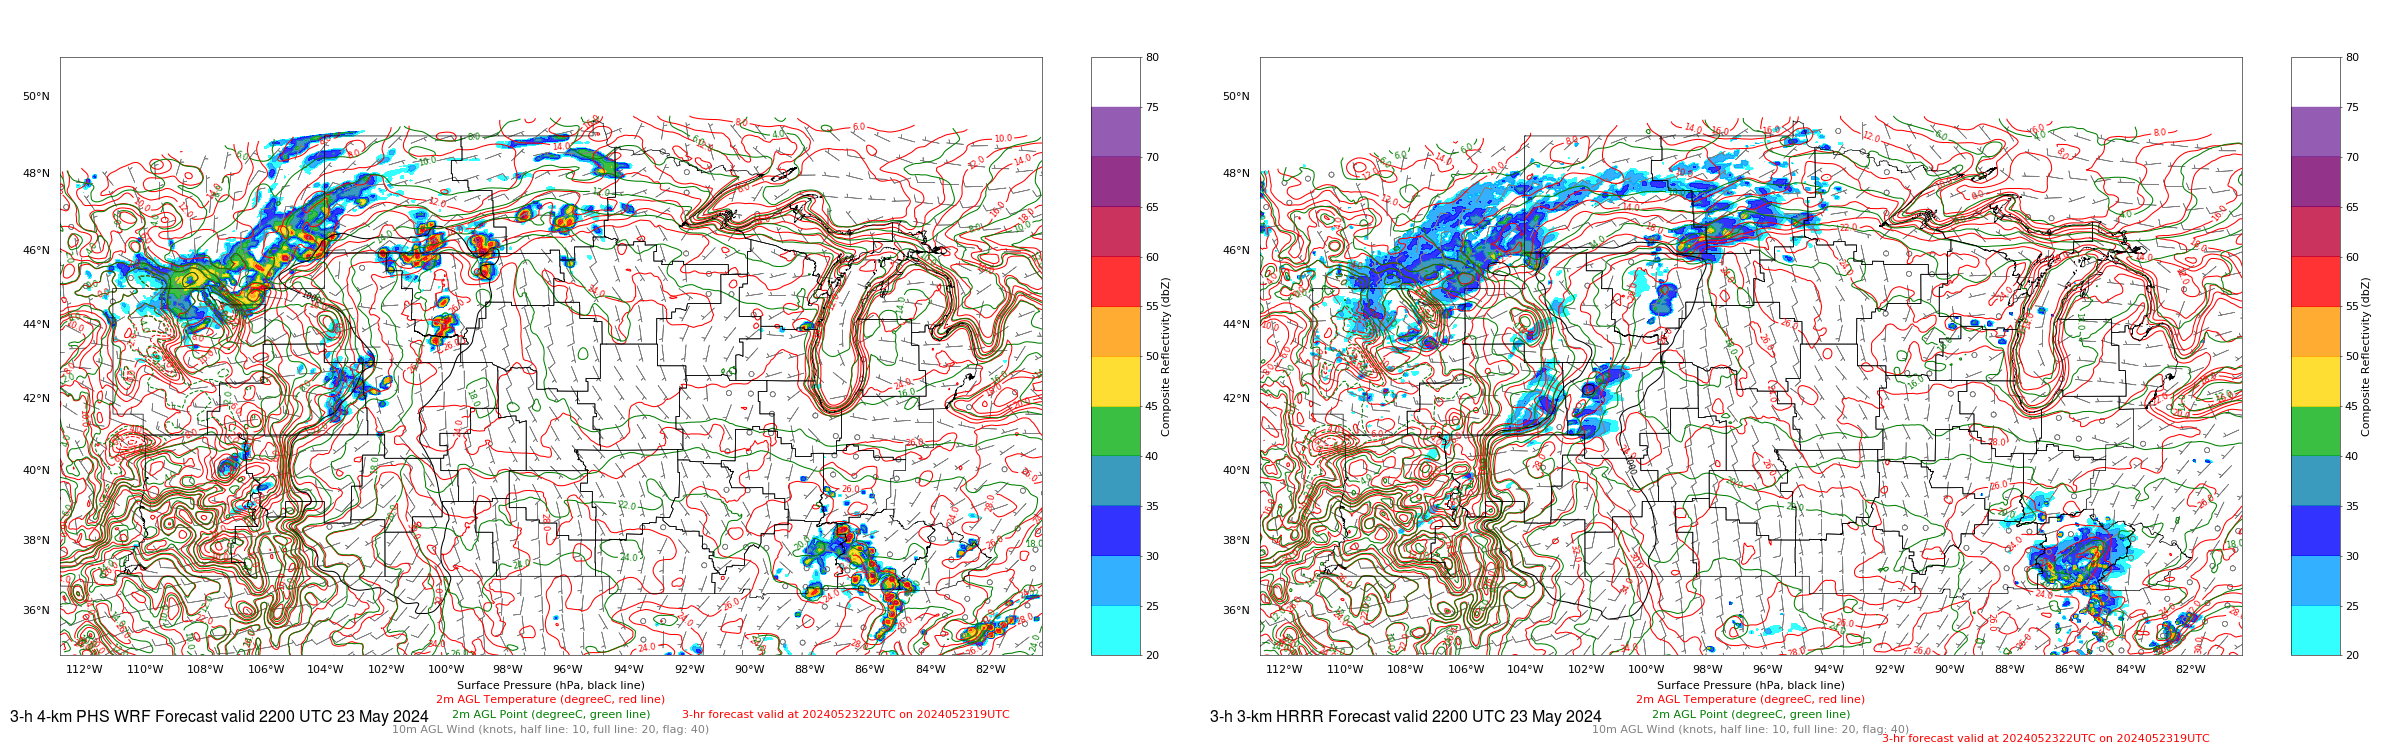
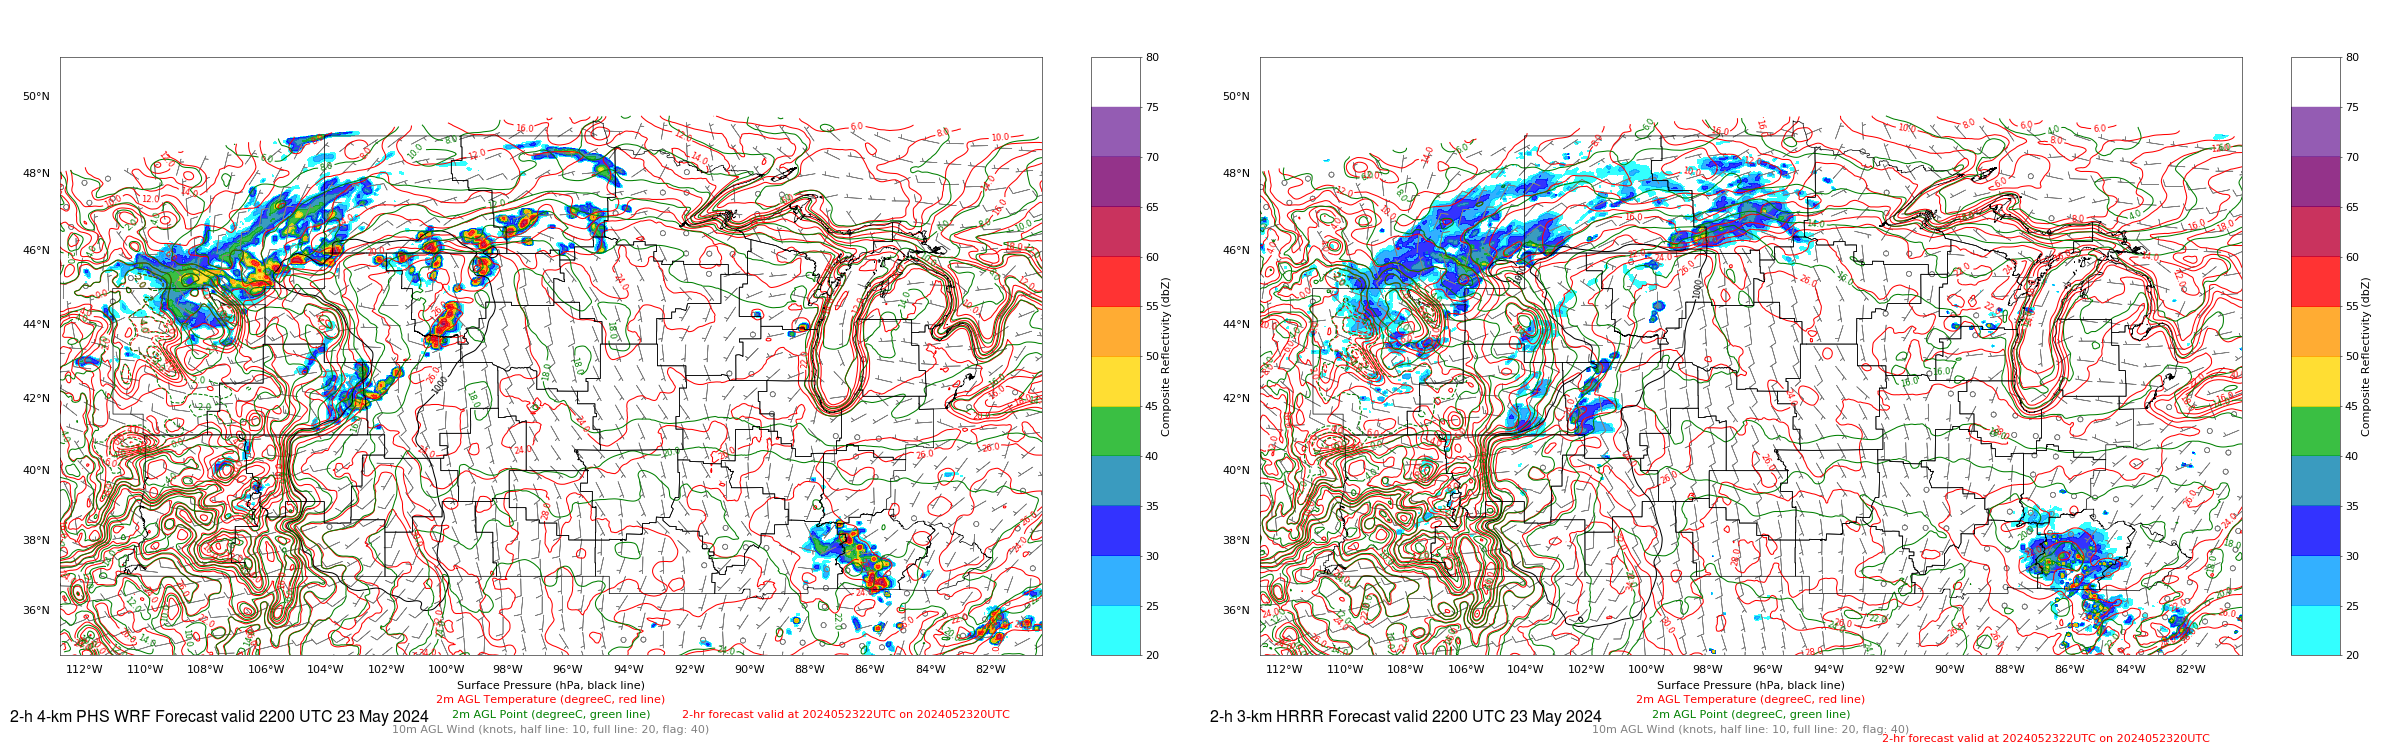
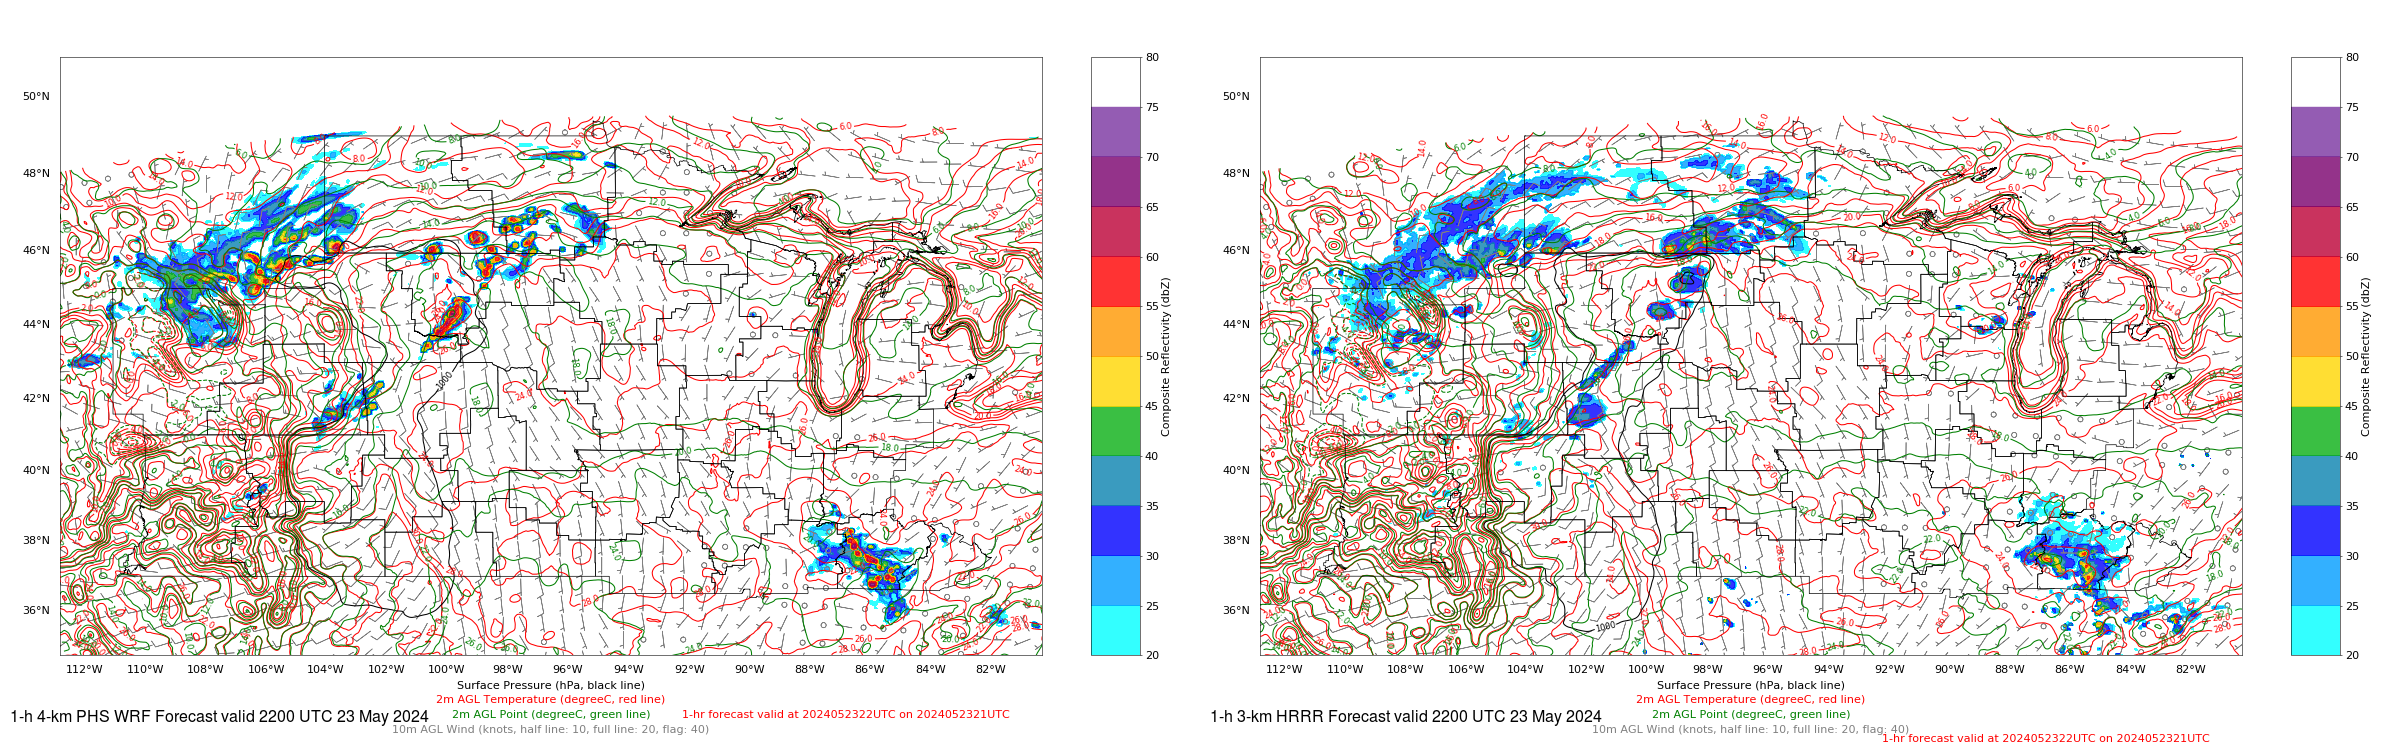
PHS Model Forecasts are available at this website. HRRR model forecasts are available here (and elsewhere). The following six figures compare the forecasts for 2200 UTC in forecasts initialized at 1600, 1700, 1800, 1900, 2000 and 2100 UTC, that is 6-h, 5-h, 4-h, 3-h, 2-h and 1-h forecasts. (Click here for an animation of the forecasts; For views of what was occurring between 2000 and 2220 UTC on 23 May, click here for the North Platte WFO and here for the Aberdeen WFO). The WRF model with assimilated PHS data showed stronger convection forming earlier, closer to the actual time of convective initiation, than was predicted by the HRRR model that does not include PHS information.
6-h forecasts of PHS Surface Mesoanalysis field (left) and HRRR Surface Mesoanalysis field (right) valid at 2200 UTC (Click to enlarge)5-h forecasts of PHS Surface Mesoanalysis field (left) and HRRR Surface Mesoanalysis field (right) valid at 2200 UTC (Click to enlarge)4-h forecasts of PHS Surface Mesoanalysis field (left) and HRRR Surface Mesoanalysis field (right) valid at 2200 UTC (Click to enlarge)3-h forecasts of PHS Surface Mesoanalysis field (left) and HRRR Surface Mesoanalysis field (right) valid at 2200 UTC (Click to enlarge)2-h forecasts of PHS Surface Mesoanalysis field (left) and HRRR Surface Mesoanalysis field (right) valid at 2200 UTC (Click to enlarge)1-h forecasts of PHS Surface Mesoanalysis field (left) and HRRR Surface Mesoanalysis field (right) valid at 2200 UTC (Click to enlarge)
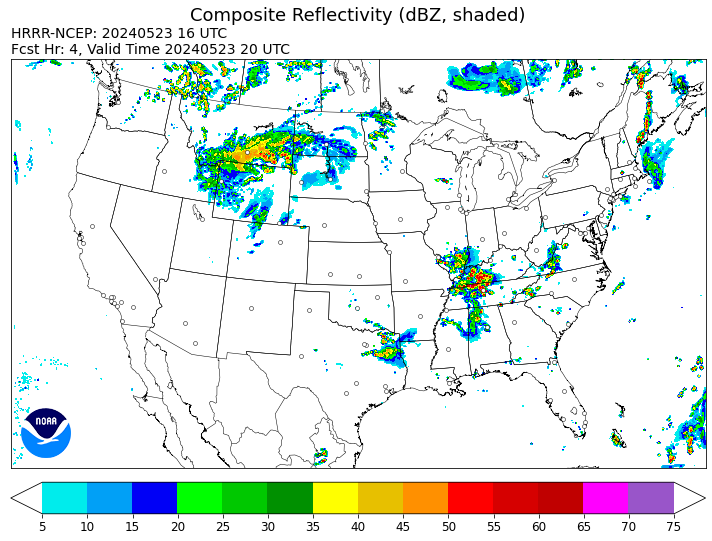
The image below also shows HRRR model output (initialized without any Polar Hyperspectral Sounding information) as available at this website. The forecast was too slow in initiating convection over Nebraska.
HRRR model output, 4-h forecast valid 2000 UTC on 23 May 2024 (click to enlarge)
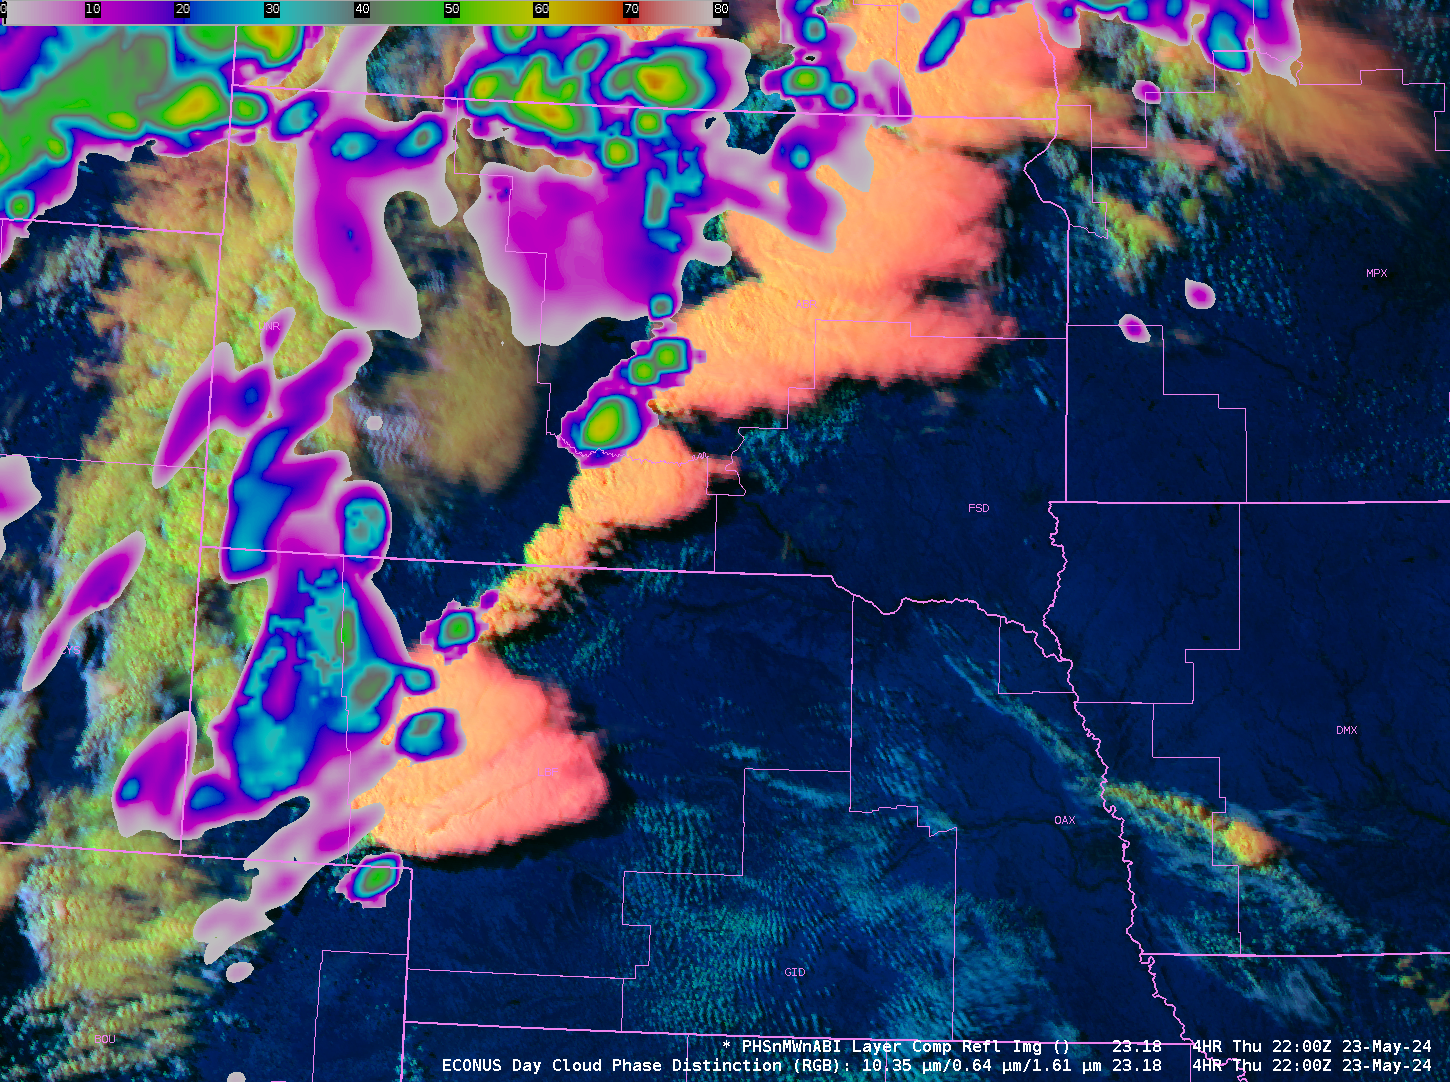
The stepped animations below show the hourly GOES-East Day Cloud Phase Distinction RGB over the northern High Plains from 2000-2300 UTC on 23 May, and the GOES-East Day Cloud Phase Distinction RGB overlain with the PHS forecasts of Composite Reflectivity at 2100, 2200 and 2300 UTC on 23 May. Strong convective growth is apparent in both fields. Severe weather was reported in both the North Platte and Aberdeen CWAs from this convection (SPC Storm Reports).
GOES-16 Day Cloud Phase Distinction RGB, hourly from 2000-2300 UTC on 23 May 2024 (Click to enlarge) National Weather Service forecast CWAs are indicated.GOES-16 Day Cloud Phase Distinction RGB, hourly from 2100-2300 UTC on 23 May 2024, overlain with forecast Composite Reflectivity from the 1800 UTC PHS WRF run (Click to enlarge) National Weather Service forecast CWAs are indicated.
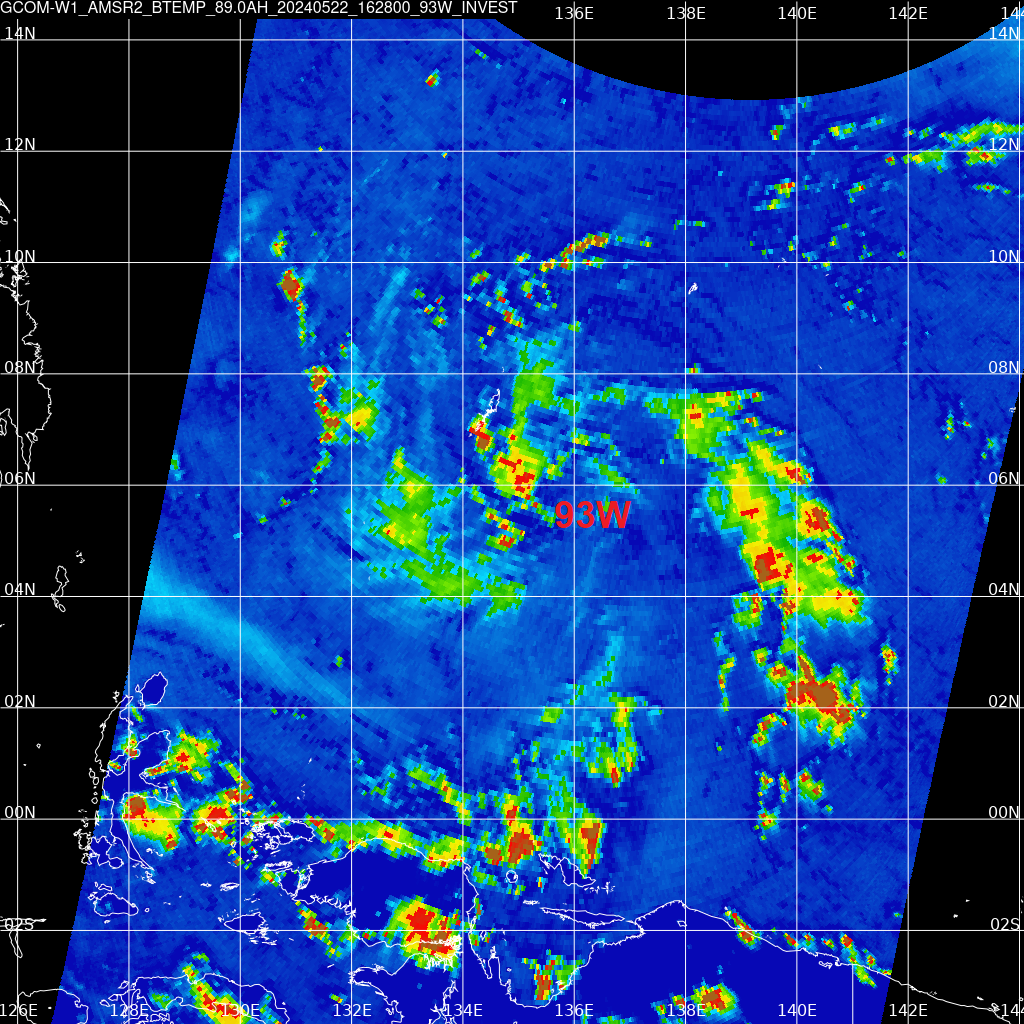
The AMSR-2 89-GHz brightness temperature image above (courtesy Brandon Aydlett, WFO GUM), from 1628 UTC on 22 May 2024 (downloaded at the Guam National Weather Service Direct Broadcast antenna and processed with CSPP software) shows curved convective bands around the center of Invest 93W in the western Pacific between Guam... Read More
GCOM-W1 AMSR-2 89 GHz Brightness Temperatures, 1628 UTC on 22 May 2024 (Click to enlarge)
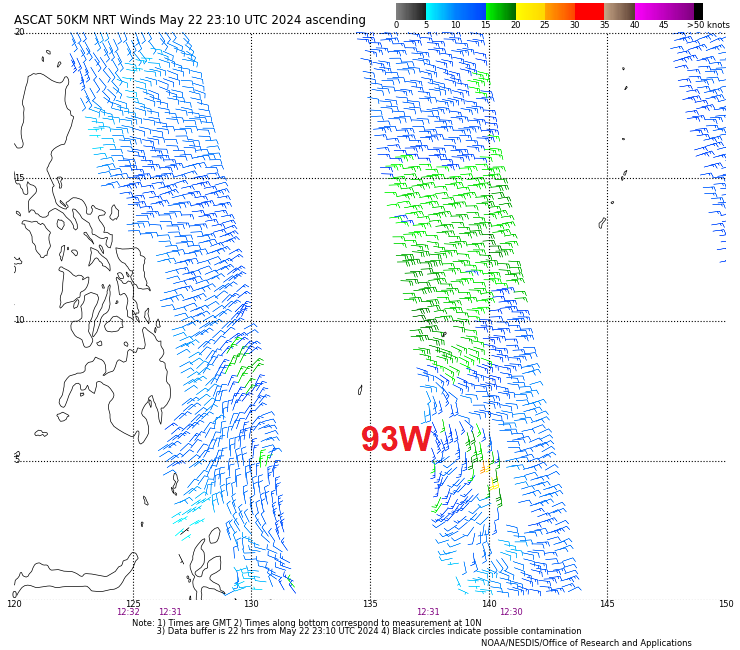
The AMSR-2 89-GHz brightness temperature image above (courtesy Brandon Aydlett, WFO GUM), from 1628 UTC on 22 May 2024 (downloaded at the Guam National Weather Service Direct Broadcast antenna and processed with CSPP software) shows curved convective bands around the center of Invest 93W in the western Pacific between Guam and the Philippines. Processed wind speeds from this overpass (not shown, but also available at the forecast office in Guam) showed maximum winds near 20 knots. Why is this data important? It allows forecasters on Guam information on a developing system, one that is in between ASCAT overpasses (see below), for better analysis, awareness and decision-making.
ASCAT winds from MetopC, ca. 1231 UTC on 22 May 2024 (Click to enlarge); The center of 93W is in between wind swaths
By 0000 UTC on 24 May 2024, below, this tropical disturbance was approaching the Phillippines. Small values of vertical wind shear and warm water temperatures will help it to organize; terrain over the Phillippines will interfere with any organization. For more information on this system, refer to the CIMSS Tropical Weather Website, the Joint Typhoon Warning Center, the JMA/Tokyo RSMC, and Pagasa in the Phillippines.
Longwave infrared imagery and SSTs/850-200 mb wind shear, 0000 UTC on 24 May 2024 (Click to enlarge)
Many thanks to Brandon Aydlett, Science and Observations Officer at WFO GUM for forwarding along the GCOM-W1 and ASCAT images!
The San Angelo TX forecast office (WFO SJT) was an area of focus during HWT at SPC on 22 May. This blog posts includes observations about how the model performed (other observations on PHS performance are in the HWT Blog here). The animation above shows updraft velocity at 500mb over... Read More
Modeled 500-mb updraft velocity hourly from 1800 to 2200 UTC on 22 May 2024, forecast hour as indicated (Click to enlarge)
The San Angelo TX forecast office (WFO SJT) was an area of focus during HWT at SPC on 22 May. This blog posts includes observations about how the model performed (other observations on PHS performance are in the HWT Blog here). The animation above shows updraft velocity at 500mb over the course of the afternoon. Strong convection developed during this time over the San Angelo WFO County Warning Area. What did the radar show? The animation below, from 1744 to 2054 UTC, shows a splitting cell within the white box after about 2000 UTC. Does the modeled convection above show a similar splitting behavior? An argument for yes can be made, although It’s hard to tell for certain given the 1-hour time step (A note on the timing of the convection: on 22 May 2024, all of the Convection-Allowing Models — CAMs — were late in developing convection). GOES-16 imagery below also shows the storm split.
Composite Reflectivity, 1744 – 2054 UTC on 22 May 2024 (Click to enlarge)GOES-16 Visible (Band 2, 0.64 µm) imagery, 1800-2300 UTC on 22 May 2024 (click to enlarge)
I also compared instability values on this day, both from the RAP-40km model run, from PHS, and from GOES-16. Those are shown in the toggle below. Note the PHS CAPE minimum under the strong convection over north-central Texas that is shown in the plot with GOES-16 CAPE that is clear-sky only. Overall, there is good agreement in the distribution of CAPEs
MUCAPE from PHS and RAP40, CAPE from GOES-16, 1800 UTC on 22 May 2024
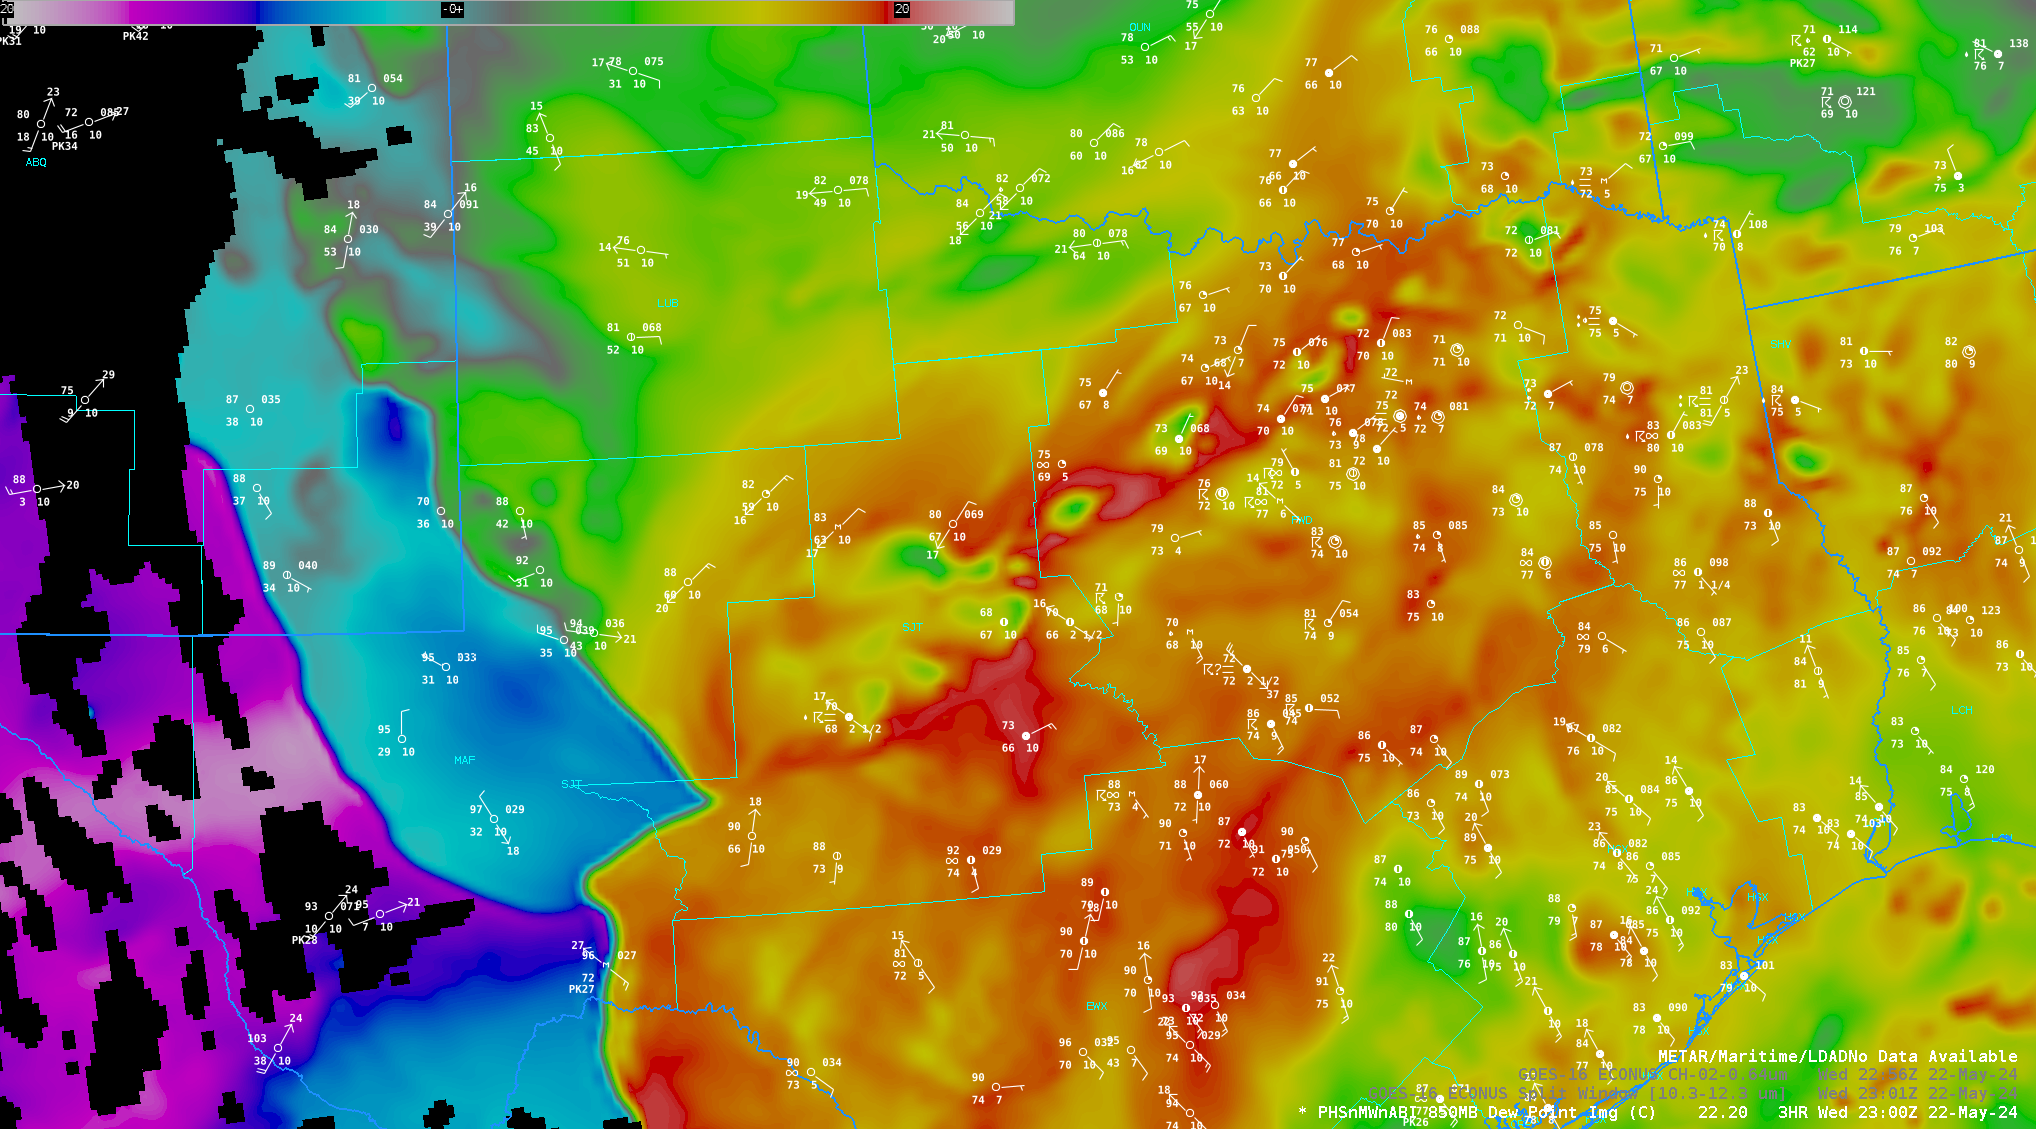
One thing that struck my eye in the 850-mb dewpoint field from PHS, shown below, was the notch of drying over southwest Texas, mostly west of WFO SJT. There’s fair agreement between that modeled dry air at 850 mb and the plotted surface dewpoints.
PHS 850-mb dewpoint temperatures, 1800-2300 UTC on 22 May 2024 (click to enlarge)
The GOES-16 Split Window Difference field for the same time shows a similar notch of dry air (that pinches off by 2300 UTC). In the enhancement used below, the dry air over west Texas is darker, the moist air over WFO SJT is lighter. Convection that develops as the dry slot pinches off shows as black in the enhancement below, and is also apparent in the GOES-16 visible imagery shown above.
GOES-16 Split Window Difference (10.3 µm – 12.3 µm) imagery, 1800-2300 UTC on 22 May 2024 (Click to enlarge)
HWT continues through Thursday 23 May 2024 in Norman. There is more information on this storm at the Satellite Liaison Blog.
Singapore Airlines Flight SQ321 encountered severe turbulence over Myanmar (flightradar24 blog) while en route from London to Singapore on 20-21 May 2024 — which resulted in dozens of injuries and 1 fatality. 10-minute interval JMA Himawari-9 AHI Visible and Infrared images (above) showed areas of deep convection developing over Myanmar, near the estimated location of... Read More
JMA Himawari-9 “Red” Visible (0.64 µm, left) and “Clean” Infrared Window (10.4 µm, right) images, with a cyan * marking the approximate location of the turbulence encounter at 0749 UTC on 21 May [click to play animated GIF | MP4]
Singapore Airlines Flight SQ321 encountered severe turbulence over Myanmar (flightradar24 blog) while en route from London to Singapore on 20-21 May 2024 — which resulted in dozens of injuries and 1 fatality. 10-minute interval JMA Himawari-9 AHI Visible and Infrared images (above) showed areas of deep convection developing over Myanmar, near the estimated location of the turbulence encounter at 0749 UTC on 21 May (southwest of Yangon International Airport, identifier VYYY). The main cluster of rapidly-developing convection in the vicinity of the turbulence event exhibited cloud-top infrared brightness temperatures as cold as -81.6ºC by 0800 UTC (violet-enhanced pixels); VYYY later reported a thunderstorm from 1030-1100 UTC.
A rocking animation of Himawari-9 Visible and Infrared images at 0740/0750/0800 UTC (below) helped to emphasize how rapidly the area of convection (that the aircraft likely flew over) was developing — from no apparent infrared signature at 0740 UTC to exhibiting minimum cloud-top infrared brightness temperatures of -72.3ºC at 0750 UTC and -81.6ºC at 0800 UTC. However, it is important to note that the Himawari-9 AHI instrument was actually scanning the Myanmar area about 3 minutes after the time stamp of each image — so on the 0740 UTC and 0750 UTC images, a cyan * symbol marked the approximate aircraft position at 0743 UTC and 0753 UTC (when the satellite was scanning that region; Flight SQ321 had exited the image scene by 0803 UTC).
Rocking animation of JMA Himawari-9 “Red” Visible (0.64 µm, left) and “Clean” Infrared Window (10.4 µm, right) images at 0740/0750/0800 UTC on 21 May; a cyan * symbol marked the approximate aircraft position at 0743 UTC and 0753 UTC [click to enlarge]
The 0750 UTC Himawari-9 Visible and Infrared images are shown below (a toggle between the individual Visible and Infrared images is available here). While the cyan * symbol making the approximate aircraft location at the 0753 UTC satellite scan time appeared to be well southeast of the rapidly-developing convection, another important consideration is parallax — for cloud tops of 30 kft and 50 kft over Myanmar, the parallax adjustments for those cloud tops would be toward the southeast at distances of 10 km (6.2 mi) and 17 km (10.6 mi), respectively.
JMA Himawari-9 “Red” Visible (0.64 µm, left) and “Clean” Infrared Window (10.4 µm, right) images at 0750 UTC on 21 May, with a cyan * marking the approximate location of the aircraft at 0753 UTC (when the satellite was scanning that region) [click to enlarge]
Himawari-9 Water Vapor images with contours of Moderate Or Greater (MOG) Turbulence Probability (source) began to display pockets of 50% or higher MOG probability over that area of Myanmar (yellow contours, just west of the top center portion of the images) at least an hour before the Flight SQ321 severe turbulence event.
JMA Himawari-9 Upper-level Water Vapor (6.2 µm) images, with contours of Moderate Or Greater (MOG) Turbulence Probability [click to play animated GIF | MP4]
A more zoomed-in view is shown below, with a plot of the flight path of SQ321 (here’s the loop as an animated gif).
JMA Himawari-9 Upper-level Water Vapor (6.2 µm) images, with contours of Moderate Or Greater (MOG) Turbulence Probability on 21 May. The flight path of SQ321 is plotted in purple (courtesy Sarah Griffin, CIMSS) [click to play MP4 animation]
Cloud Heights
An animation of the Himawari-9 Cloud Top Height (CTH) derived product is shown below — CTH values of several convective clouds reached 40-50 kft as Flight SQ321 was flying over that portion of Myanmar.
JMA Himawari-9 Cloud Top Height derived product on 21 May (courtesy Jay Hoffman, CIMSS) [click to play MP4 animation]
Stereoscopic visible imagery over the region of turbulence from Himawari-9 (left in the animation below) and GEOKOMPSAT-2A or GK-2A (on the right in the image below) shows the rapid vertical growth around the time of turbulence. To view the imagery in 3-dimensions, cross your eyes so that 3 images are present, and focus on the image in the center, as described here, where this technique is called ‘cross-viewing’.
Visible Imagery over southern Myanmar, Himawari-9 (Band 3, 0.64 µm, left) and GK-2A (Band 3, 0.64 µm, right), from 0600-0900 UTC on 21 May 2024 (imagery courtesy Scott Lindstrom, CIMSS) [click to enlarge]
GK2A imagery cropped from Full Disk imagery from this site, shown below from 0700 to 0800 UTC on 21 May, similarly show the development of strong convection over Myanmar.
GK2A Upper Level Water Vapor (6.3 µm) color-enhanced infrared imagery (left) and KMA’s Convective Storm RGB, 0700-0800 UTC on 21 May 2024 (Click to enlarge); Imagery courtesy Scott Lindstrom, CIMSS

