The Night Microphysics RGB animation from the CSPP Geosphere site (direct link to animation) below shows clouds of various heights (and temperatures). For example deep high clouds (likely precipitating) stretch northwest to southeast to the north of the Samoan Island chain. Low clouds are indicated over the three main Samoan islands: Savai’i, Upolu and Tutuila (from west to east), as indicated by the light violet/cyan enhancement over those islands. Given the stationary nature of the enhancement in the RGB, one might imagine the clouds perched atop the higher terrain of those three islands. At the end of the animation, note the north-south cloud band that is moving over Tutuila, the main island of American Samoa, shown in the annotated toggle below. Would you expect rain to fall from that line? You might not; after all, the lines of tropical cumulus south and east of the Samoan Islands do not show the color changes typical in developing cumulus in the Nighttime Microphysics RGB (as discussed here, for example).

GOES-18 GREMLIN fields, below, show persistent rains to the north of the Samoan Islands — especially after 1000 UTC — but no signal with the shallow cloud bands moving eastward to the south of this convective band.
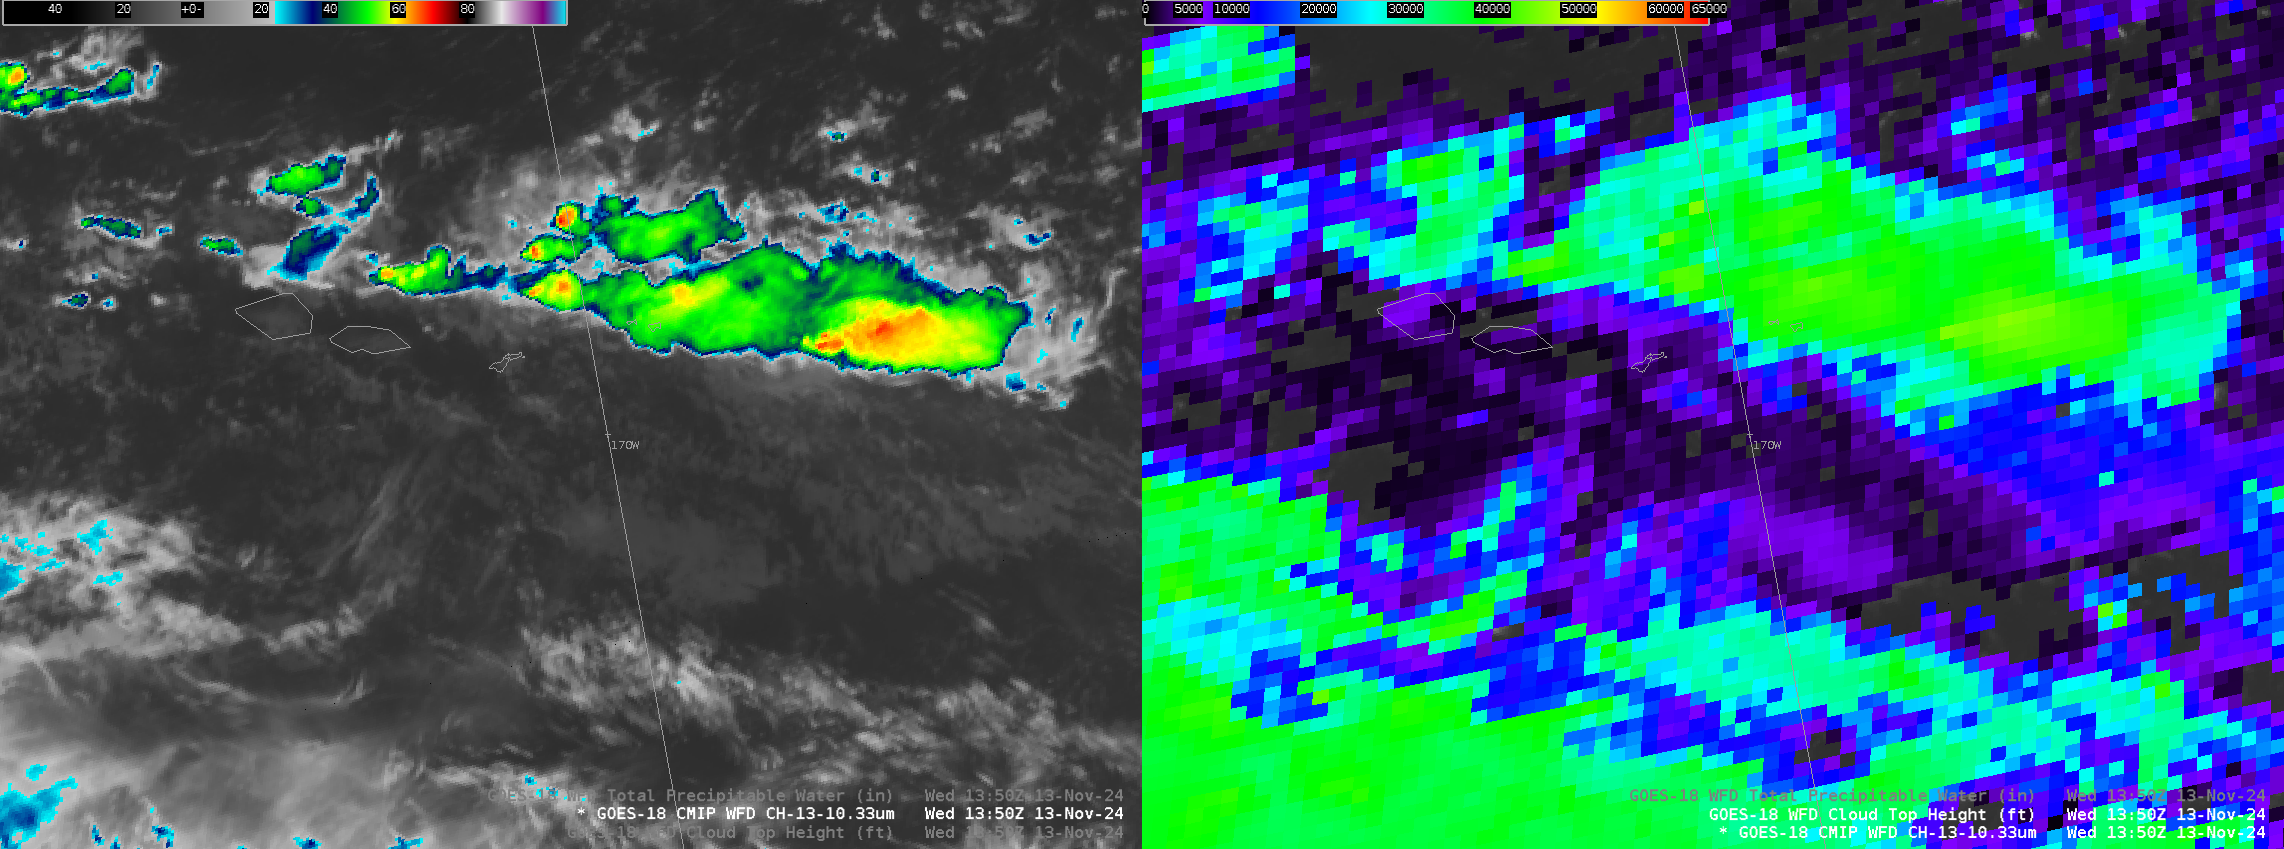
GOES-18 Clear-Sky Total Precipitable Water fields, shown below with Band 13 clean window infrared (10.3 µm) imagery, show the Samoan Islands in an atmosphere rich with moisture (values exceed 1.9″), with a slightly dryer atmosphere to the north and south.
At 1350 UTC, the time at the end of the Night Microphysics RGB shown at the top of the blog post, GOES-18 Cloud Top Heights are between 10000 and 15000 feet (three blue pixels) to the southeast of Tutuila. Values just north of Tutuila are closer to 6000 feet.
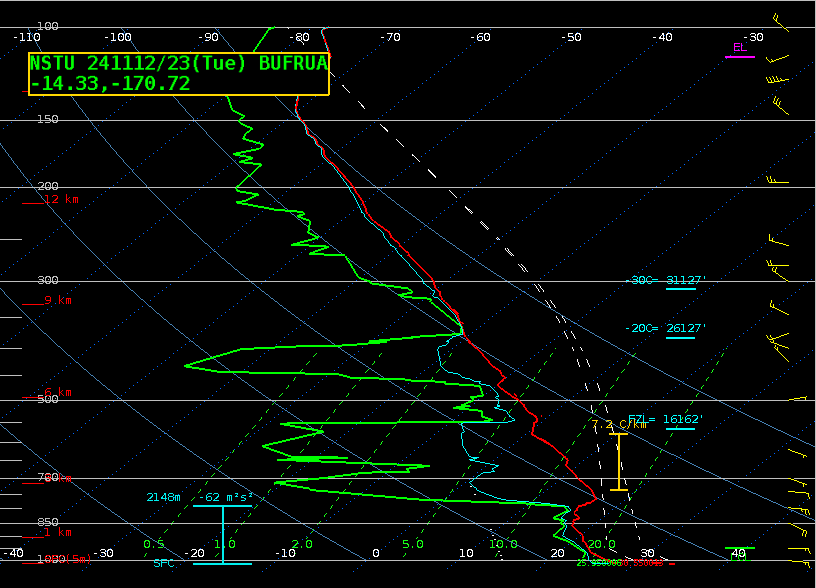
What was the stability of the atmosphere between 6000 and 16000 feet at this time? That’s a challenge. The Upper Air site at Pago Pago is launching balloons just once every two days — because of a gas shortage; a launch did occur at 2300 UTC on 12 November and that sounding is shown below.
NOAA-20 overflies American Samoa daily at about the times of the radiosonde launch. Sounding availability at 0120 UTC on 13 November 2024 is shown below. Let’s compare the satellite-derived NOAA-20 NUCAPS sounding to the west of Tutuila and to the west of Tutuila given the observation above. NUCAPS does capture the relatively dry air between 500 and 700 mb, and hints at the inversion above the moist boundary layer.
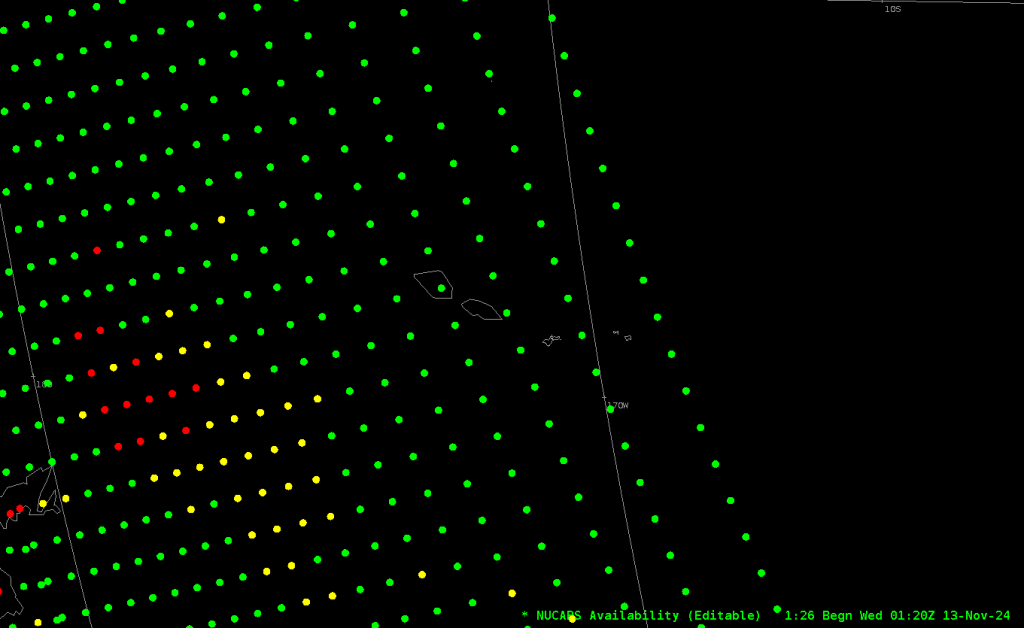
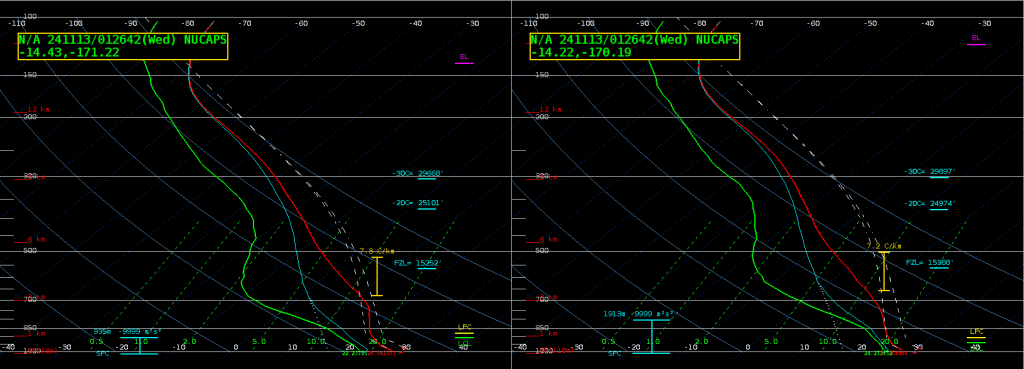
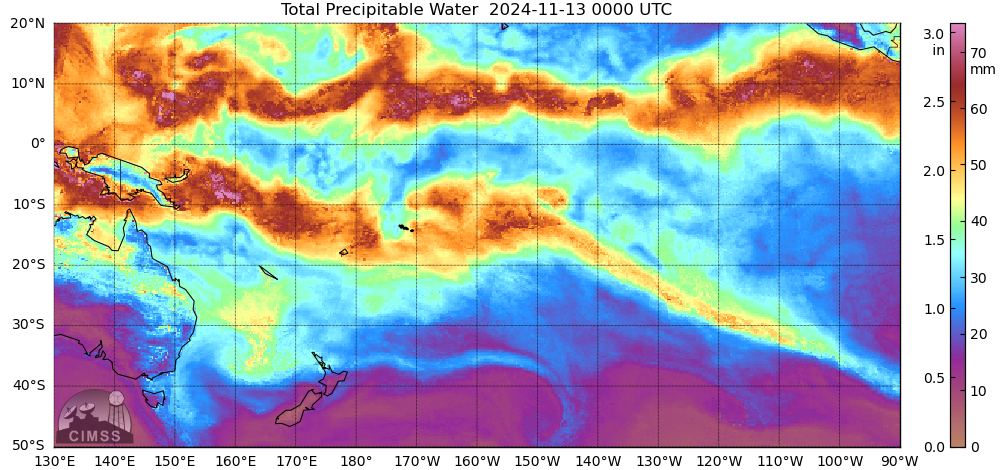
The western sounding above is considerably dryer than the sounding to the east: 1.54″ of PW vs. 1.92″ (note that the rawinsonde from NSTU had a computed PW of 1.75″. MIMIC TPW fields at 0000 UTC, below, show that strong gradient over the Samoan Islands that is captured in the soundings above. (Here’s an animation that shows the movement of that gradient).
At 1200 UTC, station NSTU/91765 did not launch a balloon. However, NOAA-20 overflew the site and the Sounding Availability plot is shown below. There are 4 NUCAPS soundings that surround Tutuila — to the NW, NE, SE and SW. They are shown below.
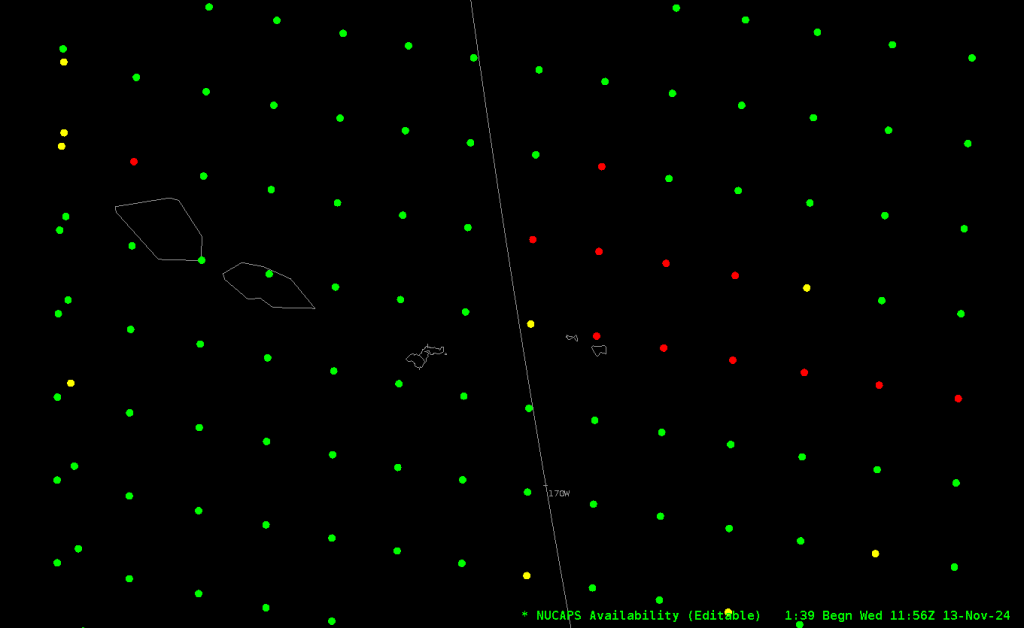
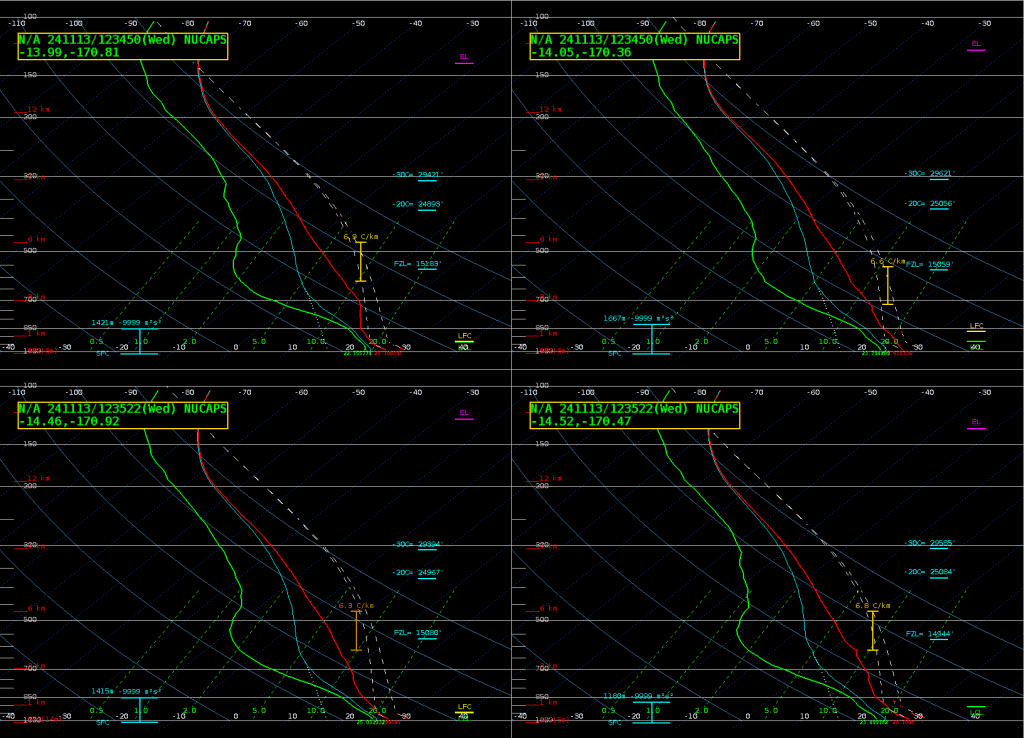
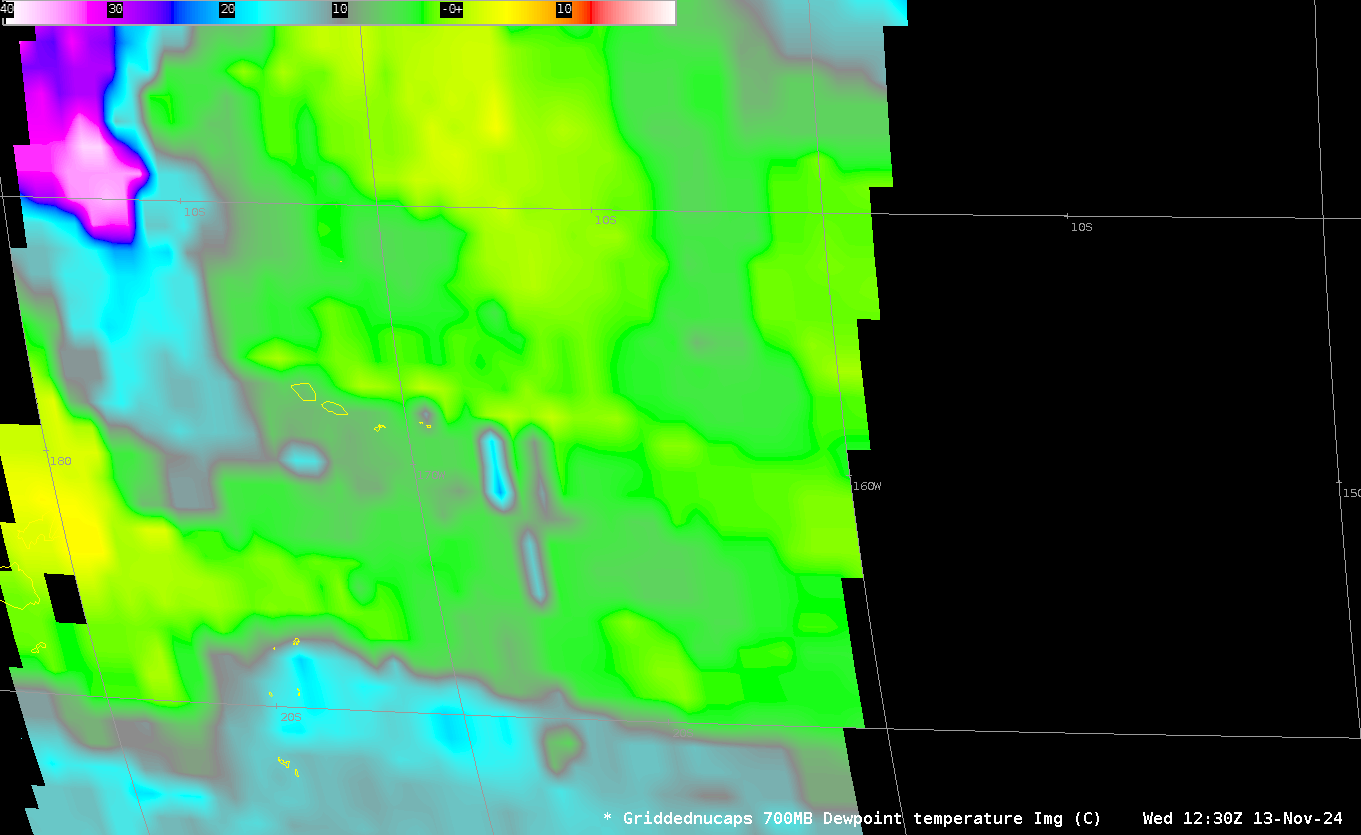
The 1200 UTC soundings all have similar Precipitable Waters (around 1.8″; here is the MIMIC TPW at 1200 UTC). Abundant moisture is present. That showers did not develop as over American Samoa reflects a combination of mid-level dry air (seen in the NUCAPS soundings above) and a lack of strong forcing. (My experience forecasting for Pago Pago is full of forecasts that did not verify!). Gridded NUCAPS fields, such as 700-mb Dewpoint Temperature, below, also showed the a tongue of dry air over Samoa.
Until (and after!) regular sounding launches recur at Pago Pago, continue to look at the NUCAPS soundings, and assess how they are changing from day to day. That will help you determine how upper levels over station 91765 are evolving.
View only this post Read Less


